
|
|||||
|
 | |
| |
| |
| |
| |
| |
|
Gene: CDC37L1 |
Gene summary for CDC37L1 |
| Gene information | Species | Human | Gene symbol | CDC37L1 | Gene ID | 55664 |
| Gene name | cell division cycle 37 like 1 | |
| Gene Alias | CDC37B | |
| Cytomap | 9p24.1 | |
| Gene Type | protein-coding | GO ID | GO:0006457 | UniProtAcc | Q7L3B6 |
Top |
Malignant transformation analysis |
| Identification of the aberrant gene expression in precancerous and cancerous lesions by comparing the gene expression of stem-like cells in diseased tissues with normal stem cells |
| Entrez ID | Symbol | Replicates | Species | Organ | Tissue | Adj P-value | Log2FC | Malignancy |
| 55664 | CDC37L1 | LZE4T | Human | Esophagus | ESCC | 5.35e-07 | 4.00e-01 | 0.0811 |
| 55664 | CDC37L1 | LZE8T | Human | Esophagus | ESCC | 1.74e-10 | 1.59e-01 | 0.067 |
| 55664 | CDC37L1 | LZE20T | Human | Esophagus | ESCC | 8.33e-05 | 1.23e-01 | 0.0662 |
| 55664 | CDC37L1 | LZE22T | Human | Esophagus | ESCC | 8.68e-04 | 1.45e-01 | 0.068 |
| 55664 | CDC37L1 | LZE24T | Human | Esophagus | ESCC | 8.56e-17 | 5.53e-01 | 0.0596 |
| 55664 | CDC37L1 | LZE6T | Human | Esophagus | ESCC | 1.05e-04 | 2.76e-01 | 0.0845 |
| 55664 | CDC37L1 | P1T-E | Human | Esophagus | ESCC | 7.92e-05 | 9.70e-02 | 0.0875 |
| 55664 | CDC37L1 | P2T-E | Human | Esophagus | ESCC | 1.07e-13 | 1.76e-01 | 0.1177 |
| 55664 | CDC37L1 | P4T-E | Human | Esophagus | ESCC | 9.67e-16 | 2.63e-01 | 0.1323 |
| 55664 | CDC37L1 | P5T-E | Human | Esophagus | ESCC | 4.87e-13 | 6.22e-02 | 0.1327 |
| 55664 | CDC37L1 | P8T-E | Human | Esophagus | ESCC | 2.28e-12 | 7.48e-02 | 0.0889 |
| 55664 | CDC37L1 | P9T-E | Human | Esophagus | ESCC | 4.41e-23 | 2.55e-01 | 0.1131 |
| 55664 | CDC37L1 | P10T-E | Human | Esophagus | ESCC | 1.54e-26 | 1.86e-01 | 0.116 |
| 55664 | CDC37L1 | P11T-E | Human | Esophagus | ESCC | 2.45e-10 | 5.46e-01 | 0.1426 |
| 55664 | CDC37L1 | P12T-E | Human | Esophagus | ESCC | 1.42e-19 | 2.73e-01 | 0.1122 |
| 55664 | CDC37L1 | P15T-E | Human | Esophagus | ESCC | 5.08e-13 | 3.56e-01 | 0.1149 |
| 55664 | CDC37L1 | P16T-E | Human | Esophagus | ESCC | 7.39e-15 | 1.52e-01 | 0.1153 |
| 55664 | CDC37L1 | P17T-E | Human | Esophagus | ESCC | 8.27e-06 | 2.52e-01 | 0.1278 |
| 55664 | CDC37L1 | P19T-E | Human | Esophagus | ESCC | 1.86e-05 | 3.28e-01 | 0.1662 |
| 55664 | CDC37L1 | P20T-E | Human | Esophagus | ESCC | 1.78e-16 | 1.84e-01 | 0.1124 |
| Page: 1 2 3 4 5 |
| Tissue | Expression Dynamics | Abbreviation |
| Esophagus |  | ESCC: Esophageal squamous cell carcinoma |
| HGIN: High-grade intraepithelial neoplasias | ||
| LGIN: Low-grade intraepithelial neoplasias | ||
| Oral Cavity | 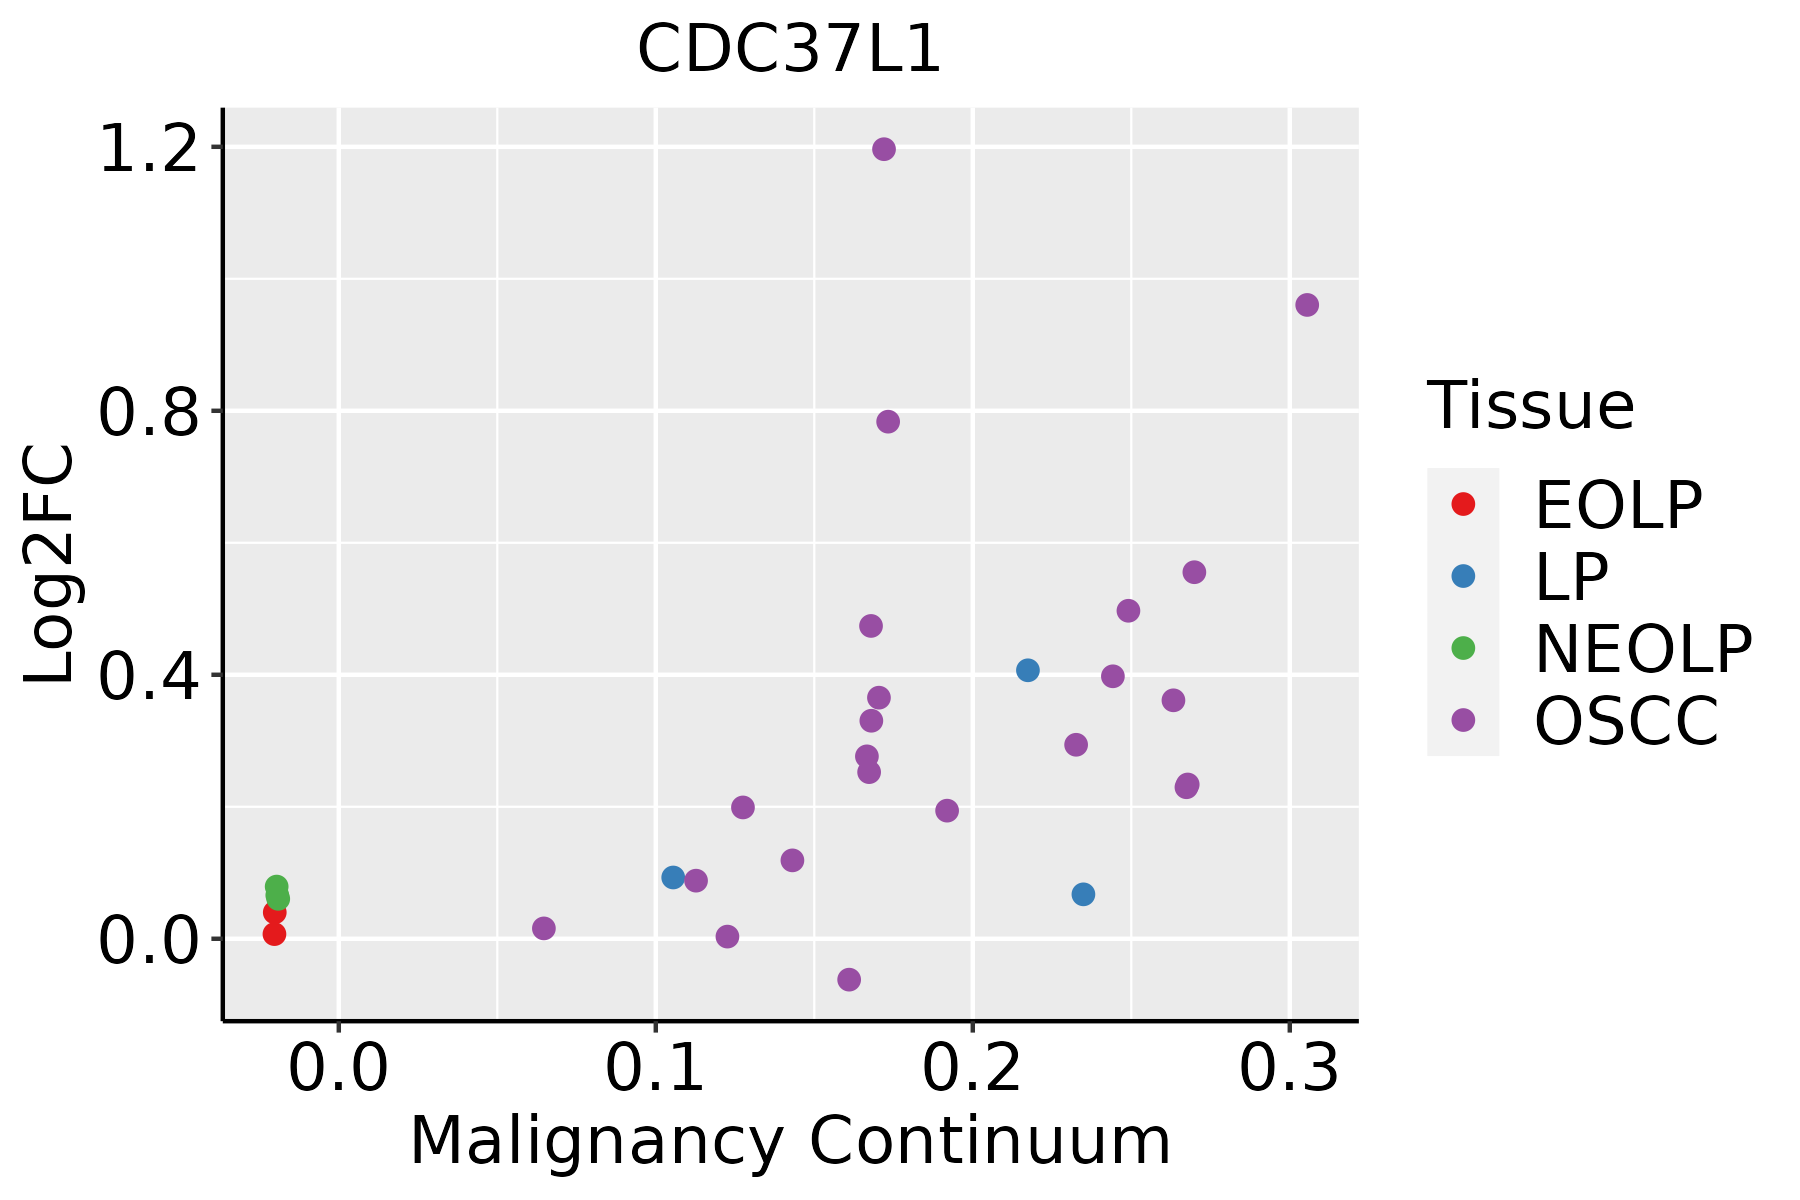 | EOLP: Erosive Oral lichen planus |
| LP: leukoplakia | ||
| NEOLP: Non-erosive oral lichen planus | ||
| OSCC: Oral squamous cell carcinoma | ||
| Thyroid |  | ATC: Anaplastic thyroid cancer |
| HT: Hashimoto's thyroiditis | ||
| PTC: Papillary thyroid cancer |
| ∗log2FC in expression of this searched gene in stem-like cells from each diseased tissue sample relative to stem-like cells in normal samples in each tissue plotted against the malignancy continuum. Samples are colored based on if they are from different disease stage. |
Top |
Malignant transformation related pathway analysis |
| Find out the enriched GO biological processes and KEGG pathways involved in transition from healthy to precancer to cancer |
| Tissue | Disease Stage | Enriched GO biological Processes |
| Colorectum | AD |  |
| Colorectum | SER |  |
| Colorectum | MSS |  |
| Colorectum | MSI-H |  |
| Colorectum | FAP |  |
| ∗Top 15 enriched GO BP terms are showed in the bar plot of each disease state in each tissue. Each row represents a significant GO biological process which is colored according to the -log10(p.adjust). |
| Page: 1 2 3 4 5 6 7 8 9 |
| GO ID | Tissue | Disease Stage | Description | Gene Ratio | Bg Ratio | pvalue | p.adjust | Count |
| GO:0031647111 | Esophagus | ESCC | regulation of protein stability | 223/8552 | 298/18723 | 5.76e-25 | 1.52e-22 | 223 |
| GO:0006457110 | Esophagus | ESCC | protein folding | 163/8552 | 212/18723 | 1.13e-20 | 1.74e-18 | 163 |
| GO:0050821111 | Esophagus | ESCC | protein stabilization | 140/8552 | 191/18723 | 6.50e-15 | 3.61e-13 | 140 |
| GO:000645718 | Oral cavity | OSCC | protein folding | 154/7305 | 212/18723 | 1.89e-23 | 4.60e-21 | 154 |
| GO:003164720 | Oral cavity | OSCC | regulation of protein stability | 193/7305 | 298/18723 | 1.30e-19 | 1.95e-17 | 193 |
| GO:005082120 | Oral cavity | OSCC | protein stabilization | 122/7305 | 191/18723 | 2.69e-12 | 1.09e-10 | 122 |
| GO:0006457112 | Thyroid | PTC | protein folding | 137/5968 | 212/18723 | 8.29e-23 | 2.01e-20 | 137 |
| GO:0031647113 | Thyroid | PTC | regulation of protein stability | 174/5968 | 298/18723 | 2.05e-21 | 4.05e-19 | 174 |
| GO:0050821113 | Thyroid | PTC | protein stabilization | 115/5968 | 191/18723 | 5.67e-16 | 4.31e-14 | 115 |
| GO:000645733 | Thyroid | ATC | protein folding | 140/6293 | 212/18723 | 3.46e-22 | 8.09e-20 | 140 |
| GO:003164734 | Thyroid | ATC | regulation of protein stability | 177/6293 | 298/18723 | 4.08e-20 | 6.46e-18 | 177 |
| GO:005082134 | Thyroid | ATC | protein stabilization | 117/6293 | 191/18723 | 3.98e-15 | 2.71e-13 | 117 |
| Page: 1 |
| Pathway ID | Tissue | Disease Stage | Description | Gene Ratio | Bg Ratio | pvalue | p.adjust | qvalue | Count |
| Page: 1 |
Top |
Cell-cell communication analysis |
| Identification of potential cell-cell interactions between two cell types and their ligand-receptor pairs for different disease states |
| Ligand | Receptor | LRpair | Pathway | Tissue | Disease Stage |
| Page: 1 |
Top |
Single-cell gene regulatory network inference analysis |
| Find out the significant the regulons (TFs) and the target genes of each regulon across cell types for different disease states |
| TF | Cell Type | Tissue | Disease Stage | Target Gene | RSS | Regulon Activity |
| ∗The dot plots of a searched regulon are shown for all cell subpopulations in each disease state of each tissue based on the regulon specific score inferred using pySCENIC and by calculating the average expression. |
| Page: 1 |
Top |
Somatic mutation of malignant transformation related genes |
| Annotation of somatic variants for genes involved in malignant transformation |
| Hugo Symbol | Variant Class | Variant Classification | dbSNP RS | HGVSc | HGVSp | HGVSp Short | SWISSPROT | BIOTYPE | SIFT | PolyPhen | Tumor Sample Barcode | Tissue | Histology | Sex | Age | Stage | Therapy Types | Drugs | Outcome |
| CDC37L1 | SNV | Missense_Mutation | c.164N>G | p.Gln55Arg | p.Q55R | Q7L3B6 | protein_coding | deleterious(0.04) | possibly_damaging(0.78) | TCGA-AN-A0XN-01 | Breast | breast invasive carcinoma | Female | >=65 | III/IV | Unknown | Unknown | SD | |
| CDC37L1 | SNV | Missense_Mutation | c.607N>T | p.His203Tyr | p.H203Y | Q7L3B6 | protein_coding | tolerated(0.1) | possibly_damaging(0.884) | TCGA-BH-A0DL-01 | Breast | breast invasive carcinoma | Female | <65 | I/II | Chemotherapy | cytoxan | CR | |
| CDC37L1 | SNV | Missense_Mutation | rs372436527 | c.844N>G | p.Met282Val | p.M282V | Q7L3B6 | protein_coding | tolerated(0.25) | benign(0.003) | TCGA-E2-A14S-01 | Breast | breast invasive carcinoma | Female | >=65 | I/II | Chemotherapy | cytoxan | SD |
| CDC37L1 | SNV | Missense_Mutation | novel | c.751N>C | p.Glu251Gln | p.E251Q | Q7L3B6 | protein_coding | tolerated(0.14) | possibly_damaging(0.588) | TCGA-EW-A1J5-01 | Breast | breast invasive carcinoma | Female | <65 | I/II | Chemotherapy | adriamycin | SD |
| CDC37L1 | SNV | Missense_Mutation | rs756219911 | c.725N>A | p.Arg242His | p.R242H | Q7L3B6 | protein_coding | deleterious(0) | probably_damaging(0.996) | TCGA-G4-6317-01 | Colorectum | colon adenocarcinoma | Female | <65 | III/IV | Chemotherapy | fluorouracil | PD |
| CDC37L1 | SNV | Missense_Mutation | rs750184463 | c.437N>T | p.Arg146Ile | p.R146I | Q7L3B6 | protein_coding | deleterious(0.04) | benign(0.062) | TCGA-EI-6917-01 | Colorectum | rectum adenocarcinoma | Male | <65 | III/IV | Chemotherapy | 5fluorouracil+oxaciplatina+l-folinian | SD |
| CDC37L1 | insertion | Frame_Shift_Ins | novel | c.943_944insCATACATATATATT | p.Ala316TyrfsTer10 | p.A316Yfs*10 | Q7L3B6 | protein_coding | TCGA-AM-5820-01 | Colorectum | colon adenocarcinoma | Female | <65 | I/II | Unknown | Unknown | SD | ||
| CDC37L1 | SNV | Missense_Mutation | novel | c.548N>A | p.Ser183Tyr | p.S183Y | Q7L3B6 | protein_coding | deleterious(0) | probably_damaging(0.93) | TCGA-A5-A0G2-01 | Endometrium | uterine corpus endometrioid carcinoma | Female | <65 | III/IV | Unknown | Unknown | SD |
| CDC37L1 | SNV | Missense_Mutation | novel | c.128N>T | p.Ala43Val | p.A43V | Q7L3B6 | protein_coding | tolerated(0.12) | benign(0.001) | TCGA-A5-A1OG-01 | Endometrium | uterine corpus endometrioid carcinoma | Female | >=65 | III/IV | Chemotherapy | taxol | PD |
| CDC37L1 | SNV | Missense_Mutation | novel | c.889N>A | p.Gly297Ser | p.G297S | Q7L3B6 | protein_coding | tolerated(0.13) | benign(0.14) | TCGA-AJ-A3EK-01 | Endometrium | uterine corpus endometrioid carcinoma | Female | <65 | I/II | Chemotherapy | carboplatin | CR |
| Page: 1 2 3 4 |
Top |
Related drugs of malignant transformation related genes |
| Identification of chemicals and drugs interact with genes involved in malignant transfromation |
| (DGIdb 4.0) |
| Entrez ID | Symbol | Category | Interaction Types | Drug Claim Name | Drug Name | PMIDs |
| Page: 1 |

Copyright 2023-Present -The University of Texas Health Science Center at Houston |