
|
|||||
|
 | |
| |
| |
| |
| |
| |
|
Gene: CDC34 |
Gene summary for CDC34 |
| Gene information | Species | Human | Gene symbol | CDC34 | Gene ID | 997 |
| Gene name | cell division cycle 34, ubiqiutin conjugating enzyme | |
| Gene Alias | E2-CDC34 | |
| Cytomap | 19p13.3 | |
| Gene Type | protein-coding | GO ID | GO:0000082 | UniProtAcc | A0A024R1Z1 |
Top |
Malignant transformation analysis |
| Identification of the aberrant gene expression in precancerous and cancerous lesions by comparing the gene expression of stem-like cells in diseased tissues with normal stem cells |
| Entrez ID | Symbol | Replicates | Species | Organ | Tissue | Adj P-value | Log2FC | Malignancy |
| 997 | CDC34 | LZE24T | Human | Esophagus | ESCC | 8.09e-04 | 5.93e-02 | 0.0596 |
| 997 | CDC34 | P1T-E | Human | Esophagus | ESCC | 6.45e-09 | 2.47e-01 | 0.0875 |
| 997 | CDC34 | P2T-E | Human | Esophagus | ESCC | 8.89e-14 | 1.45e-01 | 0.1177 |
| 997 | CDC34 | P4T-E | Human | Esophagus | ESCC | 4.45e-19 | 3.93e-01 | 0.1323 |
| 997 | CDC34 | P5T-E | Human | Esophagus | ESCC | 2.28e-14 | 2.73e-01 | 0.1327 |
| 997 | CDC34 | P8T-E | Human | Esophagus | ESCC | 1.09e-05 | 6.09e-02 | 0.0889 |
| 997 | CDC34 | P9T-E | Human | Esophagus | ESCC | 3.92e-07 | 9.25e-02 | 0.1131 |
| 997 | CDC34 | P10T-E | Human | Esophagus | ESCC | 1.72e-11 | 1.22e-01 | 0.116 |
| 997 | CDC34 | P11T-E | Human | Esophagus | ESCC | 9.45e-10 | 3.82e-01 | 0.1426 |
| 997 | CDC34 | P12T-E | Human | Esophagus | ESCC | 1.08e-08 | 1.05e-01 | 0.1122 |
| 997 | CDC34 | P15T-E | Human | Esophagus | ESCC | 6.54e-11 | 1.47e-01 | 0.1149 |
| 997 | CDC34 | P16T-E | Human | Esophagus | ESCC | 2.71e-09 | 4.98e-02 | 0.1153 |
| 997 | CDC34 | P17T-E | Human | Esophagus | ESCC | 3.18e-06 | 2.01e-01 | 0.1278 |
| 997 | CDC34 | P20T-E | Human | Esophagus | ESCC | 5.76e-07 | 1.01e-01 | 0.1124 |
| 997 | CDC34 | P21T-E | Human | Esophagus | ESCC | 2.67e-16 | 1.84e-01 | 0.1617 |
| 997 | CDC34 | P22T-E | Human | Esophagus | ESCC | 2.04e-13 | 1.66e-01 | 0.1236 |
| 997 | CDC34 | P23T-E | Human | Esophagus | ESCC | 8.90e-22 | 5.10e-01 | 0.108 |
| 997 | CDC34 | P24T-E | Human | Esophagus | ESCC | 1.35e-09 | 2.02e-01 | 0.1287 |
| 997 | CDC34 | P26T-E | Human | Esophagus | ESCC | 1.37e-18 | 3.15e-01 | 0.1276 |
| 997 | CDC34 | P27T-E | Human | Esophagus | ESCC | 7.45e-18 | 1.51e-01 | 0.1055 |
| Page: 1 2 3 4 5 |
| Tissue | Expression Dynamics | Abbreviation |
| Esophagus | 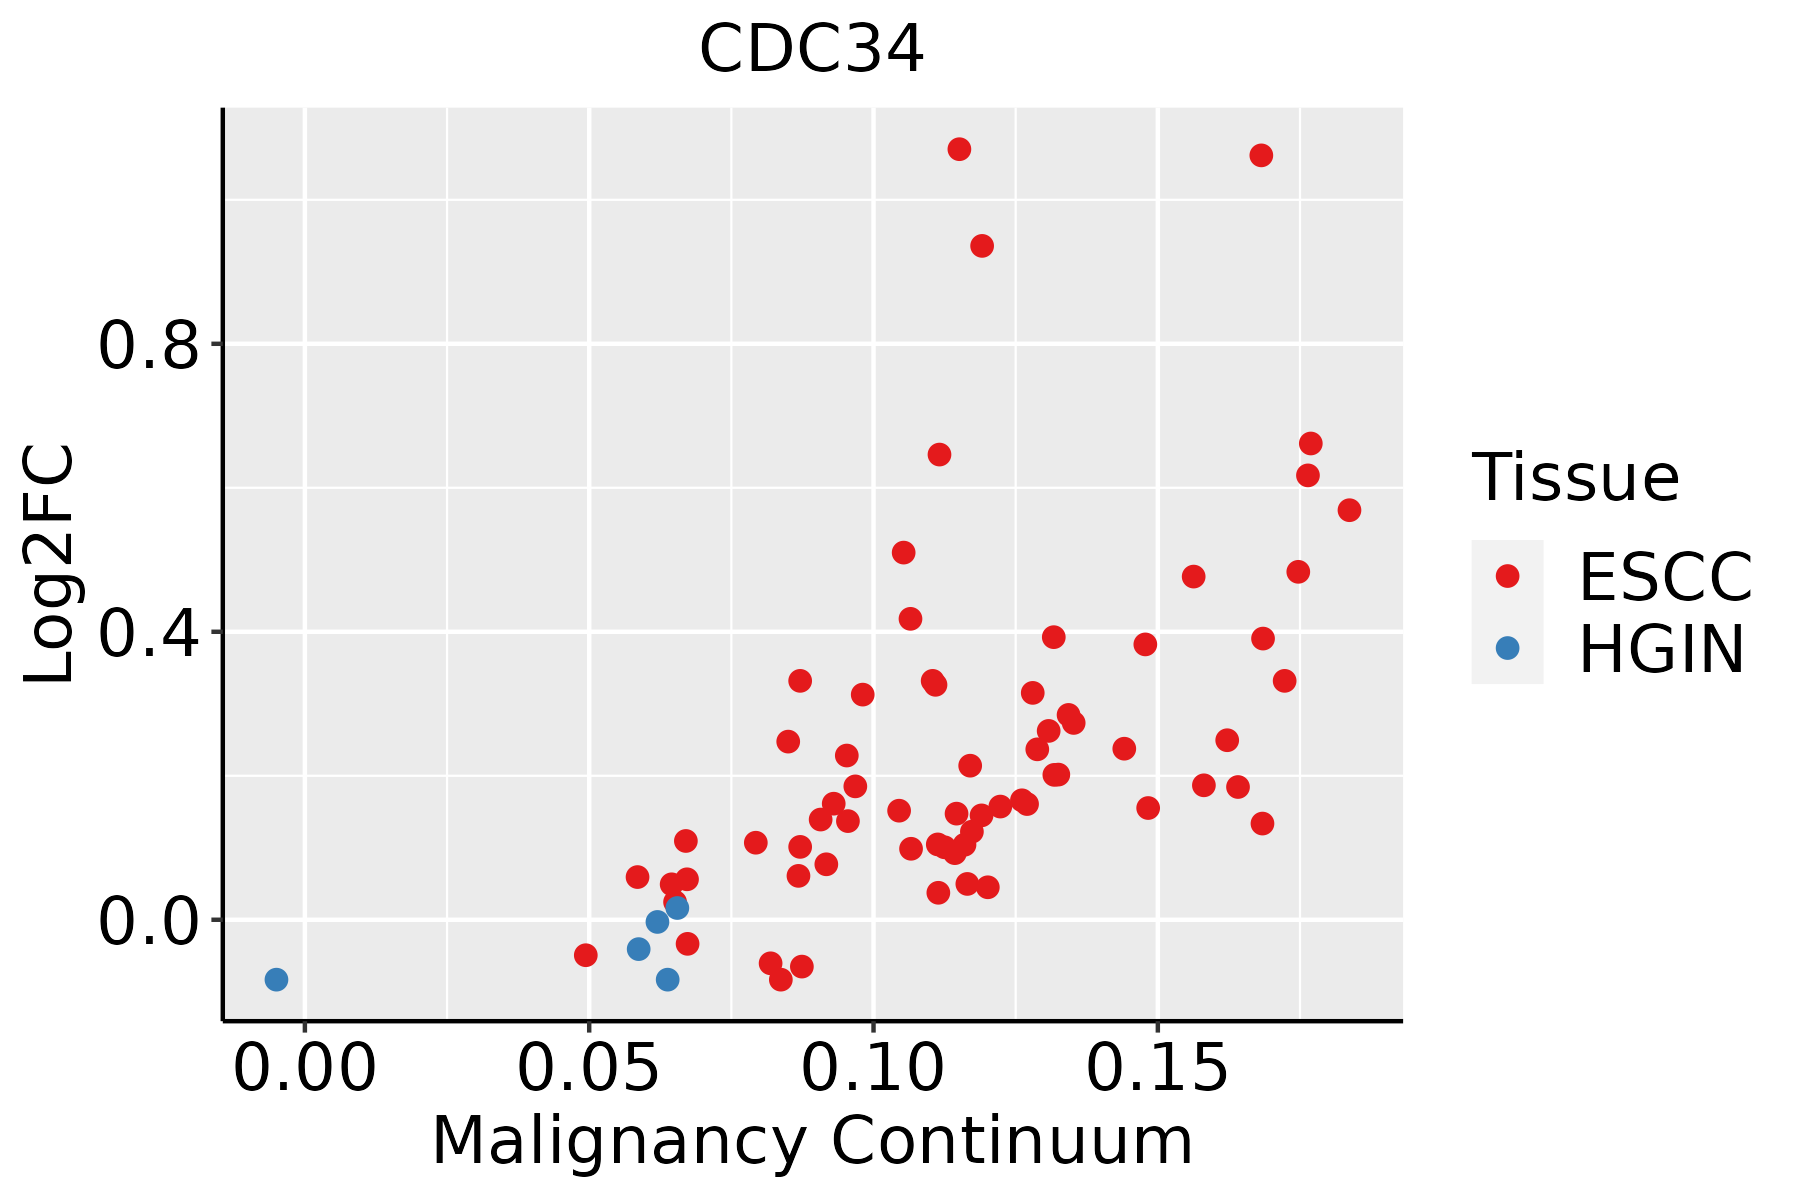 | ESCC: Esophageal squamous cell carcinoma |
| HGIN: High-grade intraepithelial neoplasias | ||
| LGIN: Low-grade intraepithelial neoplasias | ||
| Liver |  | HCC: Hepatocellular carcinoma |
| NAFLD: Non-alcoholic fatty liver disease | ||
| Oral Cavity | 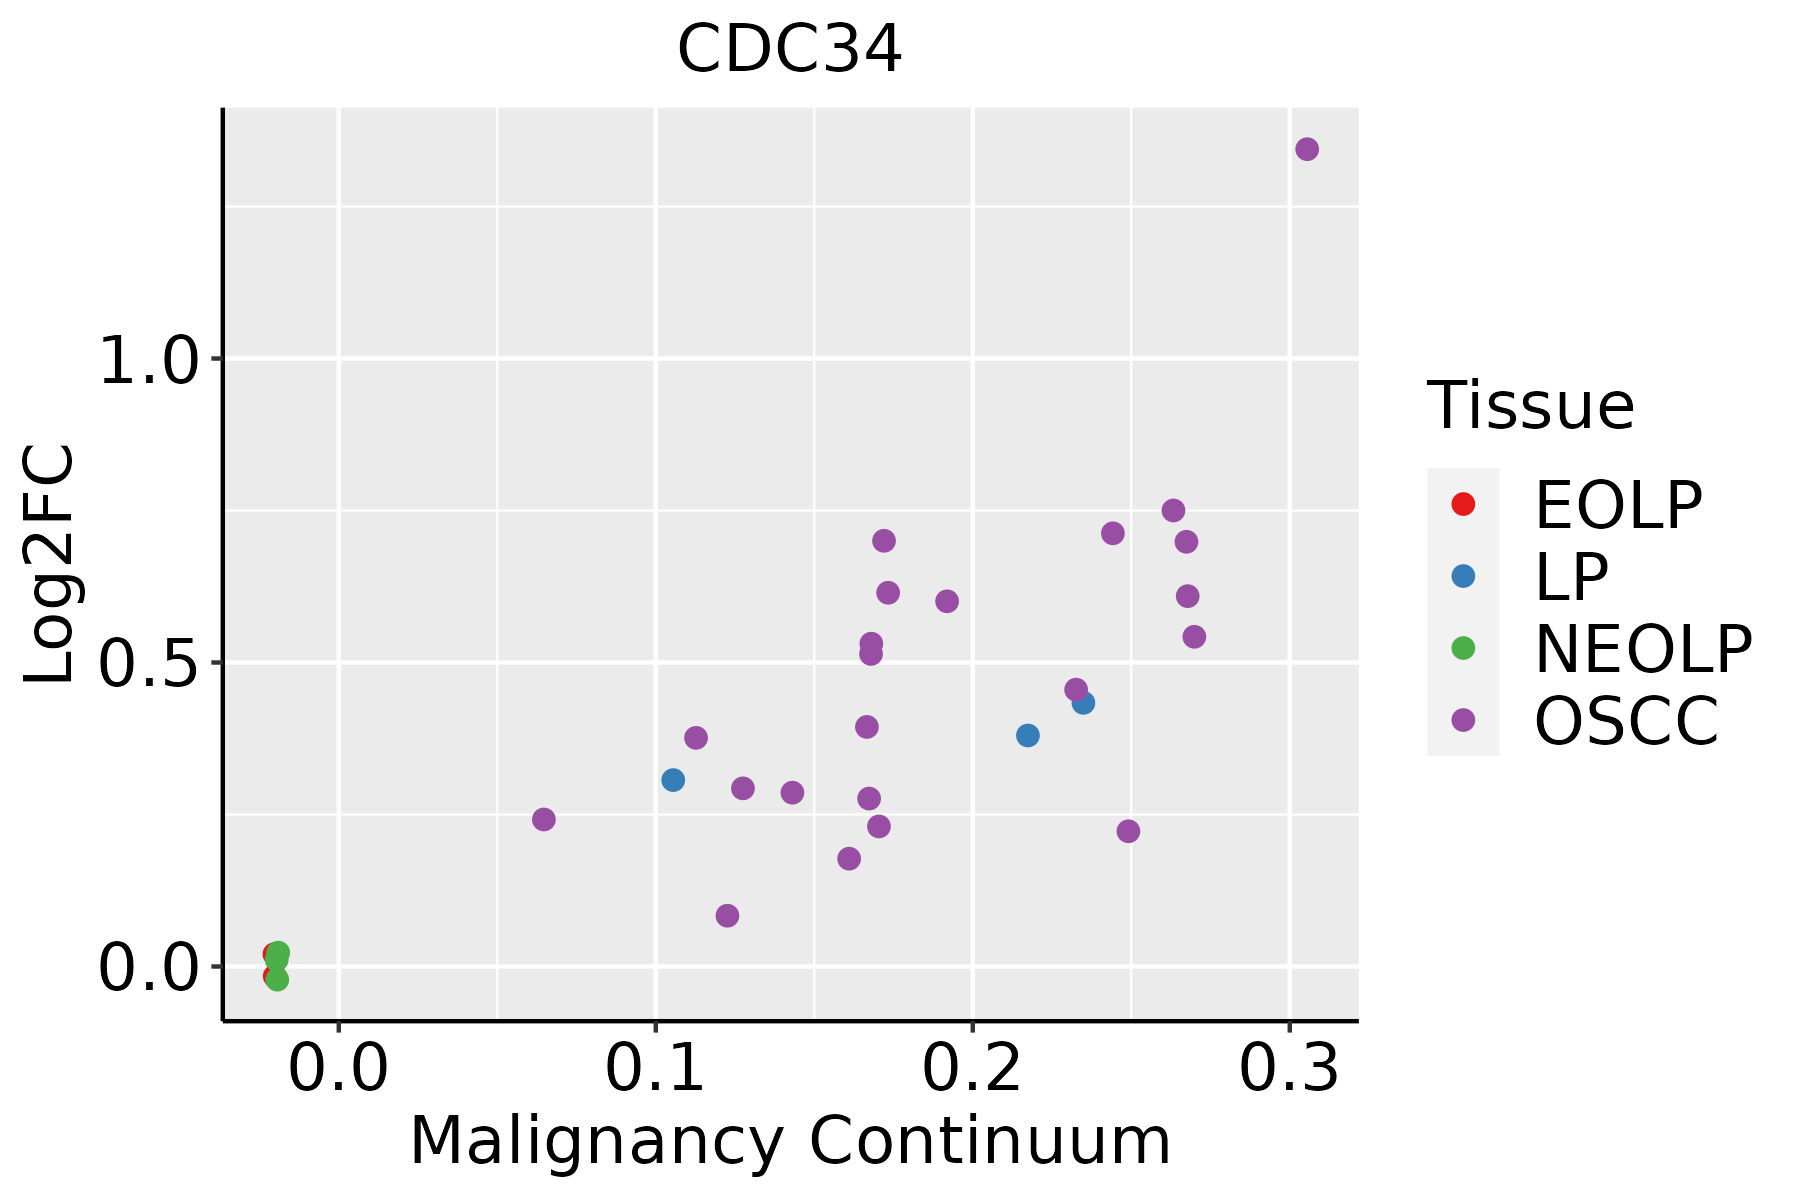 | EOLP: Erosive Oral lichen planus |
| LP: leukoplakia | ||
| NEOLP: Non-erosive oral lichen planus | ||
| OSCC: Oral squamous cell carcinoma | ||
| Thyroid | 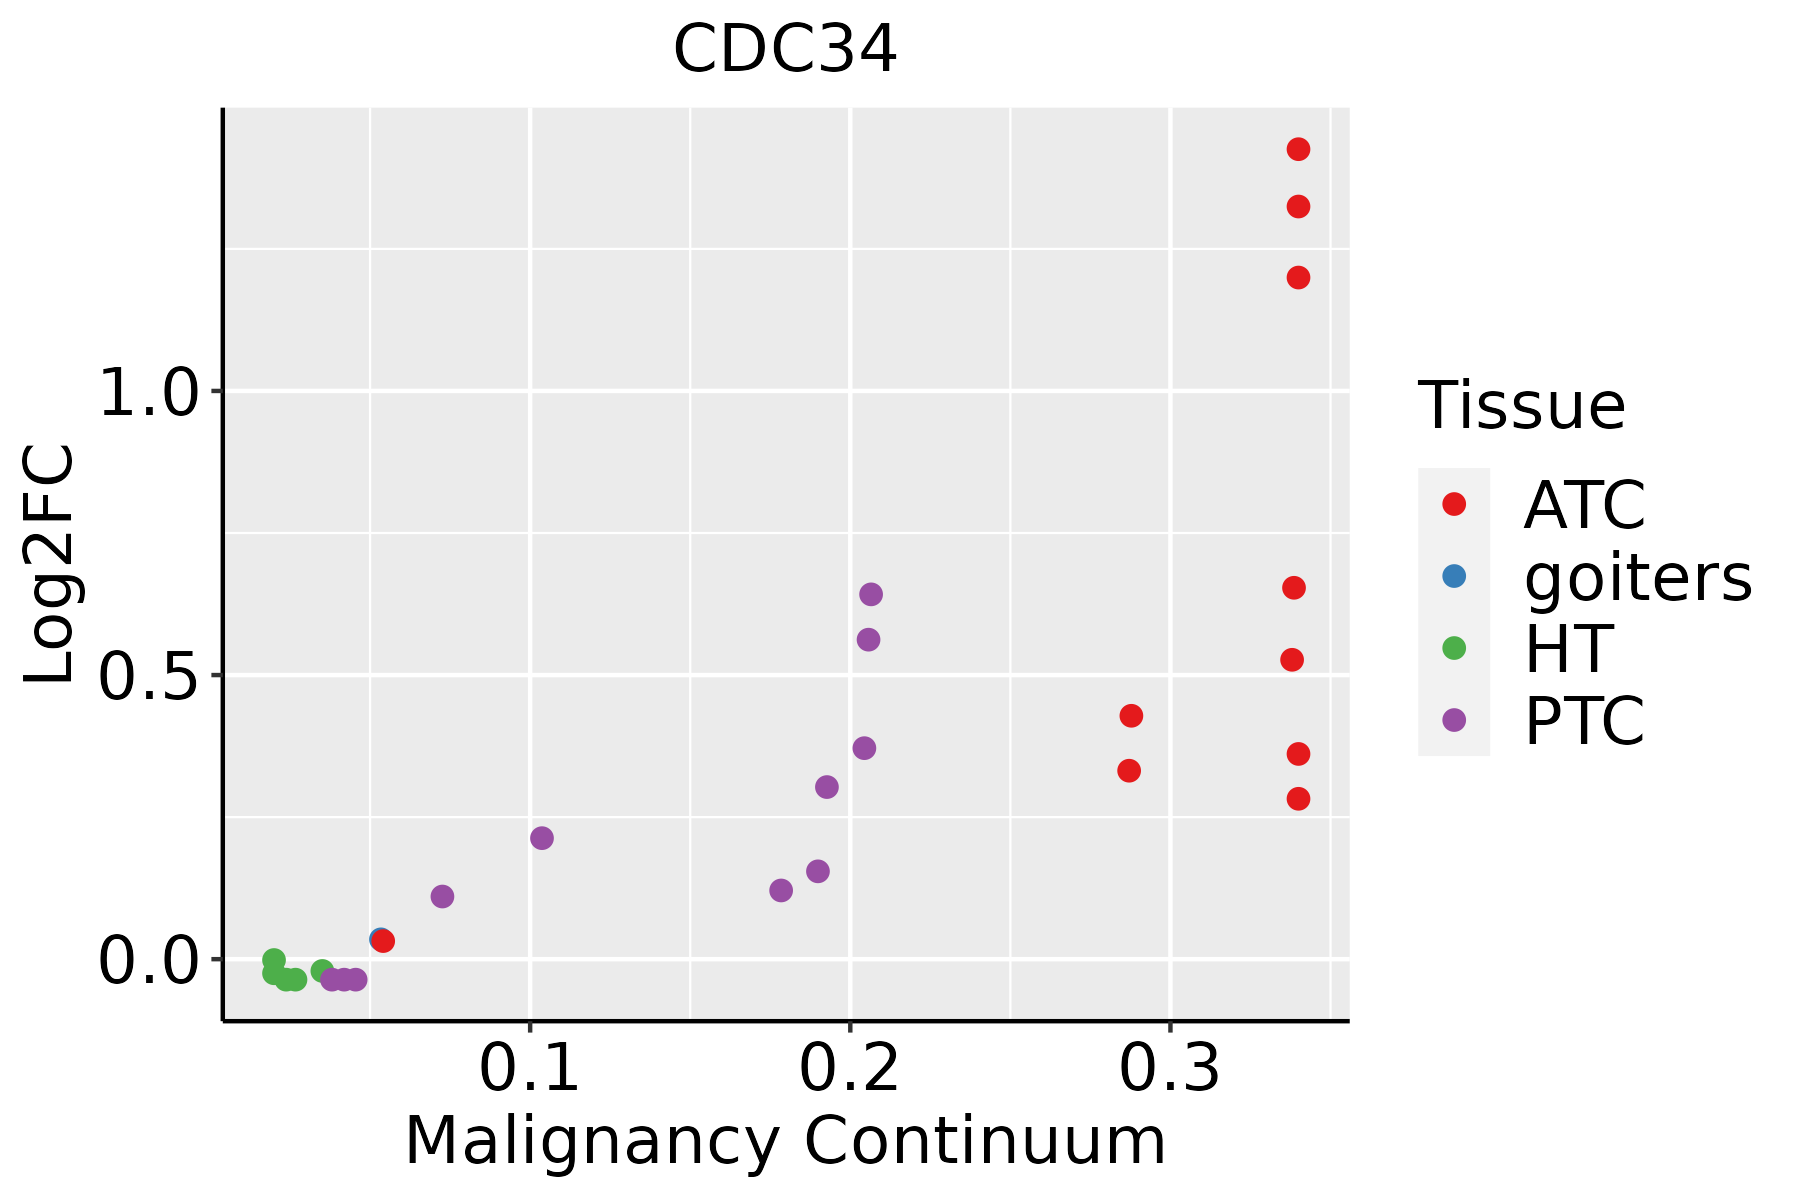 | ATC: Anaplastic thyroid cancer |
| HT: Hashimoto's thyroiditis | ||
| PTC: Papillary thyroid cancer |
| ∗log2FC in expression of this searched gene in stem-like cells from each diseased tissue sample relative to stem-like cells in normal samples in each tissue plotted against the malignancy continuum. Samples are colored based on if they are from different disease stage. |
Top |
Malignant transformation related pathway analysis |
| Find out the enriched GO biological processes and KEGG pathways involved in transition from healthy to precancer to cancer |
| Tissue | Disease Stage | Enriched GO biological Processes |
| Colorectum | AD |  |
| Colorectum | SER |  |
| Colorectum | MSS |  |
| Colorectum | MSI-H |  |
| Colorectum | FAP |  |
| ∗Top 15 enriched GO BP terms are showed in the bar plot of each disease state in each tissue. Each row represents a significant GO biological process which is colored according to the -log10(p.adjust). |
| Page: 1 2 3 4 5 6 7 8 9 |
| GO ID | Tissue | Disease Stage | Description | Gene Ratio | Bg Ratio | pvalue | p.adjust | Count |
| GO:0010498111 | Esophagus | ESCC | proteasomal protein catabolic process | 369/8552 | 490/18723 | 1.13e-41 | 1.80e-38 | 369 |
| GO:0043161111 | Esophagus | ESCC | proteasome-mediated ubiquitin-dependent protein catabolic process | 312/8552 | 412/18723 | 3.53e-36 | 4.48e-33 | 312 |
| GO:004477216 | Esophagus | ESCC | mitotic cell cycle phase transition | 281/8552 | 424/18723 | 4.63e-18 | 4.45e-16 | 281 |
| GO:000020917 | Esophagus | ESCC | protein polyubiquitination | 170/8552 | 236/18723 | 1.40e-16 | 1.09e-14 | 170 |
| GO:00062604 | Esophagus | ESCC | DNA replication | 181/8552 | 260/18723 | 3.55e-15 | 2.05e-13 | 181 |
| GO:007093617 | Esophagus | ESCC | protein K48-linked ubiquitination | 55/8552 | 65/18723 | 8.42e-11 | 2.58e-09 | 55 |
| GO:0070997111 | Esophagus | ESCC | neuron death | 216/8552 | 361/18723 | 3.49e-08 | 6.45e-07 | 216 |
| GO:00062612 | Esophagus | ESCC | DNA-dependent DNA replication | 100/8552 | 151/18723 | 2.61e-07 | 3.94e-06 | 100 |
| GO:000008214 | Esophagus | ESCC | G1/S transition of mitotic cell cycle | 134/8552 | 214/18723 | 4.04e-07 | 5.55e-06 | 134 |
| GO:004484314 | Esophagus | ESCC | cell cycle G1/S phase transition | 148/8552 | 241/18723 | 5.68e-07 | 7.48e-06 | 148 |
| GO:0051402110 | Esophagus | ESCC | neuron apoptotic process | 148/8552 | 246/18723 | 3.08e-06 | 3.47e-05 | 148 |
| GO:1901214111 | Esophagus | ESCC | regulation of neuron death | 186/8552 | 319/18723 | 3.35e-06 | 3.73e-05 | 186 |
| GO:1901216111 | Esophagus | ESCC | positive regulation of neuron death | 65/8552 | 97/18723 | 1.76e-05 | 1.56e-04 | 65 |
| GO:00062701 | Esophagus | ESCC | DNA replication initiation | 27/8552 | 34/18723 | 6.01e-05 | 4.62e-04 | 27 |
| GO:0043525110 | Esophagus | ESCC | positive regulation of neuron apoptotic process | 40/8552 | 58/18723 | 2.83e-04 | 1.71e-03 | 40 |
| GO:004352317 | Esophagus | ESCC | regulation of neuron apoptotic process | 122/8552 | 212/18723 | 3.21e-04 | 1.90e-03 | 122 |
| GO:009008317 | Esophagus | ESCC | regulation of inclusion body assembly | 14/8552 | 17/18723 | 2.22e-03 | 9.78e-03 | 14 |
| GO:007084119 | Esophagus | ESCC | inclusion body assembly | 18/8552 | 24/18723 | 3.43e-03 | 1.41e-02 | 18 |
| GO:001049822 | Liver | HCC | proteasomal protein catabolic process | 351/7958 | 490/18723 | 6.92e-40 | 1.46e-36 | 351 |
| GO:004316122 | Liver | HCC | proteasome-mediated ubiquitin-dependent protein catabolic process | 299/7958 | 412/18723 | 7.82e-36 | 8.27e-33 | 299 |
| Page: 1 2 3 4 5 |
| Pathway ID | Tissue | Disease Stage | Description | Gene Ratio | Bg Ratio | pvalue | p.adjust | qvalue | Count |
| hsa0412027 | Esophagus | ESCC | Ubiquitin mediated proteolysis | 122/4205 | 142/8465 | 6.53e-20 | 7.29e-18 | 3.74e-18 | 122 |
| hsa0412036 | Esophagus | ESCC | Ubiquitin mediated proteolysis | 122/4205 | 142/8465 | 6.53e-20 | 7.29e-18 | 3.74e-18 | 122 |
| hsa0412041 | Liver | HCC | Ubiquitin mediated proteolysis | 110/4020 | 142/8465 | 1.67e-13 | 3.74e-12 | 2.08e-12 | 110 |
| hsa0412051 | Liver | HCC | Ubiquitin mediated proteolysis | 110/4020 | 142/8465 | 1.67e-13 | 3.74e-12 | 2.08e-12 | 110 |
| hsa0412020 | Oral cavity | OSCC | Ubiquitin mediated proteolysis | 105/3704 | 142/8465 | 1.83e-13 | 4.37e-12 | 2.23e-12 | 105 |
| hsa04120110 | Oral cavity | OSCC | Ubiquitin mediated proteolysis | 105/3704 | 142/8465 | 1.83e-13 | 4.37e-12 | 2.23e-12 | 105 |
| Page: 1 |
Top |
Cell-cell communication analysis |
| Identification of potential cell-cell interactions between two cell types and their ligand-receptor pairs for different disease states |
| Ligand | Receptor | LRpair | Pathway | Tissue | Disease Stage |
| Page: 1 |
Top |
Single-cell gene regulatory network inference analysis |
| Find out the significant the regulons (TFs) and the target genes of each regulon across cell types for different disease states |
| TF | Cell Type | Tissue | Disease Stage | Target Gene | RSS | Regulon Activity |
| ∗The dot plots of a searched regulon are shown for all cell subpopulations in each disease state of each tissue based on the regulon specific score inferred using pySCENIC and by calculating the average expression. |
| Page: 1 |
Top |
Somatic mutation of malignant transformation related genes |
| Annotation of somatic variants for genes involved in malignant transformation |
| Hugo Symbol | Variant Class | Variant Classification | dbSNP RS | HGVSc | HGVSp | HGVSp Short | SWISSPROT | BIOTYPE | SIFT | PolyPhen | Tumor Sample Barcode | Tissue | Histology | Sex | Age | Stage | Therapy Types | Drugs | Outcome |
| CDC34 | SNV | Missense_Mutation | novel | c.269N>A | p.Gly90Glu | p.G90E | P49427 | protein_coding | deleterious(0) | probably_damaging(1) | TCGA-A1-A0SN-01 | Breast | breast invasive carcinoma | Female | <65 | I/II | Chemotherapy | ac | SD |
| CDC34 | SNV | Missense_Mutation | rs148639611 | c.103N>A | p.Glu35Lys | p.E35K | P49427 | protein_coding | deleterious(0.01) | probably_damaging(0.934) | TCGA-D8-A27G-01 | Breast | breast invasive carcinoma | Female | >=65 | I/II | Unknown | Unknown | SD |
| CDC34 | SNV | Missense_Mutation | c.299N>A | p.Pro100Gln | p.P100Q | P49427 | protein_coding | deleterious(0) | probably_damaging(0.998) | TCGA-AA-3815-01 | Colorectum | colon adenocarcinoma | Female | >=65 | I/II | Unknown | Unknown | SD | |
| CDC34 | SNV | Missense_Mutation | c.179C>T | p.Ala60Val | p.A60V | P49427 | protein_coding | deleterious(0.04) | benign(0.191) | TCGA-AD-6895-01 | Colorectum | colon adenocarcinoma | Male | >=65 | III/IV | Unknown | Unknown | SD | |
| CDC34 | SNV | Missense_Mutation | rs774925566 | c.574N>A | p.Val192Met | p.V192M | P49427 | protein_coding | tolerated(0.05) | possibly_damaging(0.65) | TCGA-CK-4951-01 | Colorectum | colon adenocarcinoma | Female | >=65 | I/II | Unknown | Unknown | PD |
| CDC34 | SNV | Missense_Mutation | c.319N>A | p.Gly107Arg | p.G107R | P49427 | protein_coding | deleterious(0) | probably_damaging(0.999) | TCGA-NH-A5IV-01 | Colorectum | colon adenocarcinoma | Female | >=65 | I/II | Unknown | Unknown | SD | |
| CDC34 | SNV | Missense_Mutation | novel | c.240G>T | p.Lys80Asn | p.K80N | P49427 | protein_coding | deleterious(0.01) | possibly_damaging(0.573) | TCGA-A5-A0G2-01 | Endometrium | uterine corpus endometrioid carcinoma | Female | <65 | III/IV | Unknown | Unknown | SD |
| CDC34 | SNV | Missense_Mutation | novel | c.475N>T | p.Arg159Trp | p.R159W | P49427 | protein_coding | deleterious(0) | possibly_damaging(0.884) | TCGA-AP-A059-01 | Endometrium | uterine corpus endometrioid carcinoma | Female | >=65 | I/II | Unknown | Unknown | SD |
| CDC34 | SNV | Missense_Mutation | c.146C>T | p.Pro49Leu | p.P49L | P49427 | protein_coding | deleterious(0) | probably_damaging(0.97) | TCGA-AX-A1CE-01 | Endometrium | uterine corpus endometrioid carcinoma | Female | <65 | I/II | Unspecific | Paclitaxel | SD | |
| CDC34 | SNV | Missense_Mutation | novel | c.370N>T | p.Leu124Phe | p.L124F | P49427 | protein_coding | deleterious(0.03) | possibly_damaging(0.861) | TCGA-AX-A2HC-01 | Endometrium | uterine corpus endometrioid carcinoma | Female | <65 | III/IV | Chemotherapy | paclitaxel | PD |
| Page: 1 2 3 |
Top |
Related drugs of malignant transformation related genes |
| Identification of chemicals and drugs interact with genes involved in malignant transfromation |
| (DGIdb 4.0) |
| Entrez ID | Symbol | Category | Interaction Types | Drug Claim Name | Drug Name | PMIDs |
| Page: 1 |

Copyright 2023-Present -The University of Texas Health Science Center at Houston |