
|
|||||
|
 | |
| |
| |
| |
| |
| |
|
Gene: CDC26 |
Gene summary for CDC26 |
| Gene information | Species | Human | Gene symbol | CDC26 | Gene ID | 246184 |
| Gene name | cell division cycle 26 | |
| Gene Alias | ANAPC12 | |
| Cytomap | 9q32 | |
| Gene Type | protein-coding | GO ID | GO:0000070 | UniProtAcc | A0A024R832 |
Top |
Malignant transformation analysis |
| Identification of the aberrant gene expression in precancerous and cancerous lesions by comparing the gene expression of stem-like cells in diseased tissues with normal stem cells |
| Entrez ID | Symbol | Replicates | Species | Organ | Tissue | Adj P-value | Log2FC | Malignancy |
| 246184 | CDC26 | LZE4T | Human | Esophagus | ESCC | 8.72e-20 | 6.20e-01 | 0.0811 |
| 246184 | CDC26 | LZE5T | Human | Esophagus | ESCC | 1.29e-08 | 6.99e-01 | 0.0514 |
| 246184 | CDC26 | LZE7T | Human | Esophagus | ESCC | 9.75e-08 | 5.03e-01 | 0.0667 |
| 246184 | CDC26 | LZE8T | Human | Esophagus | ESCC | 2.36e-22 | 6.58e-01 | 0.067 |
| 246184 | CDC26 | LZE20T | Human | Esophagus | ESCC | 5.42e-14 | 5.00e-01 | 0.0662 |
| 246184 | CDC26 | LZE22D1 | Human | Esophagus | HGIN | 1.23e-06 | 3.76e-01 | 0.0595 |
| 246184 | CDC26 | LZE22T | Human | Esophagus | ESCC | 4.89e-08 | 4.97e-01 | 0.068 |
| 246184 | CDC26 | LZE24D1 | Human | Esophagus | HGIN | 5.94e-03 | 6.61e-01 | 0.054 |
| 246184 | CDC26 | LZE24T | Human | Esophagus | ESCC | 8.05e-33 | 8.72e-01 | 0.0596 |
| 246184 | CDC26 | LZE21T | Human | Esophagus | ESCC | 4.48e-08 | 6.04e-01 | 0.0655 |
| 246184 | CDC26 | LZE6T | Human | Esophagus | ESCC | 4.25e-21 | 9.08e-01 | 0.0845 |
| 246184 | CDC26 | P1T-E | Human | Esophagus | ESCC | 6.11e-16 | 6.39e-01 | 0.0875 |
| 246184 | CDC26 | P2T-E | Human | Esophagus | ESCC | 5.84e-59 | 1.05e+00 | 0.1177 |
| 246184 | CDC26 | P4T-E | Human | Esophagus | ESCC | 5.59e-60 | 1.30e+00 | 0.1323 |
| 246184 | CDC26 | P5T-E | Human | Esophagus | ESCC | 1.06e-37 | 6.86e-01 | 0.1327 |
| 246184 | CDC26 | P8T-E | Human | Esophagus | ESCC | 1.73e-57 | 8.80e-01 | 0.0889 |
| 246184 | CDC26 | P9T-E | Human | Esophagus | ESCC | 6.18e-37 | 7.74e-01 | 0.1131 |
| 246184 | CDC26 | P10T-E | Human | Esophagus | ESCC | 9.86e-72 | 1.18e+00 | 0.116 |
| 246184 | CDC26 | P11T-E | Human | Esophagus | ESCC | 1.21e-32 | 1.13e+00 | 0.1426 |
| 246184 | CDC26 | P12T-E | Human | Esophagus | ESCC | 1.68e-56 | 8.86e-01 | 0.1122 |
| Page: 1 2 3 4 5 6 7 |
| Tissue | Expression Dynamics | Abbreviation |
| Esophagus |  | ESCC: Esophageal squamous cell carcinoma |
| HGIN: High-grade intraepithelial neoplasias | ||
| LGIN: Low-grade intraepithelial neoplasias | ||
| Liver | 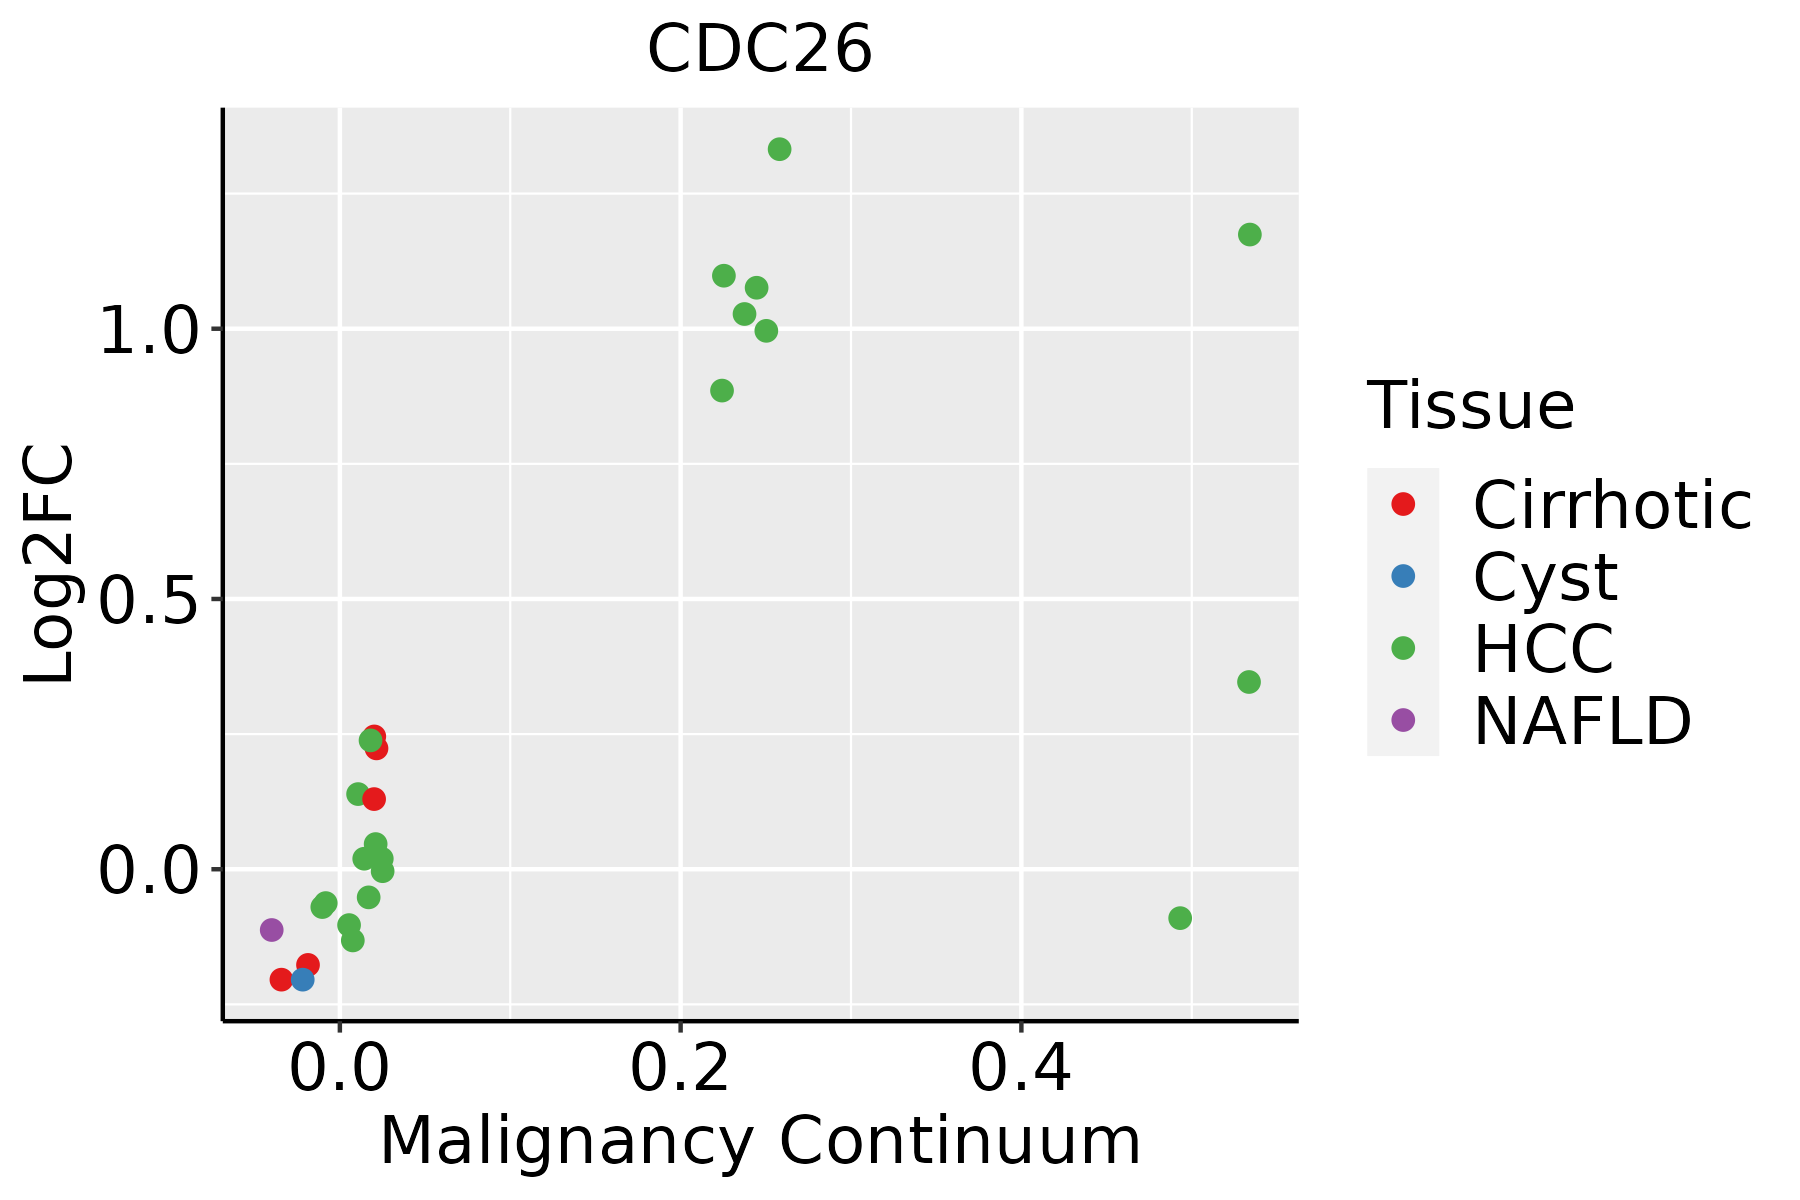 | HCC: Hepatocellular carcinoma |
| NAFLD: Non-alcoholic fatty liver disease | ||
| Oral Cavity | 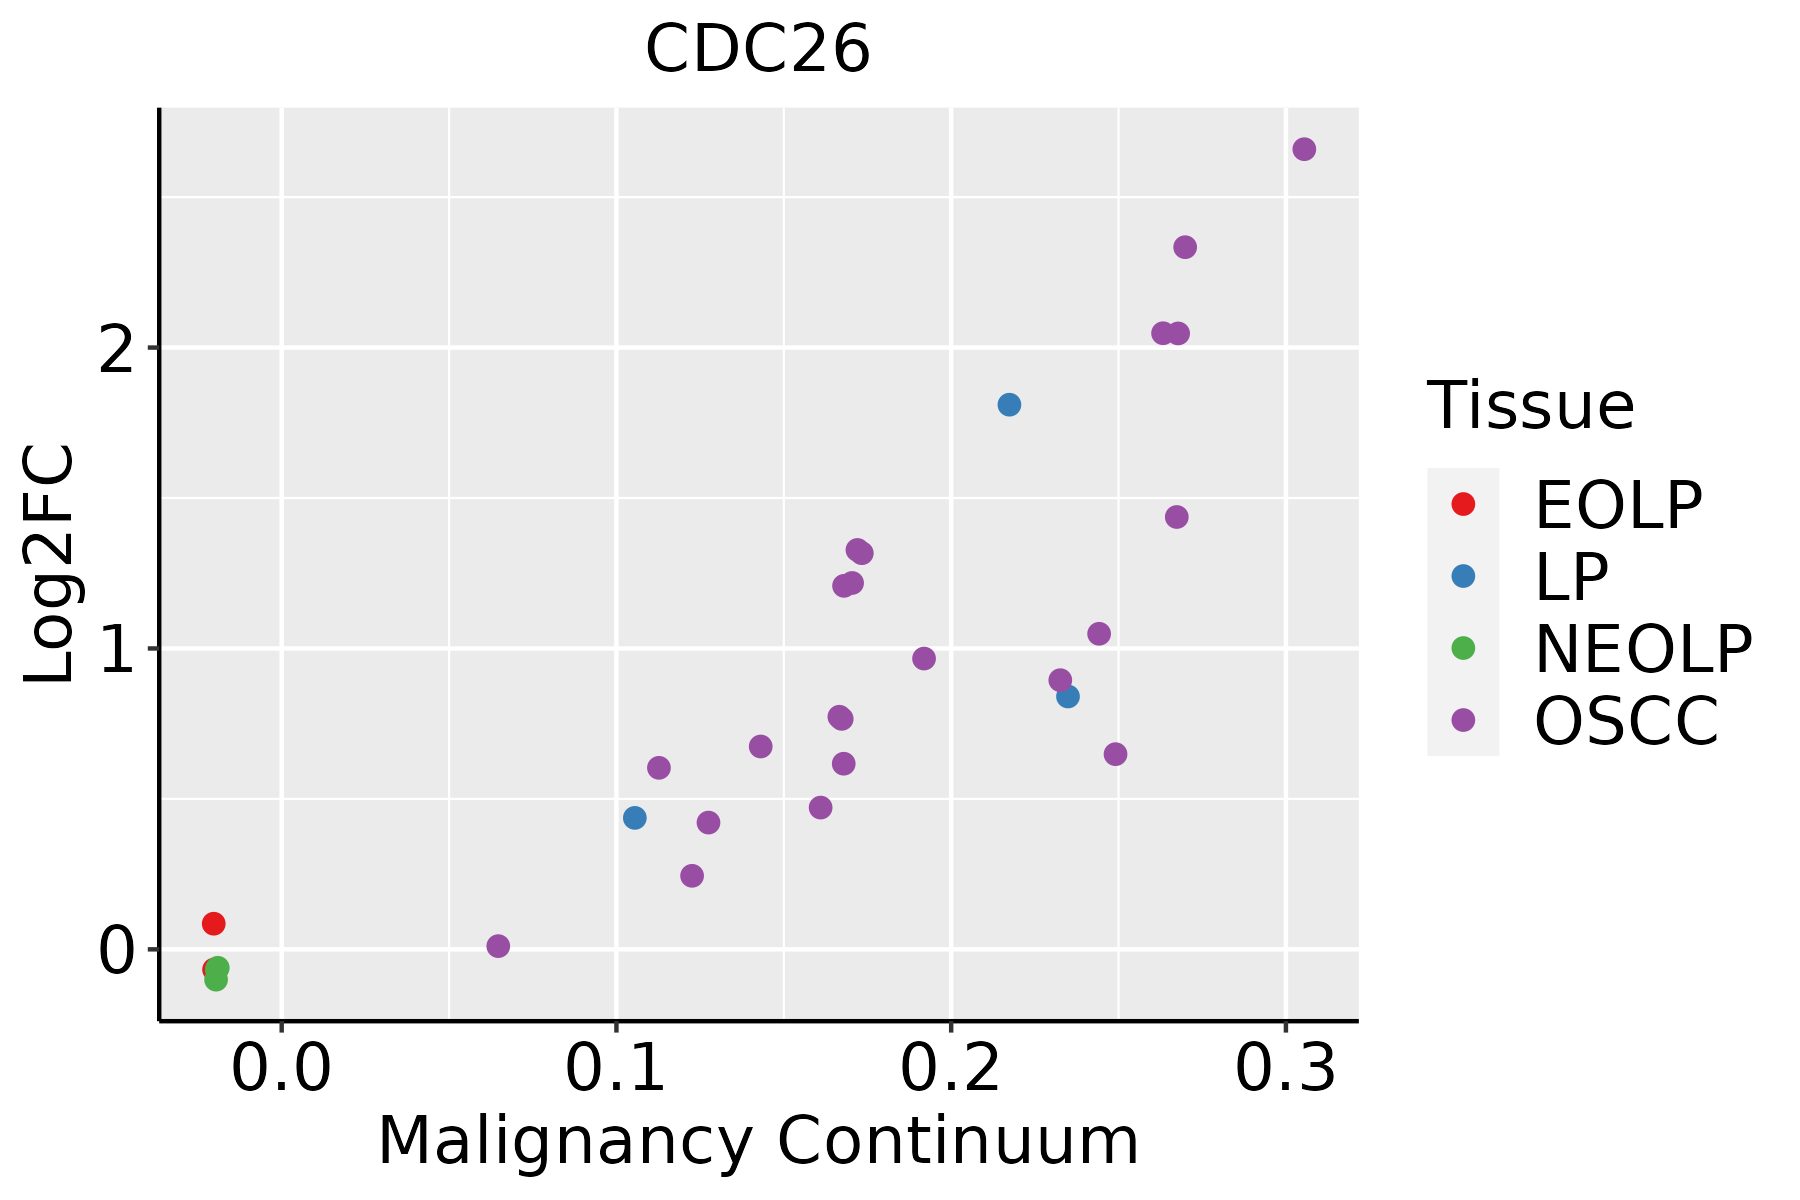 | EOLP: Erosive Oral lichen planus |
| LP: leukoplakia | ||
| NEOLP: Non-erosive oral lichen planus | ||
| OSCC: Oral squamous cell carcinoma | ||
| Skin | 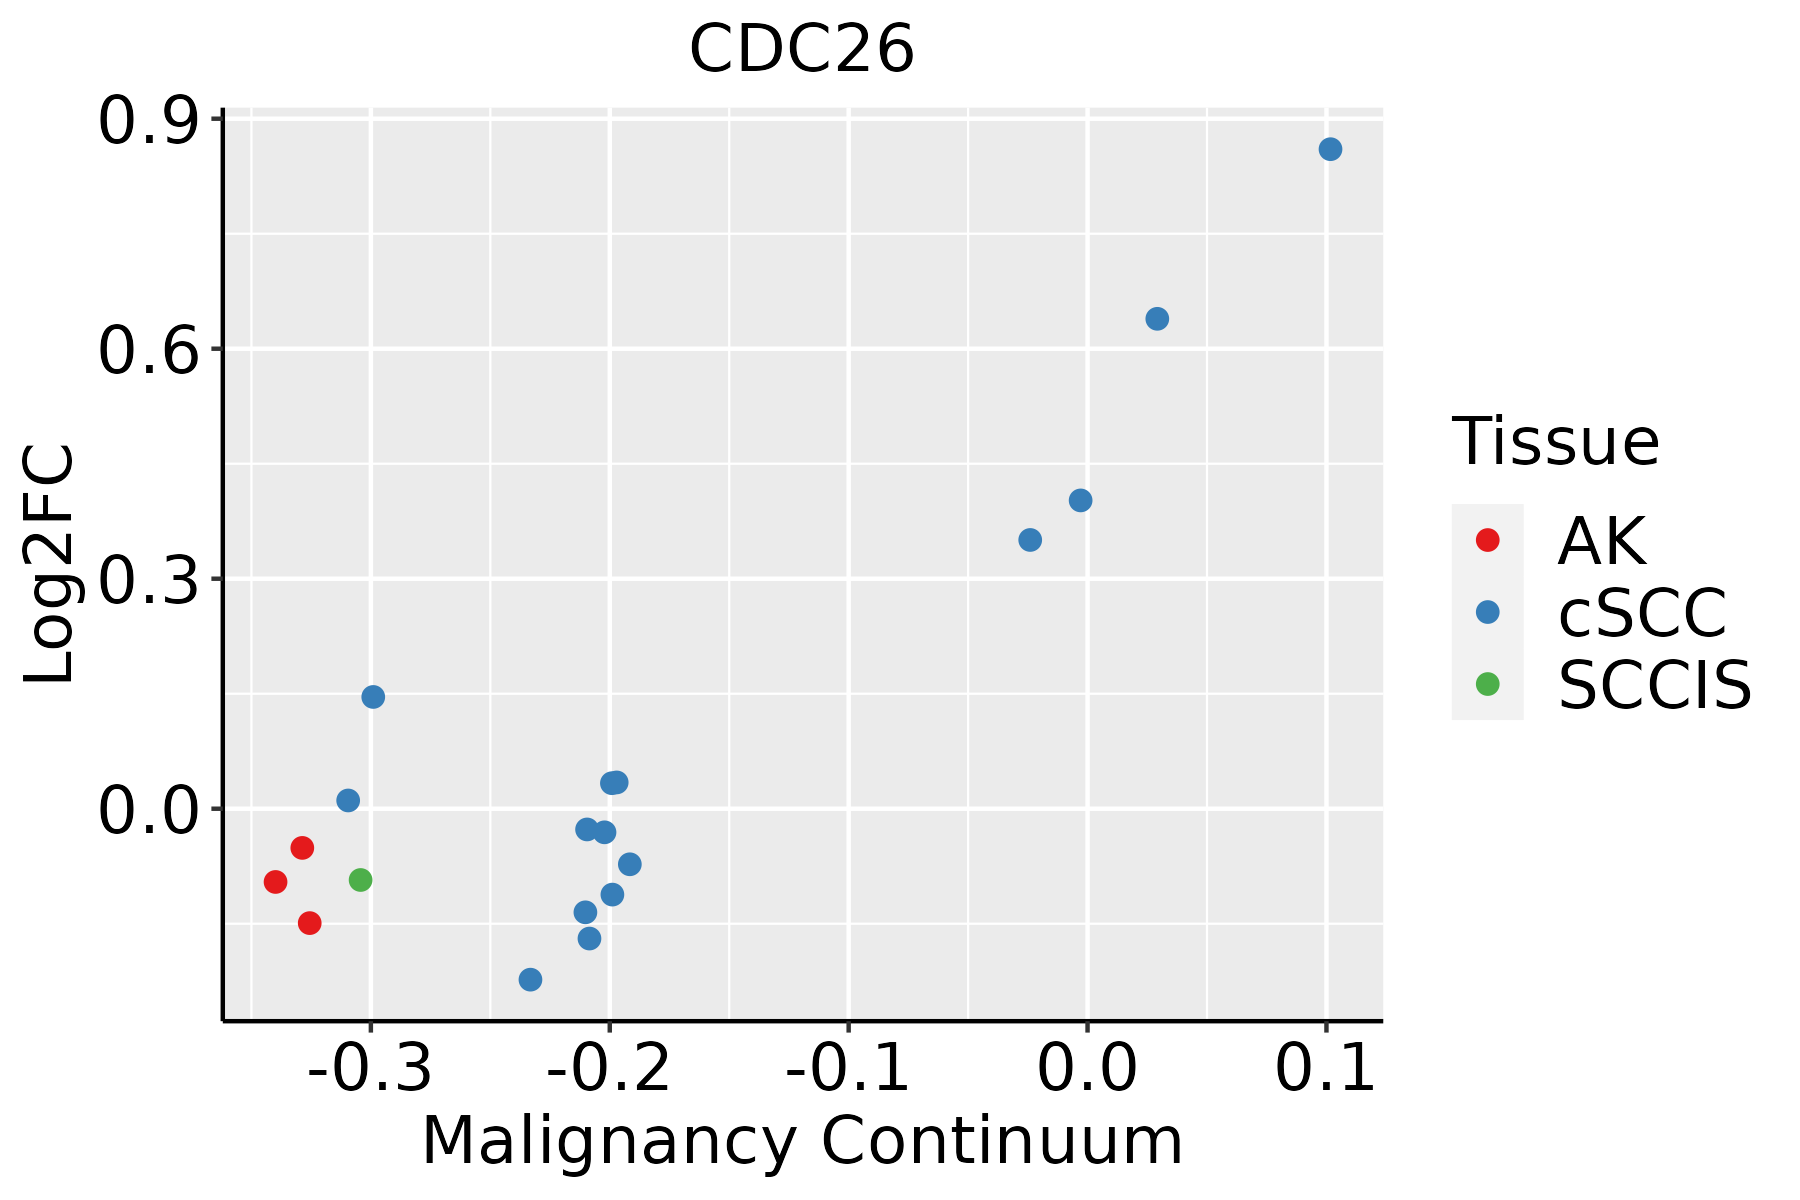 | AK: Actinic keratosis |
| cSCC: Cutaneous squamous cell carcinoma | ||
| SCCIS:squamous cell carcinoma in situ | ||
| Thyroid | 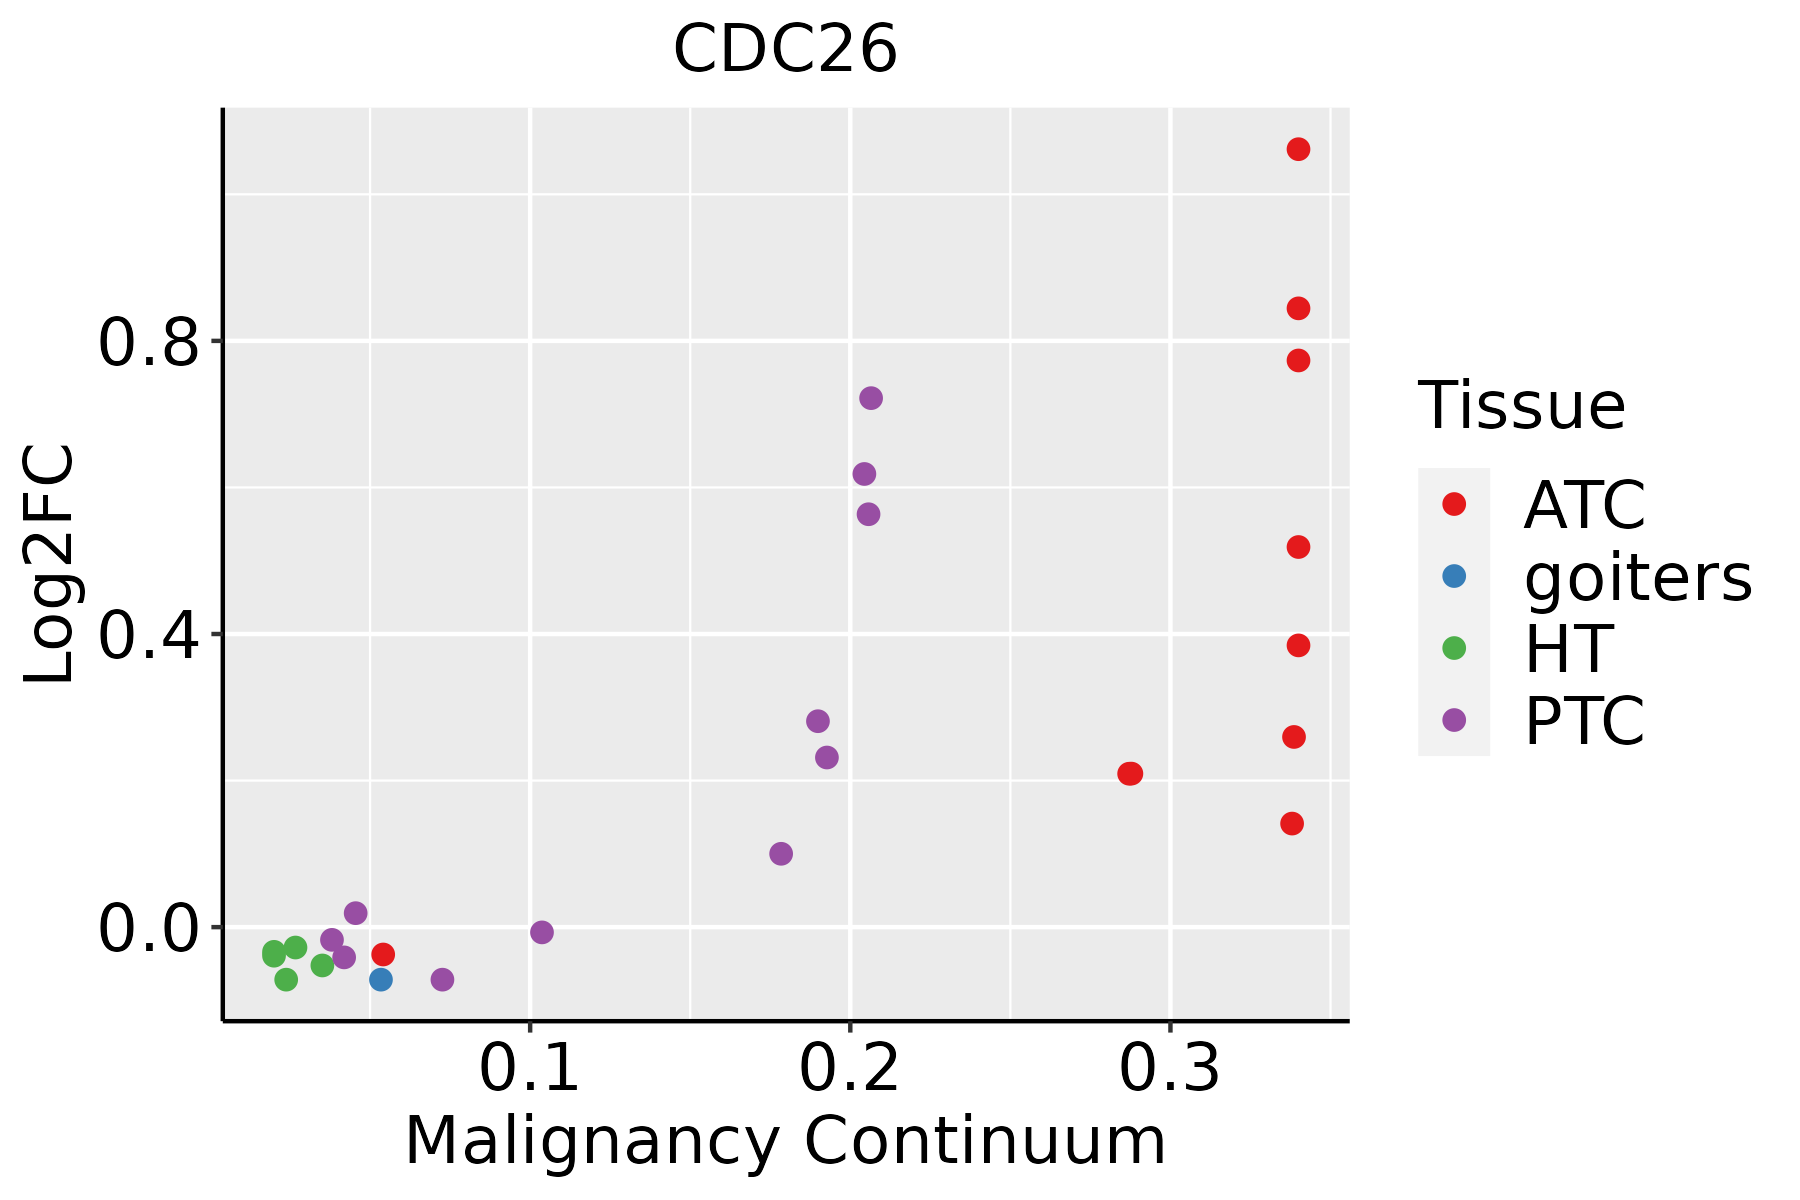 | ATC: Anaplastic thyroid cancer |
| HT: Hashimoto's thyroiditis | ||
| PTC: Papillary thyroid cancer |
| ∗log2FC in expression of this searched gene in stem-like cells from each diseased tissue sample relative to stem-like cells in normal samples in each tissue plotted against the malignancy continuum. Samples are colored based on if they are from different disease stage. |
Top |
Malignant transformation related pathway analysis |
| Find out the enriched GO biological processes and KEGG pathways involved in transition from healthy to precancer to cancer |
| Tissue | Disease Stage | Enriched GO biological Processes |
| Colorectum | AD |  |
| Colorectum | SER |  |
| Colorectum | MSS |  |
| Colorectum | MSI-H |  |
| Colorectum | FAP |  |
| ∗Top 15 enriched GO BP terms are showed in the bar plot of each disease state in each tissue. Each row represents a significant GO biological process which is colored according to the -log10(p.adjust). |
| Page: 1 2 3 4 5 6 7 8 9 |
| GO ID | Tissue | Disease Stage | Description | Gene Ratio | Bg Ratio | pvalue | p.adjust | Count |
| GO:001049826 | Esophagus | HGIN | proteasomal protein catabolic process | 139/2587 | 490/18723 | 1.20e-17 | 3.41e-15 | 139 |
| GO:004316126 | Esophagus | HGIN | proteasome-mediated ubiquitin-dependent protein catabolic process | 114/2587 | 412/18723 | 7.00e-14 | 1.20e-11 | 114 |
| GO:00330449 | Esophagus | HGIN | regulation of chromosome organization | 51/2587 | 187/18723 | 8.91e-07 | 3.61e-05 | 51 |
| GO:000734610 | Esophagus | HGIN | regulation of mitotic cell cycle | 98/2587 | 457/18723 | 4.39e-06 | 1.42e-04 | 98 |
| GO:000020916 | Esophagus | HGIN | protein polyubiquitination | 58/2587 | 236/18723 | 6.29e-06 | 1.97e-04 | 58 |
| GO:00447729 | Esophagus | HGIN | mitotic cell cycle phase transition | 89/2587 | 424/18723 | 2.80e-05 | 7.21e-04 | 89 |
| GO:19019906 | Esophagus | HGIN | regulation of mitotic cell cycle phase transition | 65/2587 | 299/18723 | 1.12e-04 | 2.36e-03 | 65 |
| GO:01400146 | Esophagus | HGIN | mitotic nuclear division | 61/2587 | 287/18723 | 3.38e-04 | 5.55e-03 | 61 |
| GO:00070593 | Esophagus | HGIN | chromosome segregation | 71/2587 | 346/18723 | 3.47e-04 | 5.62e-03 | 71 |
| GO:00709794 | Esophagus | HGIN | protein K11-linked ubiquitination | 11/2587 | 29/18723 | 1.08e-03 | 1.32e-02 | 11 |
| GO:00000703 | Esophagus | HGIN | mitotic sister chromatid segregation | 36/2587 | 168/18723 | 4.42e-03 | 3.87e-02 | 36 |
| GO:19019876 | Esophagus | HGIN | regulation of cell cycle phase transition | 72/2587 | 390/18723 | 5.78e-03 | 4.70e-02 | 72 |
| GO:0010498111 | Esophagus | ESCC | proteasomal protein catabolic process | 369/8552 | 490/18723 | 1.13e-41 | 1.80e-38 | 369 |
| GO:0043161111 | Esophagus | ESCC | proteasome-mediated ubiquitin-dependent protein catabolic process | 312/8552 | 412/18723 | 3.53e-36 | 4.48e-33 | 312 |
| GO:014001414 | Esophagus | ESCC | mitotic nuclear division | 218/8552 | 287/18723 | 6.17e-26 | 1.78e-23 | 218 |
| GO:000007011 | Esophagus | ESCC | mitotic sister chromatid segregation | 138/8552 | 168/18723 | 1.37e-22 | 2.63e-20 | 138 |
| GO:00008194 | Esophagus | ESCC | sister chromatid segregation | 157/8552 | 202/18723 | 8.41e-21 | 1.33e-18 | 157 |
| GO:003304416 | Esophagus | ESCC | regulation of chromosome organization | 145/8552 | 187/18723 | 3.80e-19 | 4.31e-17 | 145 |
| GO:000705911 | Esophagus | ESCC | chromosome segregation | 238/8552 | 346/18723 | 1.72e-18 | 1.82e-16 | 238 |
| GO:004477216 | Esophagus | ESCC | mitotic cell cycle phase transition | 281/8552 | 424/18723 | 4.63e-18 | 4.45e-16 | 281 |
| Page: 1 2 3 4 5 6 7 8 9 10 |
| Pathway ID | Tissue | Disease Stage | Description | Gene Ratio | Bg Ratio | pvalue | p.adjust | qvalue | Count |
| hsa0412026 | Esophagus | HGIN | Ubiquitin mediated proteolysis | 49/1383 | 142/8465 | 7.78e-08 | 1.33e-06 | 1.06e-06 | 49 |
| hsa0516639 | Esophagus | HGIN | Human T-cell leukemia virus 1 infection | 51/1383 | 222/8465 | 5.84e-03 | 4.05e-02 | 3.22e-02 | 51 |
| hsa041109 | Esophagus | HGIN | Cell cycle | 38/1383 | 157/8465 | 6.70e-03 | 4.37e-02 | 3.47e-02 | 38 |
| hsa04120111 | Esophagus | HGIN | Ubiquitin mediated proteolysis | 49/1383 | 142/8465 | 7.78e-08 | 1.33e-06 | 1.06e-06 | 49 |
| hsa05166114 | Esophagus | HGIN | Human T-cell leukemia virus 1 infection | 51/1383 | 222/8465 | 5.84e-03 | 4.05e-02 | 3.22e-02 | 51 |
| hsa0411016 | Esophagus | HGIN | Cell cycle | 38/1383 | 157/8465 | 6.70e-03 | 4.37e-02 | 3.47e-02 | 38 |
| hsa0412027 | Esophagus | ESCC | Ubiquitin mediated proteolysis | 122/4205 | 142/8465 | 6.53e-20 | 7.29e-18 | 3.74e-18 | 122 |
| hsa0411023 | Esophagus | ESCC | Cell cycle | 126/4205 | 157/8465 | 1.34e-15 | 5.60e-14 | 2.87e-14 | 126 |
| hsa05166211 | Esophagus | ESCC | Human T-cell leukemia virus 1 infection | 164/4205 | 222/8465 | 8.13e-14 | 2.09e-12 | 1.07e-12 | 164 |
| hsa041146 | Esophagus | ESCC | Oocyte meiosis | 77/4205 | 131/8465 | 2.19e-02 | 4.80e-02 | 2.46e-02 | 77 |
| hsa0412036 | Esophagus | ESCC | Ubiquitin mediated proteolysis | 122/4205 | 142/8465 | 6.53e-20 | 7.29e-18 | 3.74e-18 | 122 |
| hsa0411033 | Esophagus | ESCC | Cell cycle | 126/4205 | 157/8465 | 1.34e-15 | 5.60e-14 | 2.87e-14 | 126 |
| hsa05166310 | Esophagus | ESCC | Human T-cell leukemia virus 1 infection | 164/4205 | 222/8465 | 8.13e-14 | 2.09e-12 | 1.07e-12 | 164 |
| hsa0411411 | Esophagus | ESCC | Oocyte meiosis | 77/4205 | 131/8465 | 2.19e-02 | 4.80e-02 | 2.46e-02 | 77 |
| hsa0412021 | Liver | Cirrhotic | Ubiquitin mediated proteolysis | 72/2530 | 142/8465 | 1.32e-07 | 1.97e-06 | 1.21e-06 | 72 |
| hsa0516614 | Liver | Cirrhotic | Human T-cell leukemia virus 1 infection | 87/2530 | 222/8465 | 1.69e-03 | 8.01e-03 | 4.94e-03 | 87 |
| hsa041104 | Liver | Cirrhotic | Cell cycle | 61/2530 | 157/8465 | 9.53e-03 | 3.21e-02 | 1.98e-02 | 61 |
| hsa0412031 | Liver | Cirrhotic | Ubiquitin mediated proteolysis | 72/2530 | 142/8465 | 1.32e-07 | 1.97e-06 | 1.21e-06 | 72 |
| hsa0516615 | Liver | Cirrhotic | Human T-cell leukemia virus 1 infection | 87/2530 | 222/8465 | 1.69e-03 | 8.01e-03 | 4.94e-03 | 87 |
| hsa0411011 | Liver | Cirrhotic | Cell cycle | 61/2530 | 157/8465 | 9.53e-03 | 3.21e-02 | 1.98e-02 | 61 |
| Page: 1 2 |
Top |
Cell-cell communication analysis |
| Identification of potential cell-cell interactions between two cell types and their ligand-receptor pairs for different disease states |
| Ligand | Receptor | LRpair | Pathway | Tissue | Disease Stage |
| Page: 1 |
Top |
Single-cell gene regulatory network inference analysis |
| Find out the significant the regulons (TFs) and the target genes of each regulon across cell types for different disease states |
| TF | Cell Type | Tissue | Disease Stage | Target Gene | RSS | Regulon Activity |
| ∗The dot plots of a searched regulon are shown for all cell subpopulations in each disease state of each tissue based on the regulon specific score inferred using pySCENIC and by calculating the average expression. |
| Page: 1 |
Top |
Somatic mutation of malignant transformation related genes |
| Annotation of somatic variants for genes involved in malignant transformation |
| Hugo Symbol | Variant Class | Variant Classification | dbSNP RS | HGVSc | HGVSp | HGVSp Short | SWISSPROT | BIOTYPE | SIFT | PolyPhen | Tumor Sample Barcode | Tissue | Histology | Sex | Age | Stage | Therapy Types | Drugs | Outcome |
| CDC26 | SNV | Missense_Mutation | novel | c.224A>C | p.Asn75Thr | p.N75T | Q8NHZ8 | protein_coding | tolerated(1) | benign(0) | TCGA-CA-6717-01 | Colorectum | colon adenocarcinoma | Male | <65 | I/II | Chemotherapy | oxaliplatin | CR |
| CDC26 | SNV | Missense_Mutation | rs764264213 | c.68N>A | p.Arg23Gln | p.R23Q | Q8NHZ8 | protein_coding | tolerated(0.09) | benign(0.197) | TCGA-F5-6814-01 | Colorectum | rectum adenocarcinoma | Male | <65 | I/II | Unknown | Unknown | SD |
| CDC26 | SNV | Missense_Mutation | novel | c.187N>A | p.Asp63Asn | p.D63N | Q8NHZ8 | protein_coding | tolerated(0.07) | benign(0.238) | TCGA-AP-A1E1-01 | Endometrium | uterine corpus endometrioid carcinoma | Female | >=65 | I/II | Unknown | Unknown | SD |
| CDC26 | SNV | Missense_Mutation | rs780745708 | c.23N>A | p.Arg8His | p.R8H | Q8NHZ8 | protein_coding | deleterious(0.01) | probably_damaging(0.995) | TCGA-DF-A2KU-01 | Endometrium | uterine corpus endometrioid carcinoma | Female | Unknown | I/II | Unknown | Unknown | SD |
| CDC26 | SNV | Missense_Mutation | novel | c.111N>C | p.Glu37Asp | p.E37D | Q8NHZ8 | protein_coding | tolerated(0.9) | benign(0) | TCGA-EO-A3B0-01 | Endometrium | uterine corpus endometrioid carcinoma | Female | <65 | III/IV | Unknown | Unknown | SD |
| CDC26 | SNV | Missense_Mutation | rs780745708 | c.23N>A | p.Arg8His | p.R8H | Q8NHZ8 | protein_coding | deleterious(0.01) | probably_damaging(0.995) | TCGA-21-1080-01 | Lung | lung squamous cell carcinoma | Male | >=65 | I/II | Unknown | Unknown | SD |
| CDC26 | SNV | Missense_Mutation | novel | c.247N>T | p.Leu83Phe | p.L83F | Q8NHZ8 | protein_coding | tolerated(1) | benign(0) | TCGA-CV-A45Z-01 | Oral cavity | head & neck squamous cell carcinoma | Male | >=65 | I/II | Unknown | Unknown | PD |
| CDC26 | SNV | Missense_Mutation | c.125N>T | p.Ser42Ile | p.S42I | Q8NHZ8 | protein_coding | tolerated(0.17) | possibly_damaging(0.798) | TCGA-BR-4368-01 | Stomach | stomach adenocarcinoma | Female | >=65 | III/IV | Unknown | Unknown | SD |
| Page: 1 |
Top |
Related drugs of malignant transformation related genes |
| Identification of chemicals and drugs interact with genes involved in malignant transfromation |
| (DGIdb 4.0) |
| Entrez ID | Symbol | Category | Interaction Types | Drug Claim Name | Drug Name | PMIDs |
| Page: 1 |

Copyright 2023-Present -The University of Texas Health Science Center at Houston |