Schematic overview of the cellular and molecular mechanisms involved in the cancer progression, including the proposed cellular and molecular mechanisms in cancer cells trajectory. AT1: alveolar type 1 cells; AT2: alveolar type 2 cells; AAH: atypical adenomatous hyperplasia; AIS: adenocarcinoma in situ; MIA: minimally invasive adenocarcinoma; IA: invasive adenocarcinoma; EMT: epithelial-mesenchymal transition

Home

Download

Statistics

Help

Contact

Center for Computational Systems Medicine
leaf

Gene summary

leaf

Malignant transformation analysis

leaf

Malignant transformation related pathway analysis

leaf

Cell-cell communication analysis

leaf

Single-cell gene regulatory network inference analysis

leaf

Somatic mutation of malignant transformation related genes

leaf

Related drugs of malignant transformation related genes

Gene: CDC25B

Gene summary for CDC25B

check button Gene summary.

Gene informationSpeciesHuman
Gene symbol

CDC25B

Gene ID

994

Gene namecell division cycle 25B
Gene AliasCDC25B
Cytomap20p13
Gene Typeprotein-coding
GO ID

GO:0000003

UniProtAcc

B4DIG0


Top

Malignant transformation analysis

check button Identification of the aberrant gene expression in precancerous and cancerous lesions by comparing the gene expression of stem-like cells in diseased tissues with normal stem cells
check button Malignant transformation involving gene list.
Entrez IDSymbolReplicatesSpeciesOrganTissueAdj P-valueLog2FCMalignancy
994CDC25BHTA11_1938_2000001011HumanColorectumAD2.34e-042.09e-01-0.0811
994CDC25BHTA11_696_2000001011HumanColorectumAD1.21e-072.86e-01-0.1464
994CDC25BHTA11_866_2000001011HumanColorectumAD9.46e-031.50e-01-0.1001
994CDC25BHTA11_1391_2000001011HumanColorectumAD1.06e-114.91e-01-0.059
994CDC25BHTA11_546_2000001011HumanColorectumAD1.50e-043.65e-01-0.0842
994CDC25BHTA11_866_3004761011HumanColorectumAD4.78e-185.00e-010.096
994CDC25BHTA11_10711_2000001011HumanColorectumAD2.86e-032.07e-010.0338
994CDC25BHTA11_99999970781_79442HumanColorectumMSS4.10e-122.82e-010.294
994CDC25BHTA11_99999965104_69814HumanColorectumMSS2.26e-051.79e-010.281
994CDC25BHTA11_99999973899_84307HumanColorectumMSS2.35e-248.31e-010.2585
994CDC25BHTA11_99999974143_84620HumanColorectumMSS3.35e-225.38e-010.3005
994CDC25BLZE2THumanEsophagusESCC9.51e-043.12e-010.082
994CDC25BLZE4THumanEsophagusESCC9.36e-147.82e-020.0811
994CDC25BLZE8THumanEsophagusESCC4.41e-033.55e-020.067
994CDC25BP1T-EHumanEsophagusESCC2.11e-043.71e-010.0875
994CDC25BP2T-EHumanEsophagusESCC3.87e-094.98e-010.1177
994CDC25BP4T-EHumanEsophagusESCC3.82e-103.75e-010.1323
994CDC25BP5T-EHumanEsophagusESCC7.62e-161.77e-010.1327
994CDC25BP8T-EHumanEsophagusESCC2.29e-021.43e-020.0889
994CDC25BP9T-EHumanEsophagusESCC1.50e-062.54e-010.1131
Page: 1 2 3 4 5 6 

check button Transcriptomic changes along malignancy continuum.
TissueExpression DynamicsAbbreviation
Colorectum (GSE201348)The image shows the transcriptomic changes along malignancy continuum.log2FC in expression of this searched gene in stem-like cells from each diseased tissue sample relative to stem-like cells in normal samples in each tissue plotted against the malignancy continuum. Samples are colored based on if they are from different disease stage.FAP: Familial adenomatous polyposis
CRC: Colorectal cancer
Colorectum (HTA11)The image shows the transcriptomic changes along malignancy continuum.log2FC in expression of this searched gene in stem-like cells from each diseased tissue sample relative to stem-like cells in normal samples in each tissue plotted against the malignancy continuum. Samples are colored based on if they are from different disease stage.AD: Adenomas
SER: Sessile serrated lesions
MSI-H: Microsatellite-high colorectal cancer
MSS: Microsatellite stable colorectal cancer
EsophagusThe image shows the transcriptomic changes along malignancy continuum.log2FC in expression of this searched gene in stem-like cells from each diseased tissue sample relative to stem-like cells in normal samples in each tissue plotted against the malignancy continuum. Samples are colored based on if they are from different disease stage.
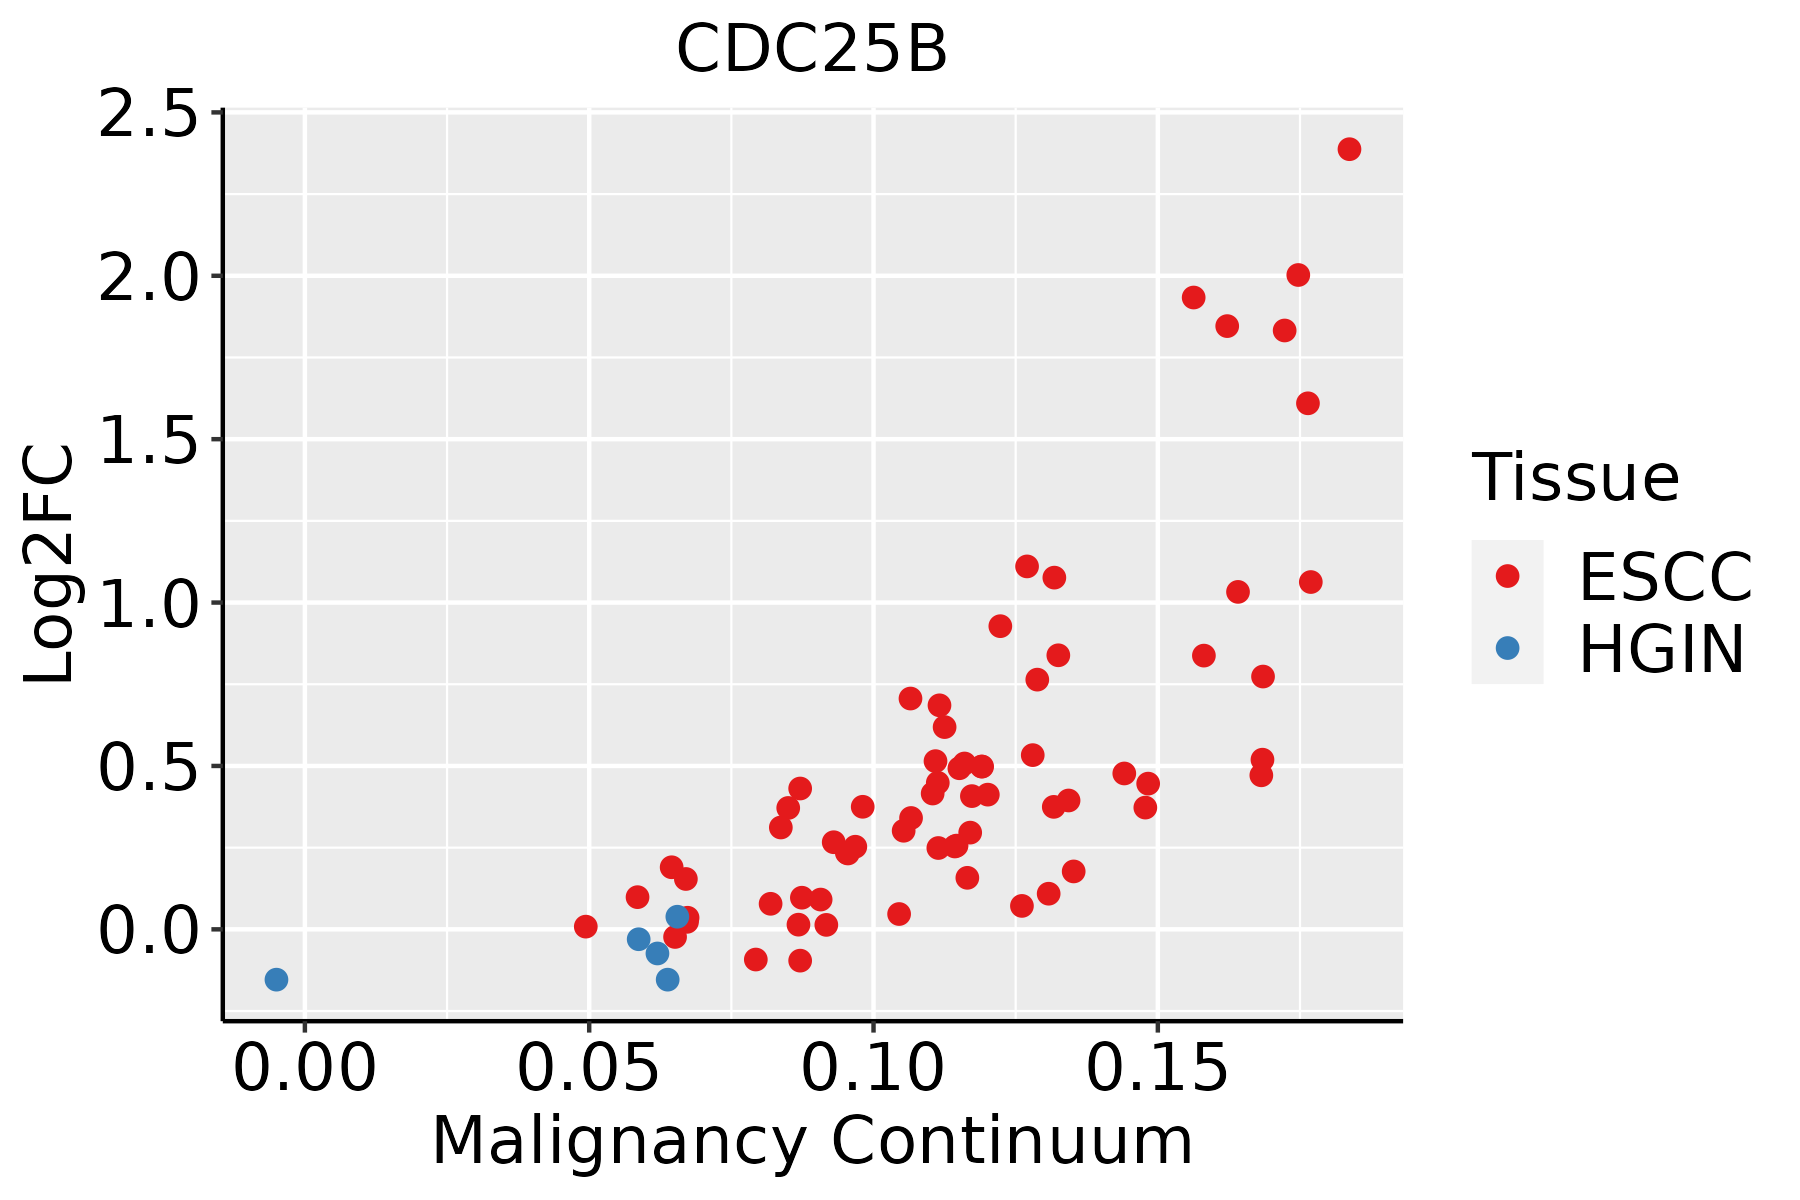
ESCC: Esophageal squamous cell carcinoma
HGIN: High-grade intraepithelial neoplasias
LGIN: Low-grade intraepithelial neoplasias
LiverThe image shows the transcriptomic changes along malignancy continuum.log2FC in expression of this searched gene in stem-like cells from each diseased tissue sample relative to stem-like cells in normal samples in each tissue plotted against the malignancy continuum. Samples are colored based on if they are from different disease stage.
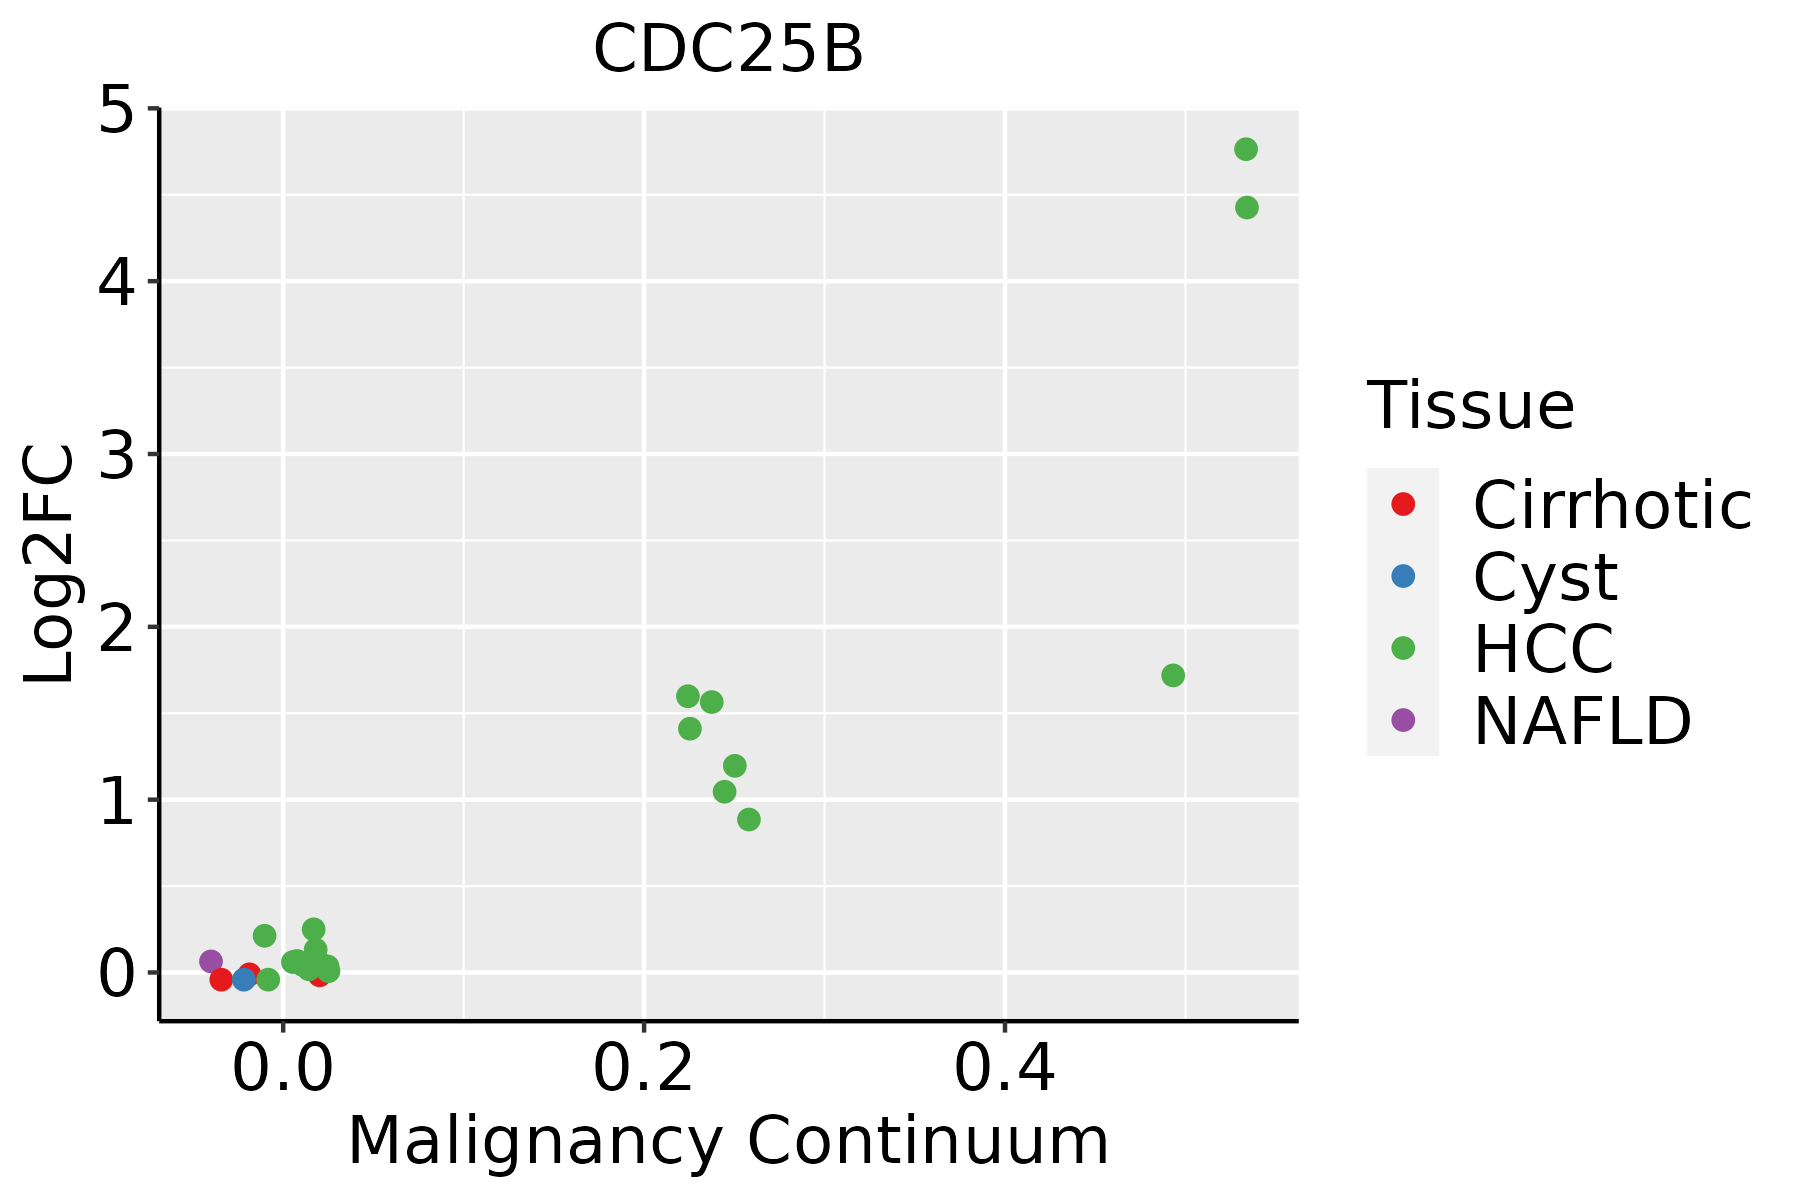
HCC: Hepatocellular carcinoma
NAFLD: Non-alcoholic fatty liver disease
Oral CavityThe image shows the transcriptomic changes along malignancy continuum.log2FC in expression of this searched gene in stem-like cells from each diseased tissue sample relative to stem-like cells in normal samples in each tissue plotted against the malignancy continuum. Samples are colored based on if they are from different disease stage.EOLP: Erosive Oral lichen planus
LP: leukoplakia
NEOLP: Non-erosive oral lichen planus
OSCC: Oral squamous cell carcinoma
SkinThe image shows the transcriptomic changes along malignancy continuum.log2FC in expression of this searched gene in stem-like cells from each diseased tissue sample relative to stem-like cells in normal samples in each tissue plotted against the malignancy continuum. Samples are colored based on if they are from different disease stage.AK: Actinic keratosis
cSCC: Cutaneous squamous cell carcinoma
SCCIS:squamous cell carcinoma in situ
ThyroidThe image shows the transcriptomic changes along malignancy continuum.log2FC in expression of this searched gene in stem-like cells from each diseased tissue sample relative to stem-like cells in normal samples in each tissue plotted against the malignancy continuum. Samples are colored based on if they are from different disease stage.
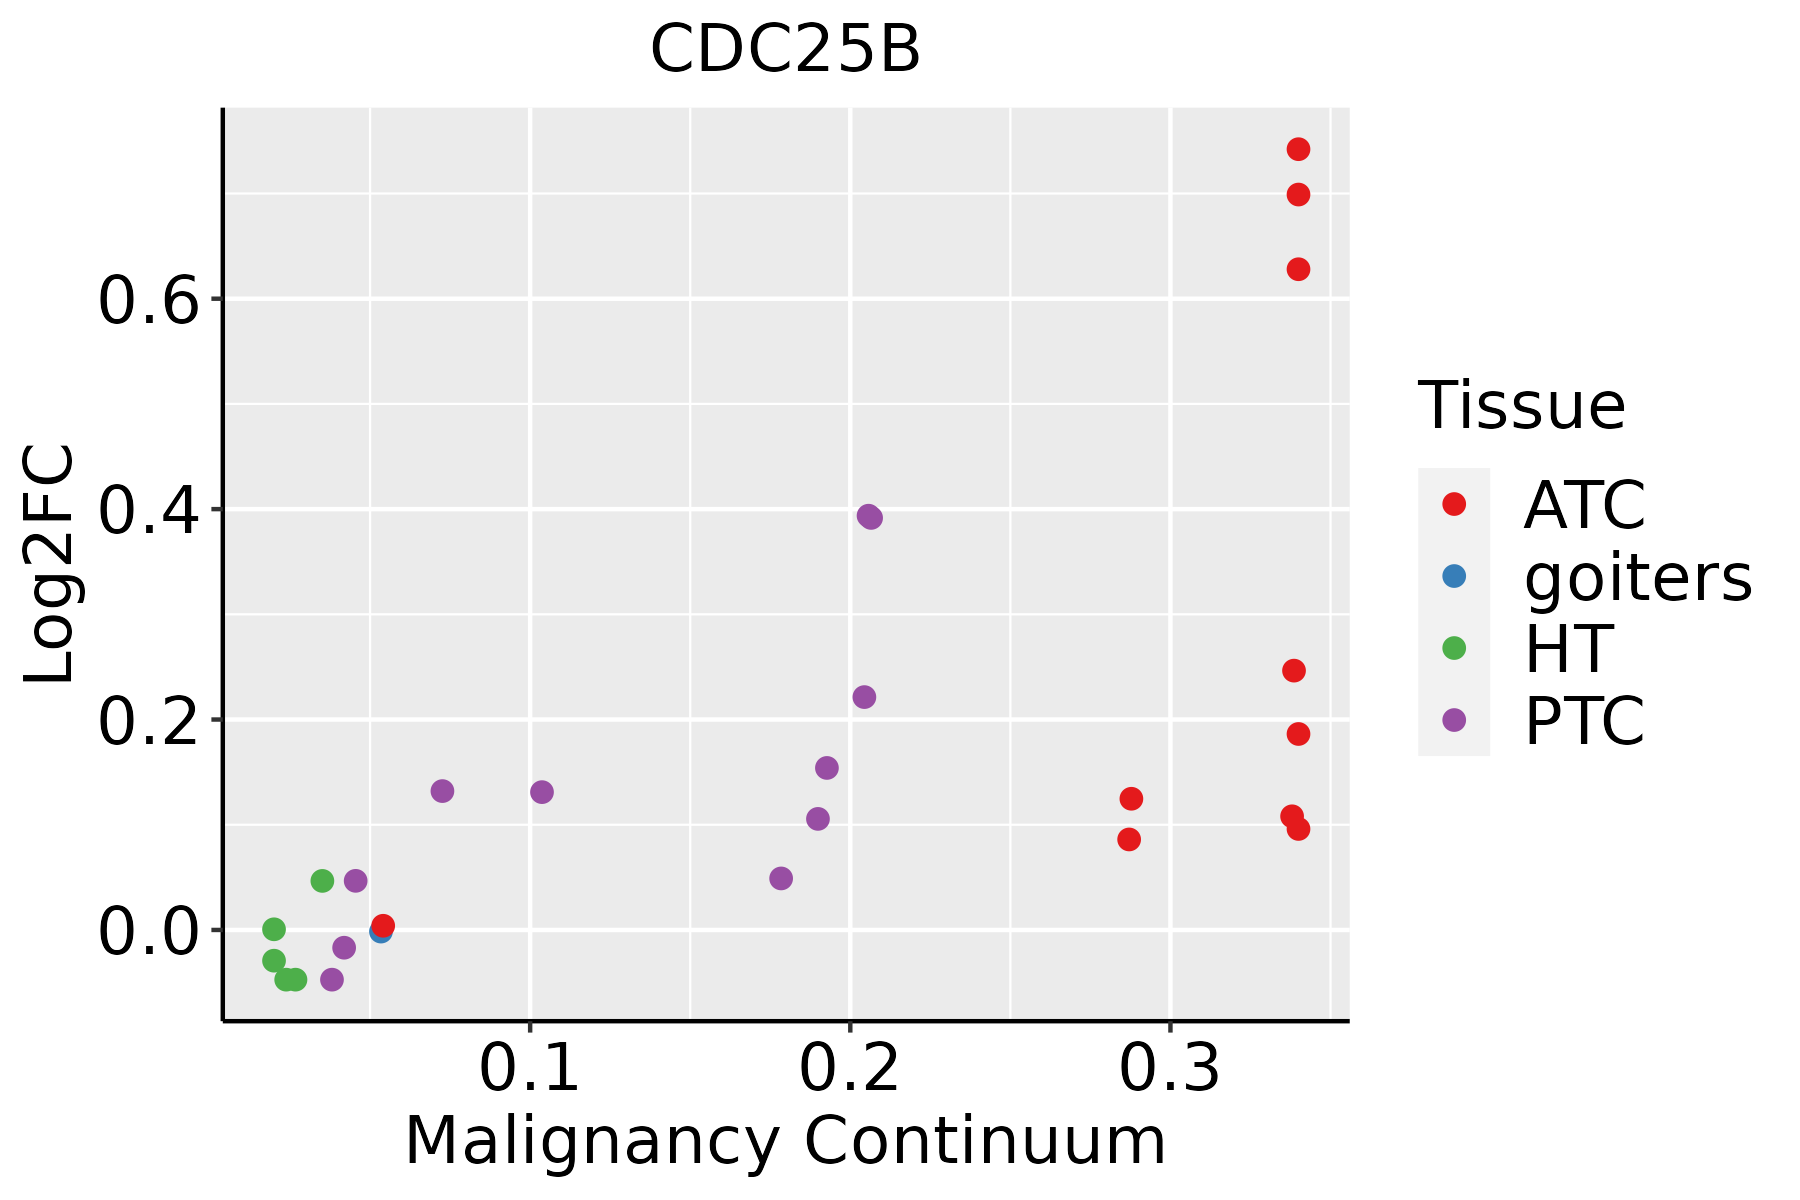
ATC: Anaplastic thyroid cancer
HT: Hashimoto's thyroiditis
PTC: Papillary thyroid cancer
∗log2FC in expression of this searched gene in stem-like cells from each diseased tissue sample relative to stem-like cells in normal samples in each tissue plotted against the malignancy continuum. Samples are colored based on if they are from different disease stage.

Top

Malignant transformation related pathway analysis

check buttonFind out the enriched GO biological processes and KEGG pathways involved in transition from healthy to precancer to cancer
check button Figure of enriched GO biological processes.
TissueDisease StageEnriched GO biological Processes
ColorectumADGO analysis - Figure of enriched GO biological processes: Top 15 enriched GO BP terms are showed in the bar plot of each disease state in each tissue. Each row represents a significant GO biological process which is colored according to the -log10(p.adjust).
ColorectumSERGO analysis - Figure of enriched GO biological processes: Top 15 enriched GO BP terms are showed in the bar plot of each disease state in each tissue. Each row represents a significant GO biological process which is colored according to the -log10(p.adjust).
ColorectumMSSGO analysis - Figure of enriched GO biological processes: Top 15 enriched GO BP terms are showed in the bar plot of each disease state in each tissue. Each row represents a significant GO biological process which is colored according to the -log10(p.adjust).
ColorectumMSI-HGO analysis - Figure of enriched GO biological processes: Top 15 enriched GO BP terms are showed in the bar plot of each disease state in each tissue. Each row represents a significant GO biological process which is colored according to the -log10(p.adjust).
ColorectumFAPGO analysis - Figure of enriched GO biological processes: Top 15 enriched GO BP terms are showed in the bar plot of each disease state in each tissue. Each row represents a significant GO biological process which is colored according to the -log10(p.adjust).
∗Top 15 enriched GO BP terms are showed in the bar plot of each disease state in each tissue. Each row represents a significant GO biological process which is colored according to the -log10(p.adjust).
Page: 1 2 3 4 5 6 7 8 9 

check button Enriched GO biological processes.
GO IDTissueDisease StageDescriptionGene RatioBg Ratiopvaluep.adjustCount
GO:0016311ColorectumADdephosphorylation123/3918417/187231.84e-053.82e-04123
GO:0006470ColorectumADprotein dephosphorylation88/3918281/187232.56e-054.89e-0488
GO:0000910ColorectumADcytokinesis59/3918173/187233.74e-056.75e-0459
GO:0033674ColorectumADpositive regulation of kinase activity131/3918467/187231.28e-041.85e-03131
GO:0045860ColorectumADpositive regulation of protein kinase activity107/3918386/187238.01e-047.92e-03107
GO:0007346ColorectumADregulation of mitotic cell cycle119/3918457/187234.60e-033.14e-02119
GO:0045787ColorectumADpositive regulation of cell cycle85/3918313/187234.76e-033.22e-0285
GO:0045931ColorectumADpositive regulation of mitotic cell cycle37/3918121/187237.88e-034.73e-0237
GO:00336742ColorectumMSSpositive regulation of kinase activity122/3467467/187232.50e-055.21e-04122
GO:00458602ColorectumMSSpositive regulation of protein kinase activity102/3467386/187236.93e-051.20e-03102
GO:00009102ColorectumMSScytokinesis49/3467173/187231.02e-031.02e-0249
GO:00457871ColorectumMSSpositive regulation of cell cycle80/3467313/187231.15e-031.12e-0280
GO:00064702ColorectumMSSprotein dephosphorylation73/3467281/187231.15e-031.12e-0273
GO:00163112ColorectumMSSdephosphorylation101/3467417/187231.98e-031.70e-02101
GO:00073461ColorectumMSSregulation of mitotic cell cycle108/3467457/187233.30e-032.50e-02108
GO:0090068ColorectumMSSpositive regulation of cell cycle process60/3467236/187235.01e-033.46e-0260
GO:004477216EsophagusESCCmitotic cell cycle phase transition281/8552424/187234.63e-184.45e-16281
GO:000734615EsophagusESCCregulation of mitotic cell cycle293/8552457/187238.00e-165.64e-14293
GO:00482853EsophagusESCCorganelle fission301/8552488/187234.64e-132.12e-11301
GO:00002802EsophagusESCCnuclear division270/8552439/187231.17e-114.24e-10270
Page: 1 2 3 4 5 6 7 8 

check button Enriched KEGG pathways.
Pathway IDTissueDisease StageDescriptionGene RatioBg Ratiopvaluep.adjustqvalueCount
hsa0411023EsophagusESCCCell cycle126/4205157/84651.34e-155.60e-142.87e-14126
hsa0411033EsophagusESCCCell cycle126/4205157/84651.34e-155.60e-142.87e-14126
hsa041102LiverHCCCell cycle106/4020157/84652.54e-073.04e-061.69e-06106
hsa041103LiverHCCCell cycle106/4020157/84652.54e-073.04e-061.69e-06106
hsa041108Oral cavityOSCCCell cycle118/3704157/84657.15e-162.66e-141.35e-14118
hsa0401014Oral cavityOSCCMAPK signaling pathway165/3704302/84657.11e-052.74e-041.40e-04165
hsa0411015Oral cavityOSCCCell cycle118/3704157/84657.15e-162.66e-141.35e-14118
hsa0401015Oral cavityOSCCMAPK signaling pathway165/3704302/84657.11e-052.74e-041.40e-04165
Page: 1 

Top

Cell-cell communication analysis

check buttonIdentification of potential cell-cell interactions between two cell types and their ligand-receptor pairs for different disease states
LigandReceptorLRpairPathwayTissueDisease Stage
Page: 1 

Top

Single-cell gene regulatory network inference analysis

check buttonFind out the significant the regulons (TFs) and the target genes of each regulon across cell types for different disease states
TFCell TypeTissueDisease StageTarget GeneRSSRegulon Activity
∗The dot plots of a searched regulon are shown for all cell subpopulations in each disease state of each tissue based on the regulon specific score inferred using pySCENIC and by calculating the average expression.
Page: 1 

Top

Somatic mutation of malignant transformation related genes

check buttonAnnotation of somatic variants for genes involved in malignant transformation
Hugo SymbolVariant ClassVariant ClassificationdbSNP RSHGVScHGVSpHGVSp ShortSWISSPROTBIOTYPESIFTPolyPhenTumor Sample BarcodeTissueHistologySexAgeStageTherapy TypesDrugsOutcome
CDC25BSNVMissense_Mutationc.1293C>Gp.Ile431Metp.I431MP30305protein_codingtolerated(0.05)benign(0.04)TCGA-A2-A0YH-01Breastbreast invasive carcinomaFemale<65III/IVChemotherapyadriamycinSD
CDC25BSNVMissense_Mutationc.1634T>Cp.Met545Thrp.M545TP30305protein_codingdeleterious(0)probably_damaging(0.995)TCGA-A8-A081-01Breastbreast invasive carcinomaFemale>=65I/IIUnknownUnknownSD
CDC25BSNVMissense_Mutationnovelc.275N>Ap.Arg92Glnp.R92QP30305protein_codingdeleterious(0.04)possibly_damaging(0.652)TCGA-AC-A62V-01Breastbreast invasive carcinomaMale<65III/IVTargeted Molecular therapydenosumabPD
CDC25BSNVMissense_Mutationc.1055N>Ap.Arg352Glnp.R352QP30305protein_codingdeleterious(0.01)benign(0.254)TCGA-BH-A0EE-01Breastbreast invasive carcinomaFemale>=65I/IIChemotherapydocetaxelSD
CDC25BinsertionIn_Frame_Insnovelc.401_402insCTCCCTGTCGTCTGAp.Ala134_Ala135insSerLeuSerSerGlup.A134_A135insSLSSEP30305protein_codingTCGA-A8-A08S-01Breastbreast invasive carcinomaFemale>=65I/IIHormone TherapyanastrozoleSD
CDC25BdeletionFrame_Shift_Delnovelc.589_590delNNp.Phe197CysfsTer43p.F197Cfs*43P30305protein_codingTCGA-AR-A2LH-01Breastbreast invasive carcinomaFemale<65III/IVChemotherapyadriamycinPD
CDC25BSNVMissense_Mutationrs767534464c.659N>Ap.Arg220Hisp.R220HP30305protein_codingtolerated(0.13)probably_damaging(0.919)TCGA-2W-A8YY-01Cervixcervical & endocervical cancerFemale<65I/IIChemotherapycisplatinCR
CDC25BSNVMissense_Mutationrs770335566c.1169N>Ap.Arg390Glnp.R390QP30305protein_codingdeleterious(0.04)possibly_damaging(0.711)TCGA-C5-A1MN-01Cervixcervical & endocervical cancerFemale<65III/IVChemotherapycisplatinSD
CDC25BSNVMissense_Mutationc.1072N>Ap.Glu358Lysp.E358KP30305protein_codingtolerated(0.15)benign(0.403)TCGA-FU-A3WB-01Cervixcervical & endocervical cancerFemale<65I/IIChemotherapycisplatinCR
CDC25BSNVMissense_Mutationnovelc.1489N>Gp.Met497Valp.M497VP30305protein_codingdeleterious(0)probably_damaging(0.996)TCGA-5M-AAT6-01Colorectumcolon adenocarcinomaFemale<65III/IVUnknownUnknownPD
Page: 1 2 3 4 5 6 

Top

Related drugs of malignant transformation related genes

check buttonIdentification of chemicals and drugs interact with genes involved in malignant transfromation
(DGIdb 4.0)
Entrez IDSymbolCategoryInteraction TypesDrug Claim NameDrug NamePMIDs
994CDC25BDRUGGABLE GENOME, PROTEIN PHOSPHATASE, KINASEAvastin+/-Tarceva
994CDC25BDRUGGABLE GENOME, PROTEIN PHOSPHATASE, KINASENSC-663284CHEMBL33717325703307
994CDC25BDRUGGABLE GENOME, PROTEIN PHOSPHATASE, KINASENSC-156744CHEMBL148145322524450
994CDC25BDRUGGABLE GENOME, PROTEIN PHOSPHATASE, KINASENSC-125252CHEMBL140803122524450
994CDC25BDRUGGABLE GENOME, PROTEIN PHOSPHATASE, KINASENSC-109483CHEMBL50715922524450
994CDC25BDRUGGABLE GENOME, PROTEIN PHOSPHATASE, KINASENSC-122400CHEMBL205906722524450
994CDC25BDRUGGABLE GENOME, PROTEIN PHOSPHATASE, KINASENSC-46080CHEMBL133175422524450
994CDC25BDRUGGABLE GENOME, PROTEIN PHOSPHATASE, KINASENSC-601364CHEMBL127006122524450
994CDC25BDRUGGABLE GENOME, PROTEIN PHOSPHATASE, KINASENSC-119915CHEMBL148197422524450
994CDC25BDRUGGABLE GENOME, PROTEIN PHOSPHATASE, KINASENSC-127133CHEMBL117291122524450
Page: 1 2 3