
|
|||||
|
 | |
| |
| |
| |
| |
| |
|
Gene: CDC14B |
Gene summary for CDC14B |
| Gene information | Species | Human | Gene symbol | CDC14B | Gene ID | 8555 |
| Gene name | cell division cycle 14B | |
| Gene Alias | CDC14B3 | |
| Cytomap | 9q22.32-q22.33 | |
| Gene Type | protein-coding | GO ID | GO:0000075 | UniProtAcc | O60729 |
Top |
Malignant transformation analysis |
| Identification of the aberrant gene expression in precancerous and cancerous lesions by comparing the gene expression of stem-like cells in diseased tissues with normal stem cells |
| Entrez ID | Symbol | Replicates | Species | Organ | Tissue | Adj P-value | Log2FC | Malignancy |
| 8555 | CDC14B | CCI_1 | Human | Cervix | CC | 1.11e-09 | 8.53e-01 | 0.528 |
| 8555 | CDC14B | CCI_3 | Human | Cervix | CC | 1.56e-04 | 4.86e-01 | 0.516 |
| 8555 | CDC14B | NAFLD1 | Human | Liver | NAFLD | 1.63e-08 | 8.14e-01 | -0.04 |
| 8555 | CDC14B | S41 | Human | Liver | Cirrhotic | 3.86e-02 | 3.86e-01 | -0.0343 |
| 8555 | CDC14B | S43 | Human | Liver | Cirrhotic | 3.20e-02 | -1.43e-01 | -0.0187 |
| 8555 | CDC14B | HCC1_Meng | Human | Liver | HCC | 1.12e-10 | -1.82e-01 | 0.0246 |
| 8555 | CDC14B | HCC2_Meng | Human | Liver | HCC | 1.73e-13 | -9.47e-02 | 0.0107 |
| 8555 | CDC14B | HCC1 | Human | Liver | HCC | 1.74e-02 | 2.83e+00 | 0.5336 |
| 8555 | CDC14B | Pt13.a | Human | Liver | HCC | 4.95e-03 | -1.79e-01 | 0.021 |
| 8555 | CDC14B | S014 | Human | Liver | HCC | 2.10e-12 | 6.46e-01 | 0.2254 |
| 8555 | CDC14B | S015 | Human | Liver | HCC | 1.62e-09 | 6.18e-01 | 0.2375 |
| 8555 | CDC14B | S016 | Human | Liver | HCC | 3.57e-13 | 5.86e-01 | 0.2243 |
| 8555 | CDC14B | HTA12-15-2 | Human | Pancreas | PDAC | 3.85e-04 | 3.66e-01 | 0.2315 |
| 8555 | CDC14B | HTA12-25-1 | Human | Pancreas | PDAC | 1.99e-02 | 3.98e-01 | 0.313 |
| 8555 | CDC14B | HTA12-26-1 | Human | Pancreas | PDAC | 3.02e-11 | 6.50e-01 | 0.3728 |
| 8555 | CDC14B | HTA12-29-1 | Human | Pancreas | PDAC | 1.91e-33 | 7.20e-01 | 0.3722 |
| Page: 1 |
| Tissue | Expression Dynamics | Abbreviation |
| Cervix |  | CC: Cervix cancer |
| HSIL_HPV: HPV-infected high-grade squamous intraepithelial lesions | ||
| N_HPV: HPV-infected normal cervix | ||
| Liver | 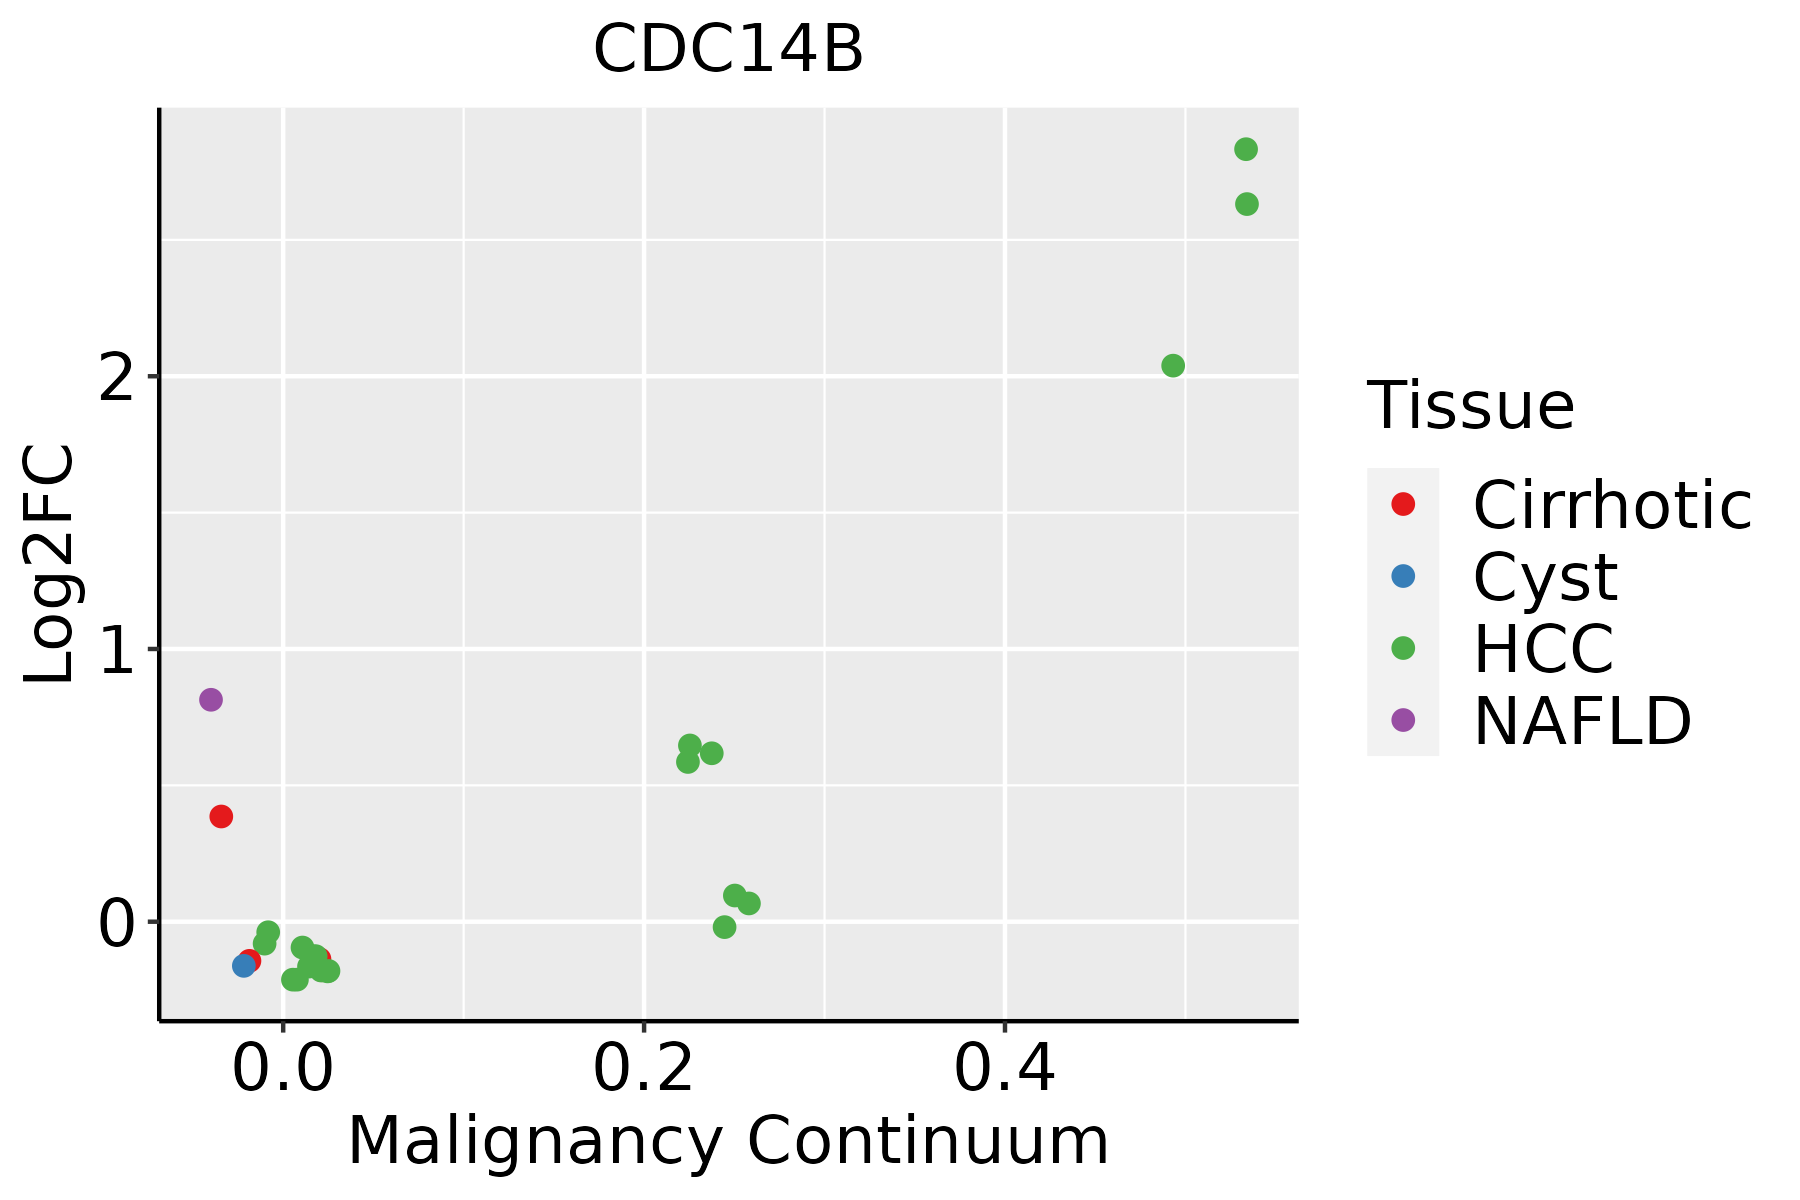 | HCC: Hepatocellular carcinoma |
| NAFLD: Non-alcoholic fatty liver disease |
| ∗log2FC in expression of this searched gene in stem-like cells from each diseased tissue sample relative to stem-like cells in normal samples in each tissue plotted against the malignancy continuum. Samples are colored based on if they are from different disease stage. |
Top |
Malignant transformation related pathway analysis |
| Find out the enriched GO biological processes and KEGG pathways involved in transition from healthy to precancer to cancer |
| Tissue | Disease Stage | Enriched GO biological Processes |
| Colorectum | AD |  |
| Colorectum | SER |  |
| Colorectum | MSS |  |
| Colorectum | MSI-H |  |
| Colorectum | FAP |  |
| ∗Top 15 enriched GO BP terms are showed in the bar plot of each disease state in each tissue. Each row represents a significant GO biological process which is colored according to the -log10(p.adjust). |
| Page: 1 2 3 4 5 6 7 8 9 |
| GO ID | Tissue | Disease Stage | Description | Gene Ratio | Bg Ratio | pvalue | p.adjust | Count |
| GO:190332010 | Cervix | CC | regulation of protein modification by small protein conjugation or removal | 66/2311 | 242/18723 | 2.31e-10 | 3.46e-08 | 66 |
| GO:003139610 | Cervix | CC | regulation of protein ubiquitination | 59/2311 | 210/18723 | 5.90e-10 | 7.51e-08 | 59 |
| GO:00447725 | Cervix | CC | mitotic cell cycle phase transition | 89/2311 | 424/18723 | 2.70e-07 | 1.12e-05 | 89 |
| GO:19046669 | Cervix | CC | regulation of ubiquitin protein ligase activity | 12/2311 | 23/18723 | 4.41e-06 | 1.12e-04 | 12 |
| GO:00457876 | Cervix | CC | positive regulation of cell cycle | 66/2311 | 313/18723 | 7.78e-06 | 1.81e-04 | 66 |
| GO:00073466 | Cervix | CC | regulation of mitotic cell cycle | 88/2311 | 457/18723 | 1.26e-05 | 2.60e-04 | 88 |
| GO:19019903 | Cervix | CC | regulation of mitotic cell cycle phase transition | 63/2311 | 299/18723 | 1.27e-05 | 2.60e-04 | 63 |
| GO:00064708 | Cervix | CC | protein dephosphorylation | 60/2311 | 281/18723 | 1.33e-05 | 2.68e-04 | 60 |
| GO:00514387 | Cervix | CC | regulation of ubiquitin-protein transferase activity | 18/2311 | 53/18723 | 3.69e-05 | 5.84e-04 | 18 |
| GO:00900685 | Cervix | CC | positive regulation of cell cycle process | 50/2311 | 236/18723 | 8.25e-05 | 1.11e-03 | 50 |
| GO:19019873 | Cervix | CC | regulation of cell cycle phase transition | 74/2311 | 390/18723 | 9.80e-05 | 1.27e-03 | 74 |
| GO:00513021 | Cervix | CC | regulation of cell division | 39/2311 | 177/18723 | 2.05e-04 | 2.33e-03 | 39 |
| GO:00009107 | Cervix | CC | cytokinesis | 37/2311 | 173/18723 | 5.40e-04 | 5.23e-03 | 37 |
| GO:00163117 | Cervix | CC | dephosphorylation | 73/2311 | 417/18723 | 1.23e-03 | 9.87e-03 | 73 |
| GO:0032465 | Cervix | CC | regulation of cytokinesis | 22/2311 | 92/18723 | 1.55e-03 | 1.20e-02 | 22 |
| GO:00448392 | Cervix | CC | cell cycle G2/M phase transition | 31/2311 | 148/18723 | 2.07e-03 | 1.51e-02 | 31 |
| GO:00457862 | Cervix | CC | negative regulation of cell cycle | 67/2311 | 385/18723 | 2.21e-03 | 1.59e-02 | 67 |
| GO:00000862 | Cervix | CC | G2/M transition of mitotic cell cycle | 29/2311 | 137/18723 | 2.40e-03 | 1.70e-02 | 29 |
| GO:00459302 | Cervix | CC | negative regulation of mitotic cell cycle | 44/2311 | 235/18723 | 3.02e-03 | 1.99e-02 | 44 |
| GO:00427705 | Cervix | CC | signal transduction in response to DNA damage | 34/2311 | 172/18723 | 3.52e-03 | 2.27e-02 | 34 |
| Page: 1 2 3 4 5 |
| Pathway ID | Tissue | Disease Stage | Description | Gene Ratio | Bg Ratio | pvalue | p.adjust | qvalue | Count |
| hsa041106 | Cervix | CC | Cell cycle | 36/1267 | 157/8465 | 4.94e-03 | 1.67e-02 | 9.86e-03 | 36 |
| hsa0411013 | Cervix | CC | Cell cycle | 36/1267 | 157/8465 | 4.94e-03 | 1.67e-02 | 9.86e-03 | 36 |
| hsa041104 | Liver | Cirrhotic | Cell cycle | 61/2530 | 157/8465 | 9.53e-03 | 3.21e-02 | 1.98e-02 | 61 |
| hsa0411011 | Liver | Cirrhotic | Cell cycle | 61/2530 | 157/8465 | 9.53e-03 | 3.21e-02 | 1.98e-02 | 61 |
| hsa041102 | Liver | HCC | Cell cycle | 106/4020 | 157/8465 | 2.54e-07 | 3.04e-06 | 1.69e-06 | 106 |
| hsa041103 | Liver | HCC | Cell cycle | 106/4020 | 157/8465 | 2.54e-07 | 3.04e-06 | 1.69e-06 | 106 |
| Page: 1 |
Top |
Cell-cell communication analysis |
| Identification of potential cell-cell interactions between two cell types and their ligand-receptor pairs for different disease states |
| Ligand | Receptor | LRpair | Pathway | Tissue | Disease Stage |
| Page: 1 |
Top |
Single-cell gene regulatory network inference analysis |
| Find out the significant the regulons (TFs) and the target genes of each regulon across cell types for different disease states |
| TF | Cell Type | Tissue | Disease Stage | Target Gene | RSS | Regulon Activity |
| ∗The dot plots of a searched regulon are shown for all cell subpopulations in each disease state of each tissue based on the regulon specific score inferred using pySCENIC and by calculating the average expression. |
| Page: 1 |
Top |
Somatic mutation of malignant transformation related genes |
| Annotation of somatic variants for genes involved in malignant transformation |
| Hugo Symbol | Variant Class | Variant Classification | dbSNP RS | HGVSc | HGVSp | HGVSp Short | SWISSPROT | BIOTYPE | SIFT | PolyPhen | Tumor Sample Barcode | Tissue | Histology | Sex | Age | Stage | Therapy Types | Drugs | Outcome |
| CDC14B | SNV | Missense_Mutation | c.1430N>C | p.Arg477Thr | p.R477T | O60729 | protein_coding | tolerated(0.1) | probably_damaging(0.991) | TCGA-C8-A26V-01 | Breast | breast invasive carcinoma | Female | <65 | III/IV | Hormone Therapy | tamoxiphen | CR | |
| CDC14B | SNV | Missense_Mutation | novel | c.206N>T | p.Ser69Leu | p.S69L | O60729 | protein_coding | tolerated(0.09) | benign(0.003) | TCGA-C5-A1MH-01 | Cervix | cervical & endocervical cancer | Female | >=65 | III/IV | Chemotherapy | cisplatin | PD |
| CDC14B | SNV | Missense_Mutation | novel | c.1491N>T | p.Leu497Phe | p.L497F | O60729 | protein_coding | deleterious_low_confidence(0.01) | probably_damaging(0.991) | TCGA-C5-A7CK-01 | Cervix | cervical & endocervical cancer | Female | <65 | I/II | Chemotherapy | cisplatin | SD |
| CDC14B | SNV | Missense_Mutation | novel | c.212T>C | p.Val71Ala | p.V71A | O60729 | protein_coding | tolerated(0.09) | benign(0.003) | TCGA-AA-3984-01 | Colorectum | colon adenocarcinoma | Female | <65 | I/II | Unknown | Unknown | SD |
| CDC14B | SNV | Missense_Mutation | c.318G>T | p.Lys106Asn | p.K106N | O60729 | protein_coding | deleterious(0.01) | benign(0.251) | TCGA-AA-A010-01 | Colorectum | colon adenocarcinoma | Female | <65 | I/II | Chemotherapy | folinic | CR | |
| CDC14B | SNV | Missense_Mutation | c.907N>C | p.Cys303Arg | p.C303R | O60729 | protein_coding | deleterious(0) | probably_damaging(0.985) | TCGA-AA-A02R-01 | Colorectum | colon adenocarcinoma | Female | >=65 | I/II | Unknown | Unknown | PD | |
| CDC14B | SNV | Missense_Mutation | novel | c.1462N>A | p.Leu488Ile | p.L488I | O60729 | protein_coding | tolerated(0.4) | benign(0.007) | TCGA-AZ-4315-01 | Colorectum | colon adenocarcinoma | Male | <65 | I/II | Unknown | Unknown | SD |
| CDC14B | SNV | Missense_Mutation | c.683N>A | p.Cys228Tyr | p.C228Y | O60729 | protein_coding | deleterious(0.02) | possibly_damaging(0.902) | TCGA-D5-6536-01 | Colorectum | colon adenocarcinoma | Male | >=65 | I/II | Chemotherapy | 5-fu | SD | |
| CDC14B | SNV | Missense_Mutation | rs773237782 | c.1123N>T | p.Arg375Cys | p.R375C | O60729 | protein_coding | deleterious(0) | probably_damaging(0.945) | TCGA-AG-A002-01 | Colorectum | rectum adenocarcinoma | Male | <65 | I/II | Unknown | Unknown | SD |
| CDC14B | SNV | Missense_Mutation | rs373460925 | c.163N>T | p.Arg55Cys | p.R55C | O60729 | protein_coding | deleterious(0) | probably_damaging(0.992) | TCGA-EI-6917-01 | Colorectum | rectum adenocarcinoma | Male | <65 | III/IV | Chemotherapy | 5fluorouracil+oxaciplatina+l-folinian | SD |
| Page: 1 2 3 4 5 6 |
Top |
Related drugs of malignant transformation related genes |
| Identification of chemicals and drugs interact with genes involved in malignant transfromation |
| (DGIdb 4.0) |
| Entrez ID | Symbol | Category | Interaction Types | Drug Claim Name | Drug Name | PMIDs |
| Page: 1 |

Copyright 2023-Present -The University of Texas Health Science Center at Houston |