
|
|||||
|
 | |
| |
| |
| |
| |
| |
|
Gene: CDC14A |
Gene summary for CDC14A |
| Gene information | Species | Human | Gene symbol | CDC14A | Gene ID | 8556 |
| Gene name | cell division cycle 14A | |
| Gene Alias | DFNB105 | |
| Cytomap | 1p21.2 | |
| Gene Type | protein-coding | GO ID | GO:0000226 | UniProtAcc | Q9UNH5 |
Top |
Malignant transformation analysis |
| Identification of the aberrant gene expression in precancerous and cancerous lesions by comparing the gene expression of stem-like cells in diseased tissues with normal stem cells |
| Entrez ID | Symbol | Replicates | Species | Organ | Tissue | Adj P-value | Log2FC | Malignancy |
| 8556 | CDC14A | AEH-subject1 | Human | Endometrium | AEH | 3.48e-10 | 3.69e-01 | -0.3059 |
| 8556 | CDC14A | AEH-subject2 | Human | Endometrium | AEH | 1.72e-02 | 2.32e-01 | -0.2525 |
| 8556 | CDC14A | AEH-subject3 | Human | Endometrium | AEH | 2.75e-03 | 2.81e-01 | -0.2576 |
| 8556 | CDC14A | AEH-subject4 | Human | Endometrium | AEH | 5.08e-18 | 5.52e-01 | -0.2657 |
| 8556 | CDC14A | AEH-subject5 | Human | Endometrium | AEH | 6.02e-30 | 8.22e-01 | -0.2953 |
| 8556 | CDC14A | EEC-subject1 | Human | Endometrium | EEC | 3.55e-24 | 6.97e-01 | -0.2682 |
| 8556 | CDC14A | EEC-subject4 | Human | Endometrium | EEC | 2.01e-24 | 6.49e-01 | -0.2571 |
| 8556 | CDC14A | EEC-subject5 | Human | Endometrium | EEC | 2.25e-06 | 3.45e-01 | -0.249 |
| 8556 | CDC14A | TD9 | Human | Lung | IAC | 3.58e-04 | 8.60e-01 | 0.088 |
| 8556 | CDC14A | RNA-P17T-P17T-2 | Human | Lung | IAC | 1.81e-03 | 5.17e-01 | 0.3371 |
| 8556 | CDC14A | RNA-P17T-P17T-6 | Human | Lung | IAC | 1.89e-03 | 6.21e-01 | 0.3385 |
| 8556 | CDC14A | RNA-P17T-P17T-8 | Human | Lung | IAC | 1.08e-05 | 6.57e-01 | 0.3329 |
| Page: 1 |
| Tissue | Expression Dynamics | Abbreviation |
| Endometrium | 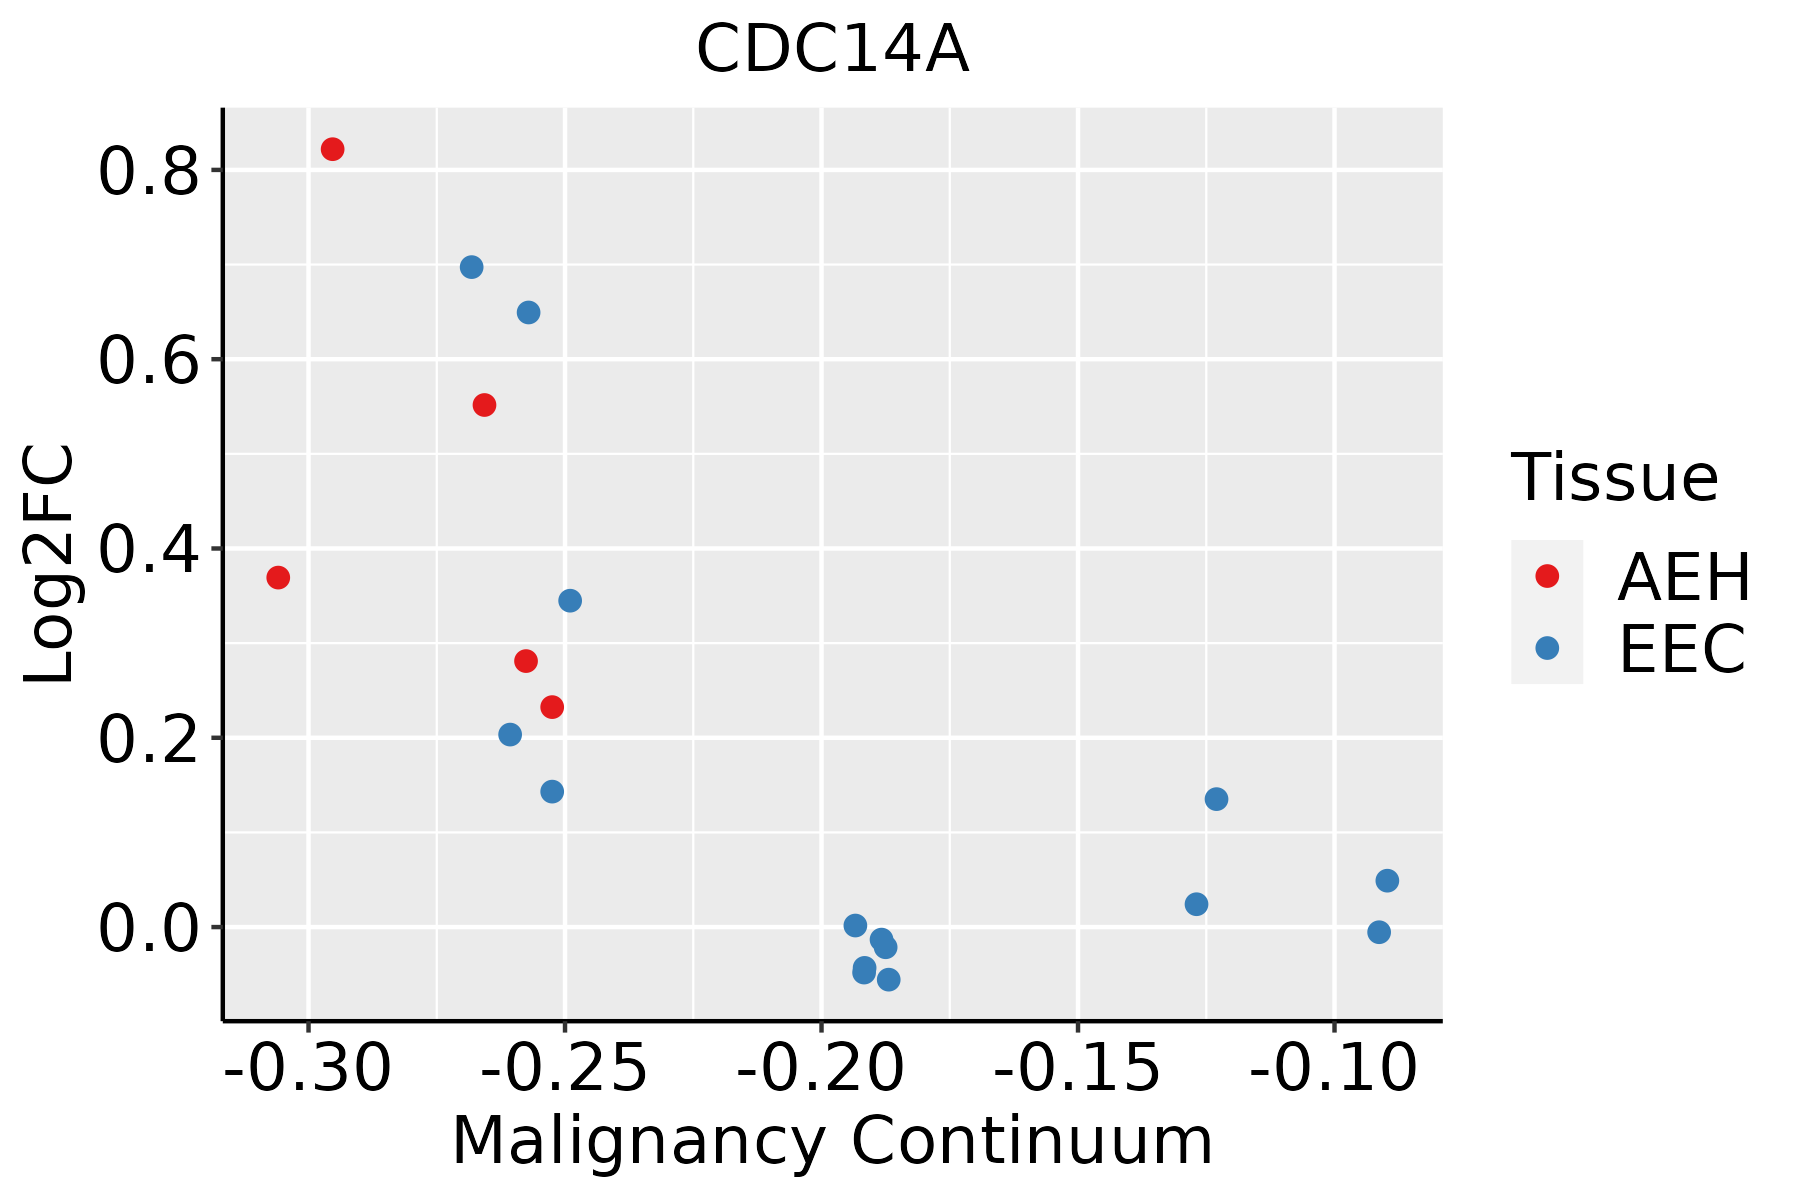 | AEH: Atypical endometrial hyperplasia |
| EEC: Endometrioid Cancer | ||
| Lung | 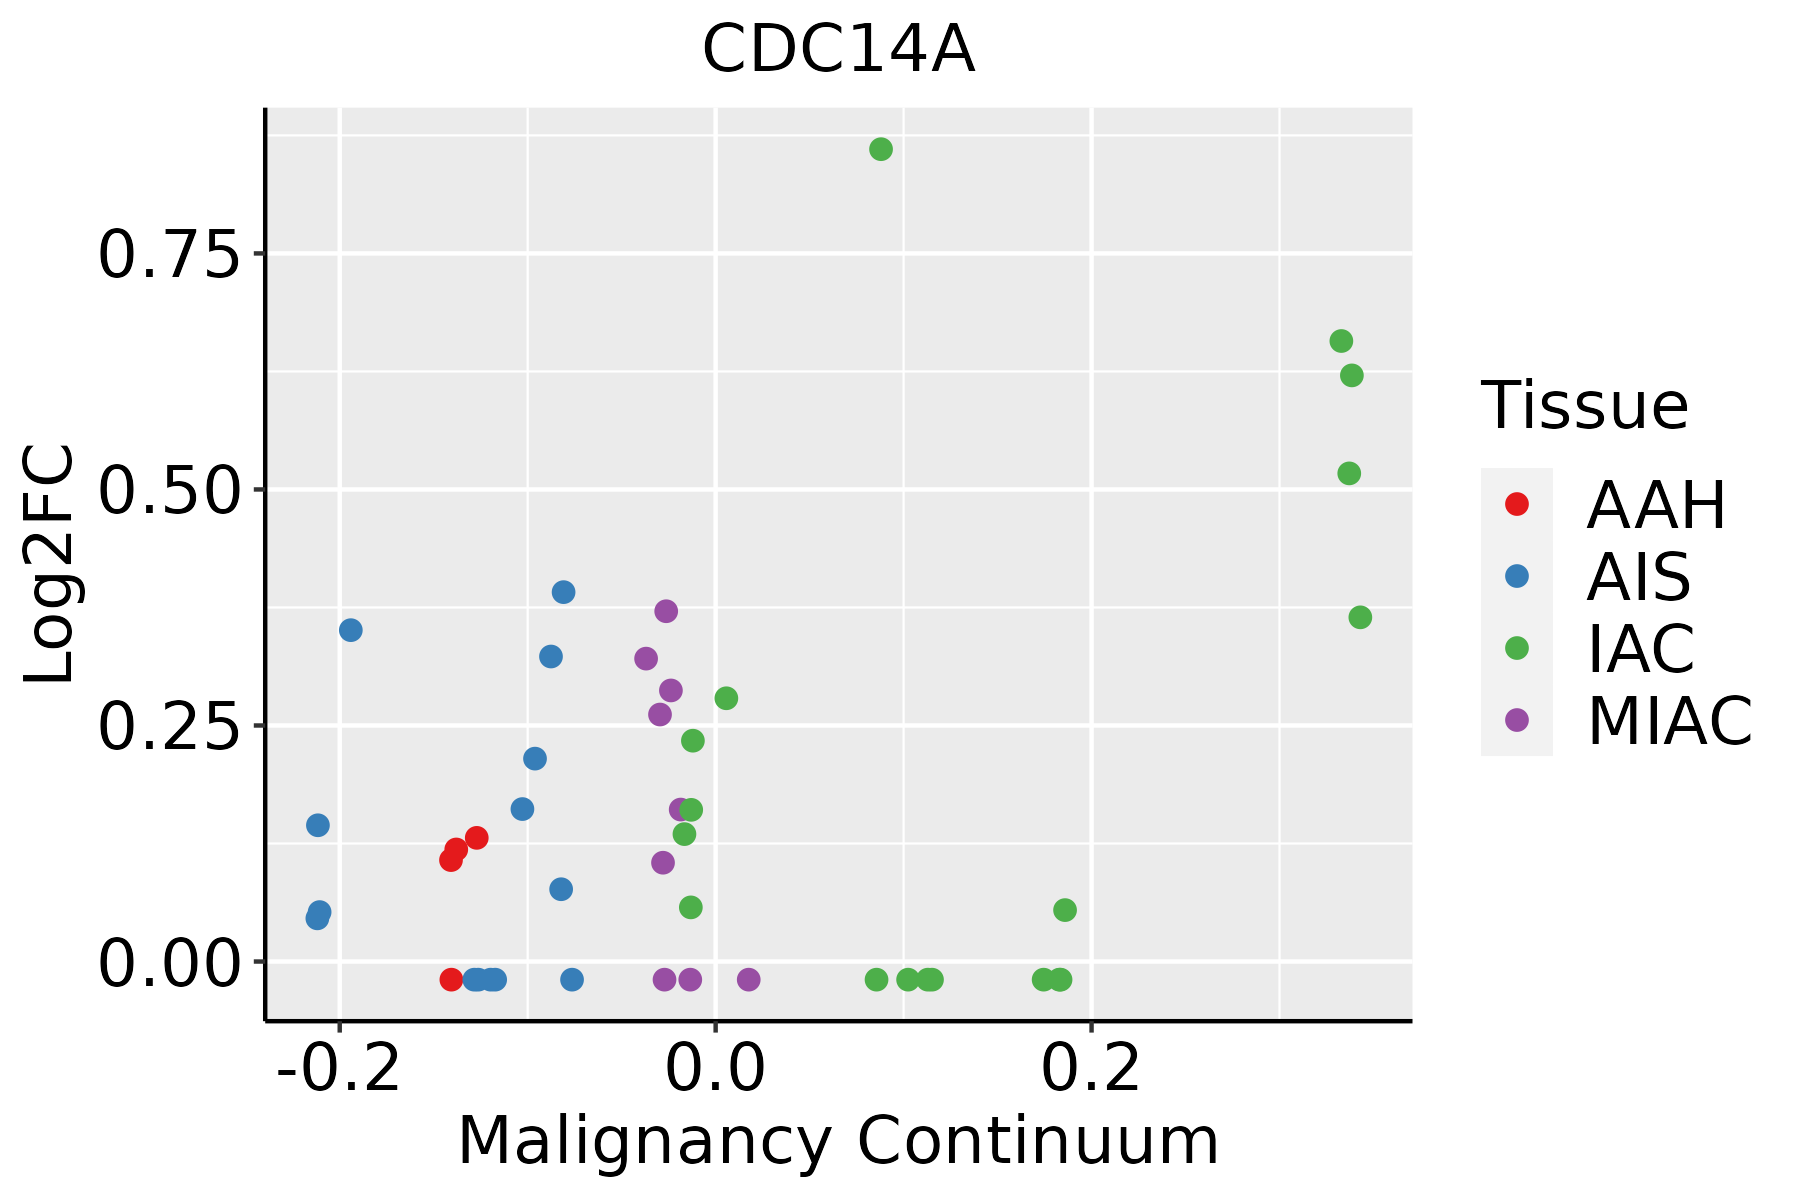 | AAH: Atypical adenomatous hyperplasia |
| AIS: Adenocarcinoma in situ | ||
| IAC: Invasive lung adenocarcinoma | ||
| MIA: Minimally invasive adenocarcinoma |
| ∗log2FC in expression of this searched gene in stem-like cells from each diseased tissue sample relative to stem-like cells in normal samples in each tissue plotted against the malignancy continuum. Samples are colored based on if they are from different disease stage. |
Top |
Malignant transformation related pathway analysis |
| Find out the enriched GO biological processes and KEGG pathways involved in transition from healthy to precancer to cancer |
| Tissue | Disease Stage | Enriched GO biological Processes |
| Colorectum | AD |  |
| Colorectum | SER |  |
| Colorectum | MSS |  |
| Colorectum | MSI-H |  |
| Colorectum | FAP |  |
| ∗Top 15 enriched GO BP terms are showed in the bar plot of each disease state in each tissue. Each row represents a significant GO biological process which is colored according to the -log10(p.adjust). |
| Page: 1 2 3 4 5 6 7 8 9 |
| GO ID | Tissue | Disease Stage | Description | Gene Ratio | Bg Ratio | pvalue | p.adjust | Count |
| GO:00009108 | Endometrium | AEH | cytokinesis | 40/2100 | 173/18723 | 6.01e-06 | 1.49e-04 | 40 |
| GO:00457877 | Endometrium | AEH | positive regulation of cell cycle | 56/2100 | 313/18723 | 2.73e-04 | 3.14e-03 | 56 |
| GO:00064709 | Endometrium | AEH | protein dephosphorylation | 50/2100 | 281/18723 | 6.41e-04 | 6.23e-03 | 50 |
| GO:00447726 | Endometrium | AEH | mitotic cell cycle phase transition | 67/2100 | 424/18723 | 2.37e-03 | 1.78e-02 | 67 |
| GO:00900686 | Endometrium | AEH | positive regulation of cell cycle process | 41/2100 | 236/18723 | 2.94e-03 | 2.09e-02 | 41 |
| GO:00513022 | Endometrium | AEH | regulation of cell division | 32/2100 | 177/18723 | 4.33e-03 | 2.86e-02 | 32 |
| GO:000091013 | Endometrium | EEC | cytokinesis | 40/2168 | 173/18723 | 1.29e-05 | 2.60e-04 | 40 |
| GO:004578713 | Endometrium | EEC | positive regulation of cell cycle | 59/2168 | 313/18723 | 1.04e-04 | 1.44e-03 | 59 |
| GO:000647013 | Endometrium | EEC | protein dephosphorylation | 51/2168 | 281/18723 | 7.38e-04 | 7.01e-03 | 51 |
| GO:004477213 | Endometrium | EEC | mitotic cell cycle phase transition | 71/2168 | 424/18723 | 8.68e-04 | 7.97e-03 | 71 |
| GO:009006812 | Endometrium | EEC | positive regulation of cell cycle process | 44/2168 | 236/18723 | 9.39e-04 | 8.42e-03 | 44 |
| GO:005130211 | Endometrium | EEC | regulation of cell division | 32/2168 | 177/18723 | 6.93e-03 | 3.98e-02 | 32 |
| GO:00073467 | Endometrium | EEC | regulation of mitotic cell cycle | 70/2168 | 457/18723 | 8.76e-03 | 4.74e-02 | 70 |
| GO:00447723 | Lung | IAC | mitotic cell cycle phase transition | 85/2061 | 424/18723 | 2.69e-08 | 3.20e-06 | 85 |
| GO:00064707 | Lung | IAC | protein dephosphorylation | 60/2061 | 281/18723 | 3.24e-07 | 2.48e-05 | 60 |
| GO:00163116 | Lung | IAC | dephosphorylation | 75/2061 | 417/18723 | 1.21e-05 | 3.64e-04 | 75 |
| GO:19019872 | Lung | IAC | regulation of cell cycle phase transition | 69/2061 | 390/18723 | 4.55e-05 | 1.06e-03 | 69 |
| GO:00073464 | Lung | IAC | regulation of mitotic cell cycle | 78/2061 | 457/18723 | 5.37e-05 | 1.21e-03 | 78 |
| GO:00457875 | Lung | IAC | positive regulation of cell cycle | 56/2061 | 313/18723 | 1.69e-04 | 3.01e-03 | 56 |
| GO:00353353 | Lung | IAC | peptidyl-tyrosine dephosphorylation | 23/2061 | 97/18723 | 2.79e-04 | 4.56e-03 | 23 |
| Page: 1 2 |
| Pathway ID | Tissue | Disease Stage | Description | Gene Ratio | Bg Ratio | pvalue | p.adjust | qvalue | Count |
| hsa041105 | Lung | IAC | Cell cycle | 30/1053 | 157/8465 | 1.03e-02 | 3.83e-02 | 2.54e-02 | 30 |
| hsa0411012 | Lung | IAC | Cell cycle | 30/1053 | 157/8465 | 1.03e-02 | 3.83e-02 | 2.54e-02 | 30 |
| Page: 1 |
Top |
Cell-cell communication analysis |
| Identification of potential cell-cell interactions between two cell types and their ligand-receptor pairs for different disease states |
| Ligand | Receptor | LRpair | Pathway | Tissue | Disease Stage |
| Page: 1 |
Top |
Single-cell gene regulatory network inference analysis |
| Find out the significant the regulons (TFs) and the target genes of each regulon across cell types for different disease states |
| TF | Cell Type | Tissue | Disease Stage | Target Gene | RSS | Regulon Activity |
| ∗The dot plots of a searched regulon are shown for all cell subpopulations in each disease state of each tissue based on the regulon specific score inferred using pySCENIC and by calculating the average expression. |
| Page: 1 |
Top |
Somatic mutation of malignant transformation related genes |
| Annotation of somatic variants for genes involved in malignant transformation |
| Hugo Symbol | Variant Class | Variant Classification | dbSNP RS | HGVSc | HGVSp | HGVSp Short | SWISSPROT | BIOTYPE | SIFT | PolyPhen | Tumor Sample Barcode | Tissue | Histology | Sex | Age | Stage | Therapy Types | Drugs | Outcome |
| CDC14A | SNV | Missense_Mutation | rs781410426 | c.1438N>T | p.Arg480Trp | p.R480W | Q9UNH5 | protein_coding | deleterious_low_confidence(0) | probably_damaging(0.985) | TCGA-AC-A8OQ-01 | Breast | breast invasive carcinoma | Female | >=65 | I/II | Unknown | Unknown | SD |
| CDC14A | SNV | Missense_Mutation | novel | c.1280N>A | p.Ala427Glu | p.A427E | Q9UNH5 | protein_coding | deleterious(0.05) | benign(0.156) | TCGA-D8-A1XL-01 | Breast | breast invasive carcinoma | Female | <65 | I/II | Chemotherapy | doxorubicine+cyclophosphamide+tamoxifen | SD |
| CDC14A | SNV | Missense_Mutation | c.506A>G | p.Tyr169Cys | p.Y169C | Q9UNH5 | protein_coding | deleterious(0) | probably_damaging(0.992) | TCGA-IR-A3LF-01 | Cervix | cervical & endocervical cancer | Female | <65 | I/II | Unknown | Unknown | SD | |
| CDC14A | SNV | Missense_Mutation | c.864G>T | p.Leu288Phe | p.L288F | Q9UNH5 | protein_coding | deleterious(0) | probably_damaging(0.971) | TCGA-IR-A3LK-01 | Cervix | cervical & endocervical cancer | Female | >=65 | I/II | Chemotherapy | cisplatin | PD | |
| CDC14A | SNV | Missense_Mutation | c.1070N>G | p.Ser357Cys | p.S357C | Q9UNH5 | protein_coding | tolerated(0.07) | benign(0.112) | TCGA-WL-A834-01 | Cervix | cervical & endocervical cancer | Female | <65 | I/II | Chemotherapy | paclitaxel | SD | |
| CDC14A | SNV | Missense_Mutation | novel | c.1221G>T | p.Gln407His | p.Q407H | Q9UNH5 | protein_coding | tolerated(0.17) | benign(0.02) | TCGA-AA-3949-01 | Colorectum | colon adenocarcinoma | Female | >=65 | III/IV | Unknown | Unknown | SD |
| CDC14A | SNV | Missense_Mutation | rs371468460 | c.622N>A | p.Ala208Thr | p.A208T | Q9UNH5 | protein_coding | deleterious(0.03) | possibly_damaging(0.66) | TCGA-AA-3984-01 | Colorectum | colon adenocarcinoma | Female | <65 | I/II | Unknown | Unknown | SD |
| CDC14A | SNV | Missense_Mutation | novel | c.650A>C | p.Lys217Thr | p.K217T | Q9UNH5 | protein_coding | deleterious(0) | benign(0.122) | TCGA-AA-A00N-01 | Colorectum | colon adenocarcinoma | Male | >=65 | I/II | Unknown | Unknown | PD |
| CDC14A | SNV | Missense_Mutation | novel | c.560A>C | p.Lys187Thr | p.K187T | Q9UNH5 | protein_coding | deleterious(0) | probably_damaging(0.994) | TCGA-AZ-4315-01 | Colorectum | colon adenocarcinoma | Male | <65 | I/II | Unknown | Unknown | SD |
| CDC14A | SNV | Missense_Mutation | novel | c.895N>C | p.Phe299Leu | p.F299L | Q9UNH5 | protein_coding | tolerated(0.26) | benign(0.038) | TCGA-CA-6717-01 | Colorectum | colon adenocarcinoma | Male | <65 | I/II | Chemotherapy | oxaliplatin | CR |
| Page: 1 2 3 4 5 6 7 |
Top |
Related drugs of malignant transformation related genes |
| Identification of chemicals and drugs interact with genes involved in malignant transfromation |
| (DGIdb 4.0) |
| Entrez ID | Symbol | Category | Interaction Types | Drug Claim Name | Drug Name | PMIDs |
| Page: 1 |

Copyright 2023-Present -The University of Texas Health Science Center at Houston |