
|
|||||
|
 | |
| |
| |
| |
| |
| |
|
Gene: CDC123 |
Gene summary for CDC123 |
| Gene information | Species | Human | Gene symbol | CDC123 | Gene ID | 8872 |
| Gene name | cell division cycle 123 | |
| Gene Alias | C10orf7 | |
| Cytomap | 10p14-p13 | |
| Gene Type | protein-coding | GO ID | GO:0006412 | UniProtAcc | O75794 |
Top |
Malignant transformation analysis |
| Identification of the aberrant gene expression in precancerous and cancerous lesions by comparing the gene expression of stem-like cells in diseased tissues with normal stem cells |
| Entrez ID | Symbol | Replicates | Species | Organ | Tissue | Adj P-value | Log2FC | Malignancy |
| 8872 | CDC123 | HTA11_1938_2000001011 | Human | Colorectum | AD | 1.68e-06 | 4.58e-01 | -0.0811 |
| 8872 | CDC123 | HTA11_347_2000001011 | Human | Colorectum | AD | 3.18e-09 | 3.66e-01 | -0.1954 |
| 8872 | CDC123 | HTA11_1391_2000001011 | Human | Colorectum | AD | 1.28e-07 | 4.48e-01 | -0.059 |
| 8872 | CDC123 | HTA11_99999965104_69814 | Human | Colorectum | MSS | 7.18e-05 | 3.67e-01 | 0.281 |
| 8872 | CDC123 | HTA11_99999971662_82457 | Human | Colorectum | MSS | 1.39e-09 | 5.66e-01 | 0.3859 |
| 8872 | CDC123 | A015-C-203 | Human | Colorectum | FAP | 2.64e-09 | -1.76e-01 | -0.1294 |
| 8872 | CDC123 | A002-C-203 | Human | Colorectum | FAP | 1.72e-02 | -1.10e-01 | 0.2786 |
| 8872 | CDC123 | A001-C-108 | Human | Colorectum | FAP | 7.48e-05 | -1.34e-01 | -0.0272 |
| 8872 | CDC123 | A002-C-205 | Human | Colorectum | FAP | 3.46e-05 | -2.35e-01 | -0.1236 |
| 8872 | CDC123 | A015-C-006 | Human | Colorectum | FAP | 3.04e-02 | -6.59e-02 | -0.0994 |
| 8872 | CDC123 | A015-C-106 | Human | Colorectum | FAP | 1.39e-02 | -1.15e-01 | -0.0511 |
| 8872 | CDC123 | A002-C-114 | Human | Colorectum | FAP | 1.65e-03 | -2.03e-01 | -0.1561 |
| 8872 | CDC123 | A015-C-104 | Human | Colorectum | FAP | 4.19e-09 | -1.96e-01 | -0.1899 |
| 8872 | CDC123 | A002-C-016 | Human | Colorectum | FAP | 5.32e-06 | -1.45e-01 | 0.0521 |
| 8872 | CDC123 | A001-C-203 | Human | Colorectum | FAP | 2.95e-03 | -1.19e-01 | -0.0481 |
| 8872 | CDC123 | A002-C-116 | Human | Colorectum | FAP | 5.09e-10 | -2.12e-01 | -0.0452 |
| 8872 | CDC123 | A018-E-020 | Human | Colorectum | FAP | 1.36e-03 | -1.97e-01 | -0.2034 |
| 8872 | CDC123 | F034 | Human | Colorectum | FAP | 4.35e-08 | -2.18e-01 | -0.0665 |
| 8872 | CDC123 | LZE3D | Human | Esophagus | HGIN | 5.29e-03 | 4.23e-01 | 0.0668 |
| 8872 | CDC123 | LZE4T | Human | Esophagus | ESCC | 3.99e-12 | 4.38e-01 | 0.0811 |
| Page: 1 2 3 4 5 6 7 8 |
| Tissue | Expression Dynamics | Abbreviation |
| Colorectum (GSE201348) |  | FAP: Familial adenomatous polyposis |
| CRC: Colorectal cancer | ||
| Colorectum (HTA11) |  | AD: Adenomas |
| SER: Sessile serrated lesions | ||
| MSI-H: Microsatellite-high colorectal cancer | ||
| MSS: Microsatellite stable colorectal cancer | ||
| Esophagus |  | ESCC: Esophageal squamous cell carcinoma |
| HGIN: High-grade intraepithelial neoplasias | ||
| LGIN: Low-grade intraepithelial neoplasias | ||
| Liver | 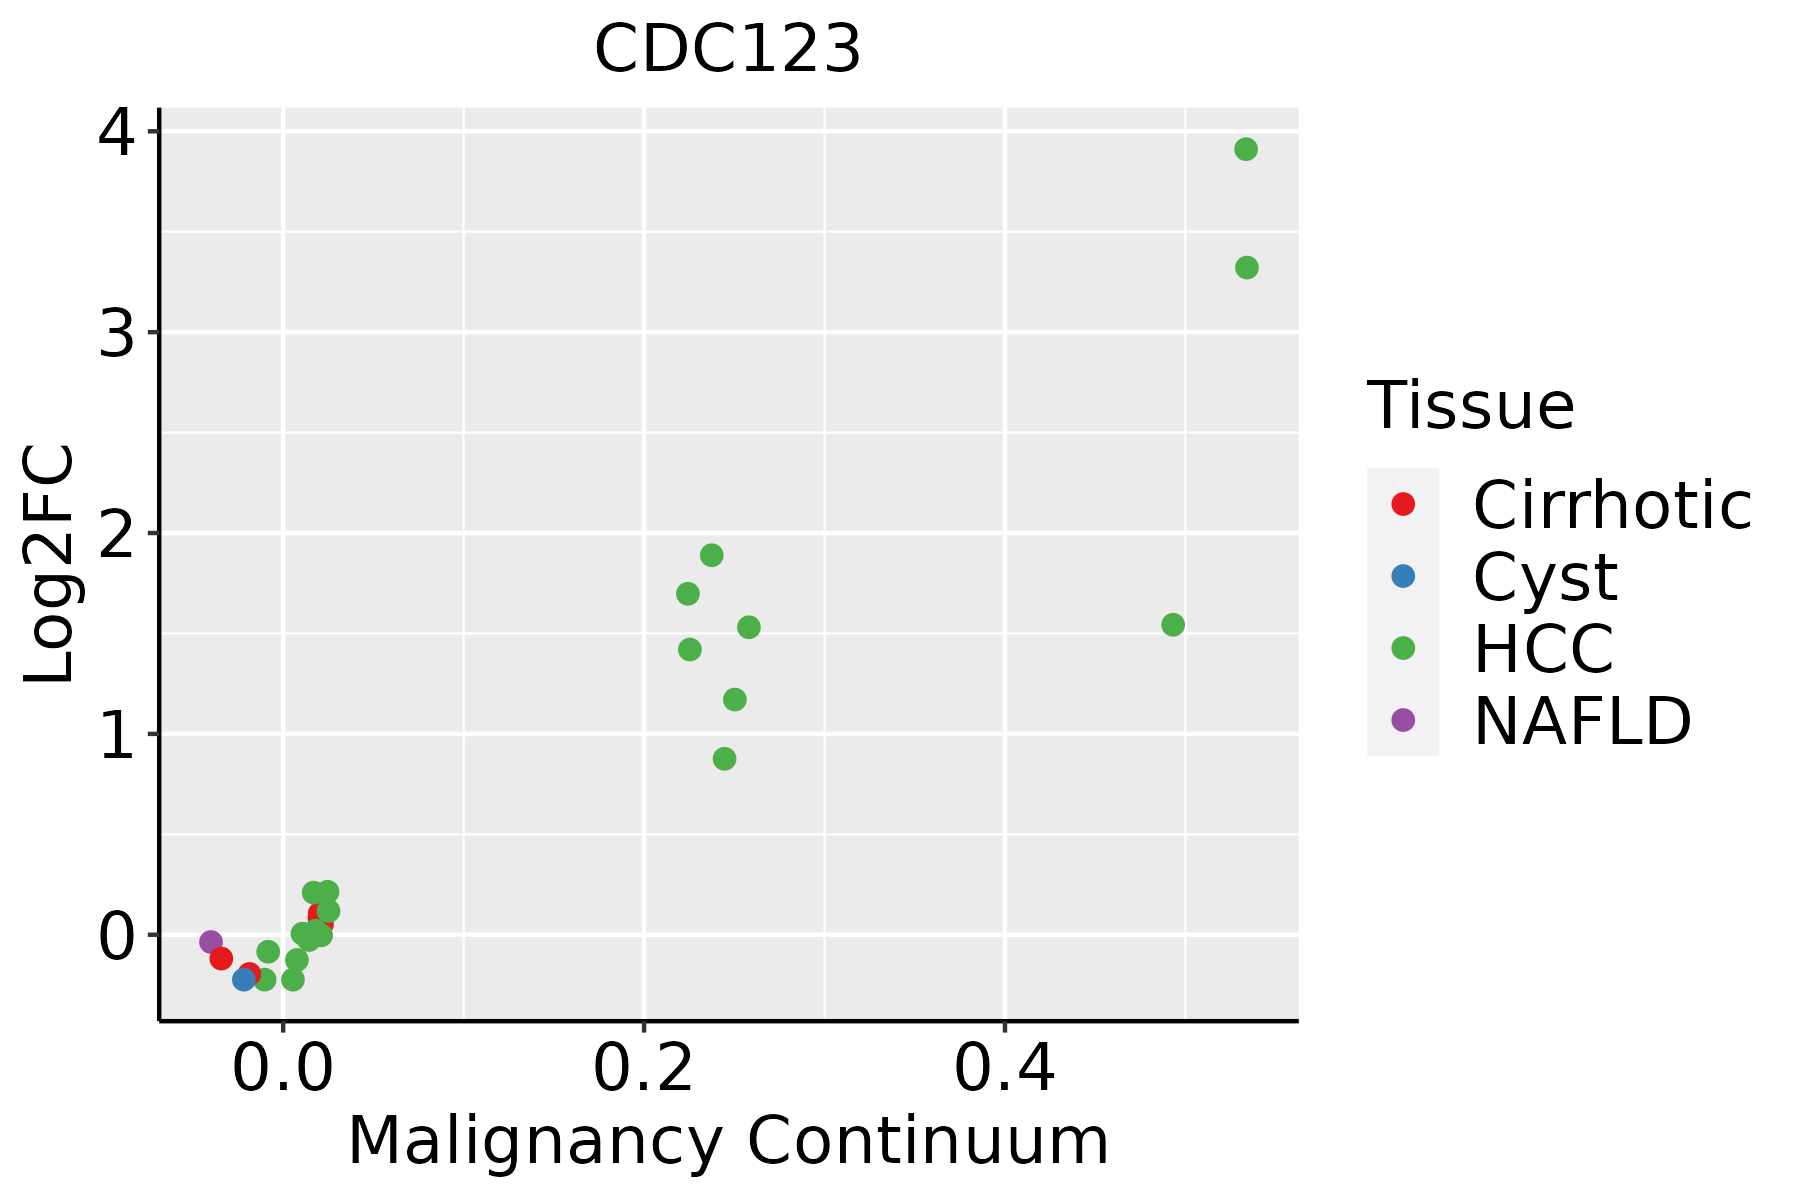 | HCC: Hepatocellular carcinoma |
| NAFLD: Non-alcoholic fatty liver disease | ||
| Oral Cavity | 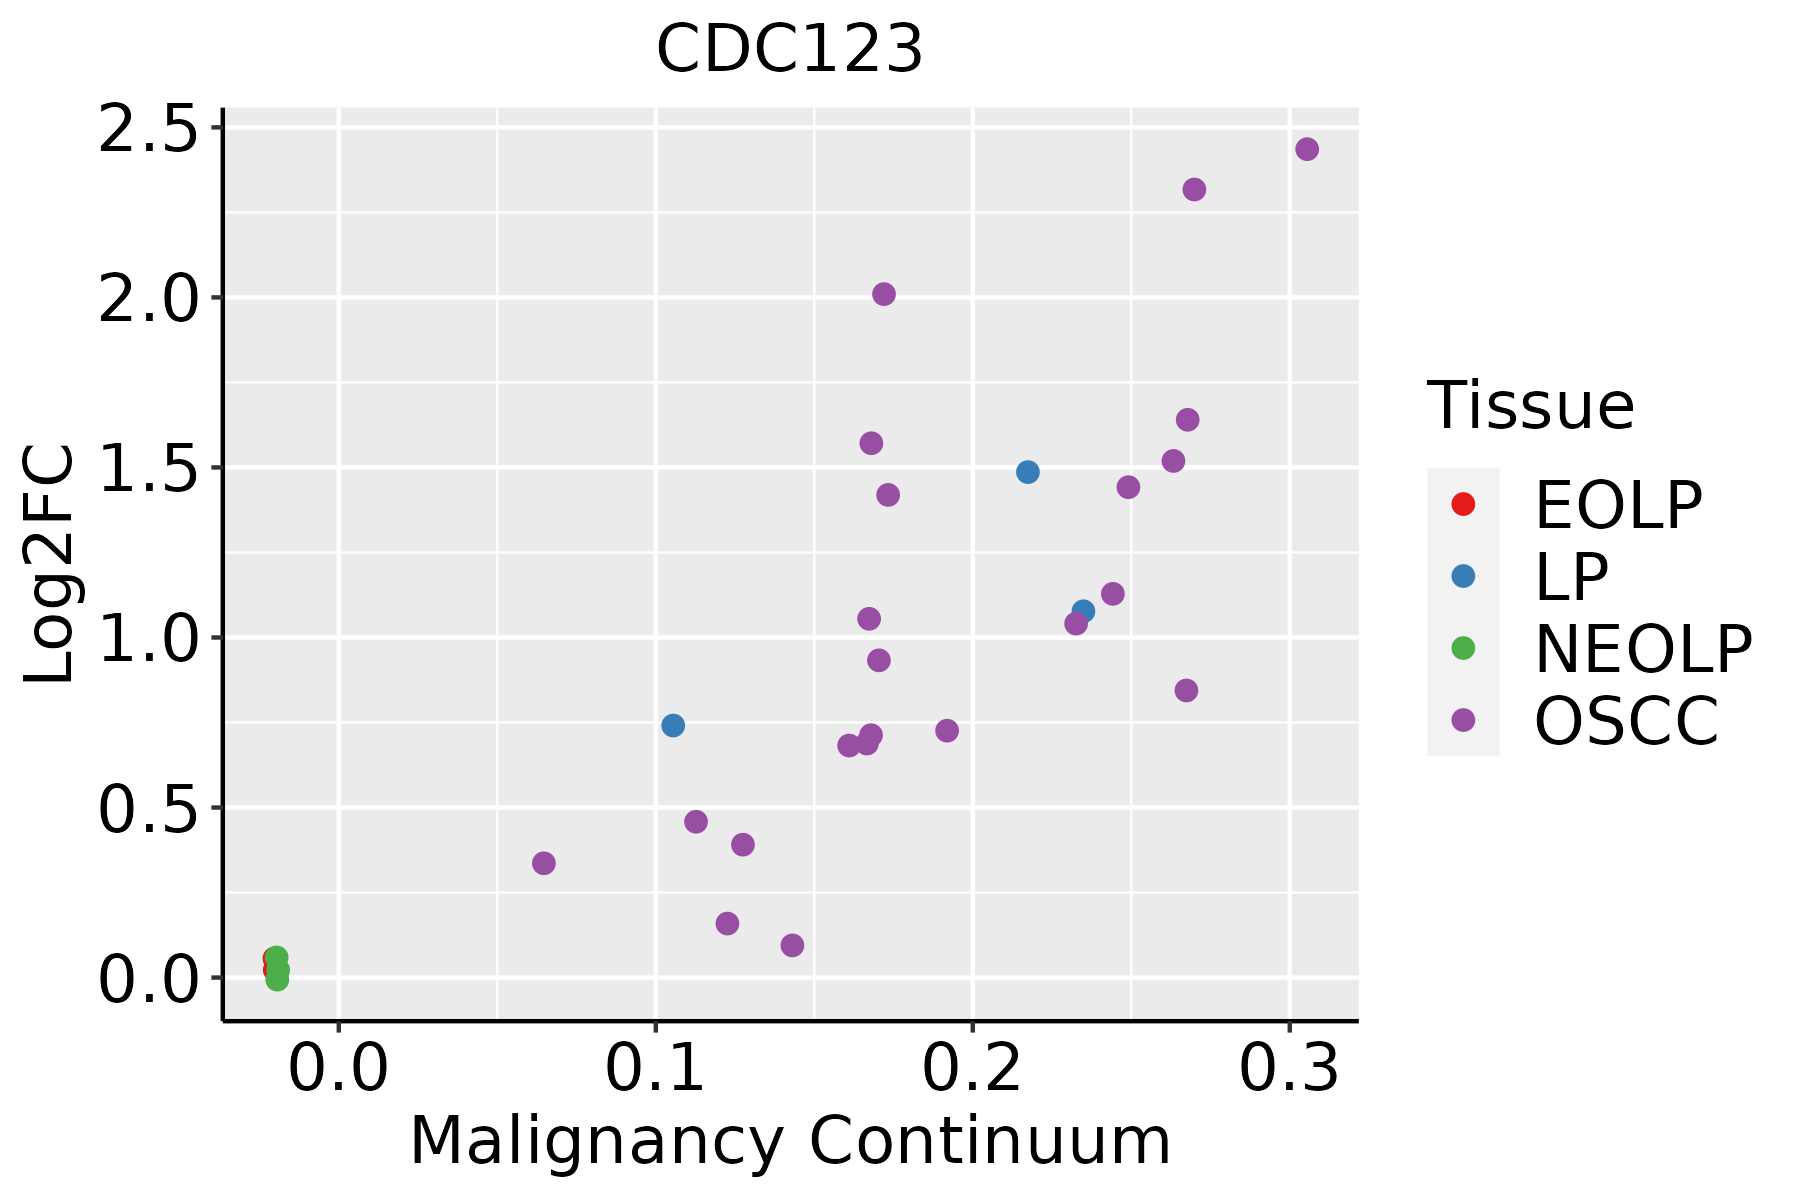 | EOLP: Erosive Oral lichen planus |
| LP: leukoplakia | ||
| NEOLP: Non-erosive oral lichen planus | ||
| OSCC: Oral squamous cell carcinoma | ||
| Skin | 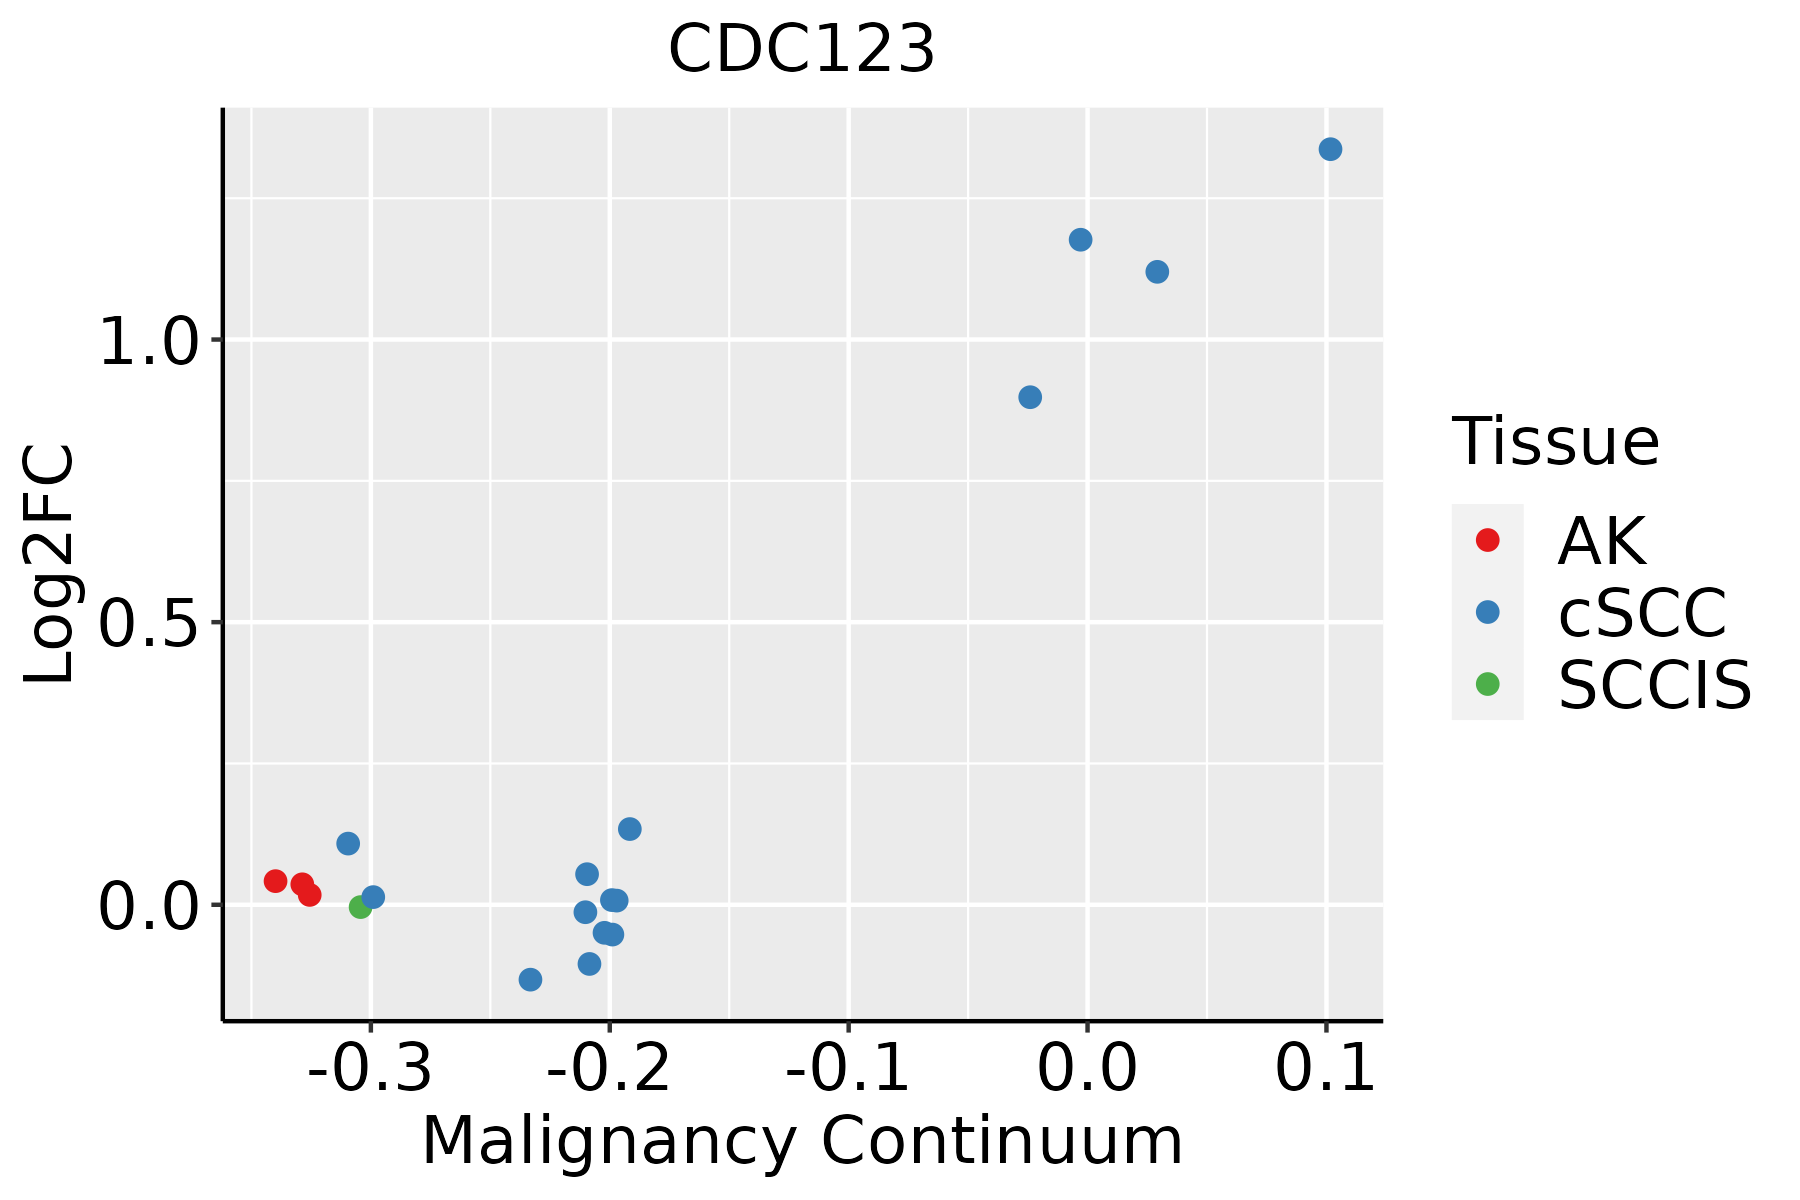 | AK: Actinic keratosis |
| cSCC: Cutaneous squamous cell carcinoma | ||
| SCCIS:squamous cell carcinoma in situ | ||
| Thyroid | 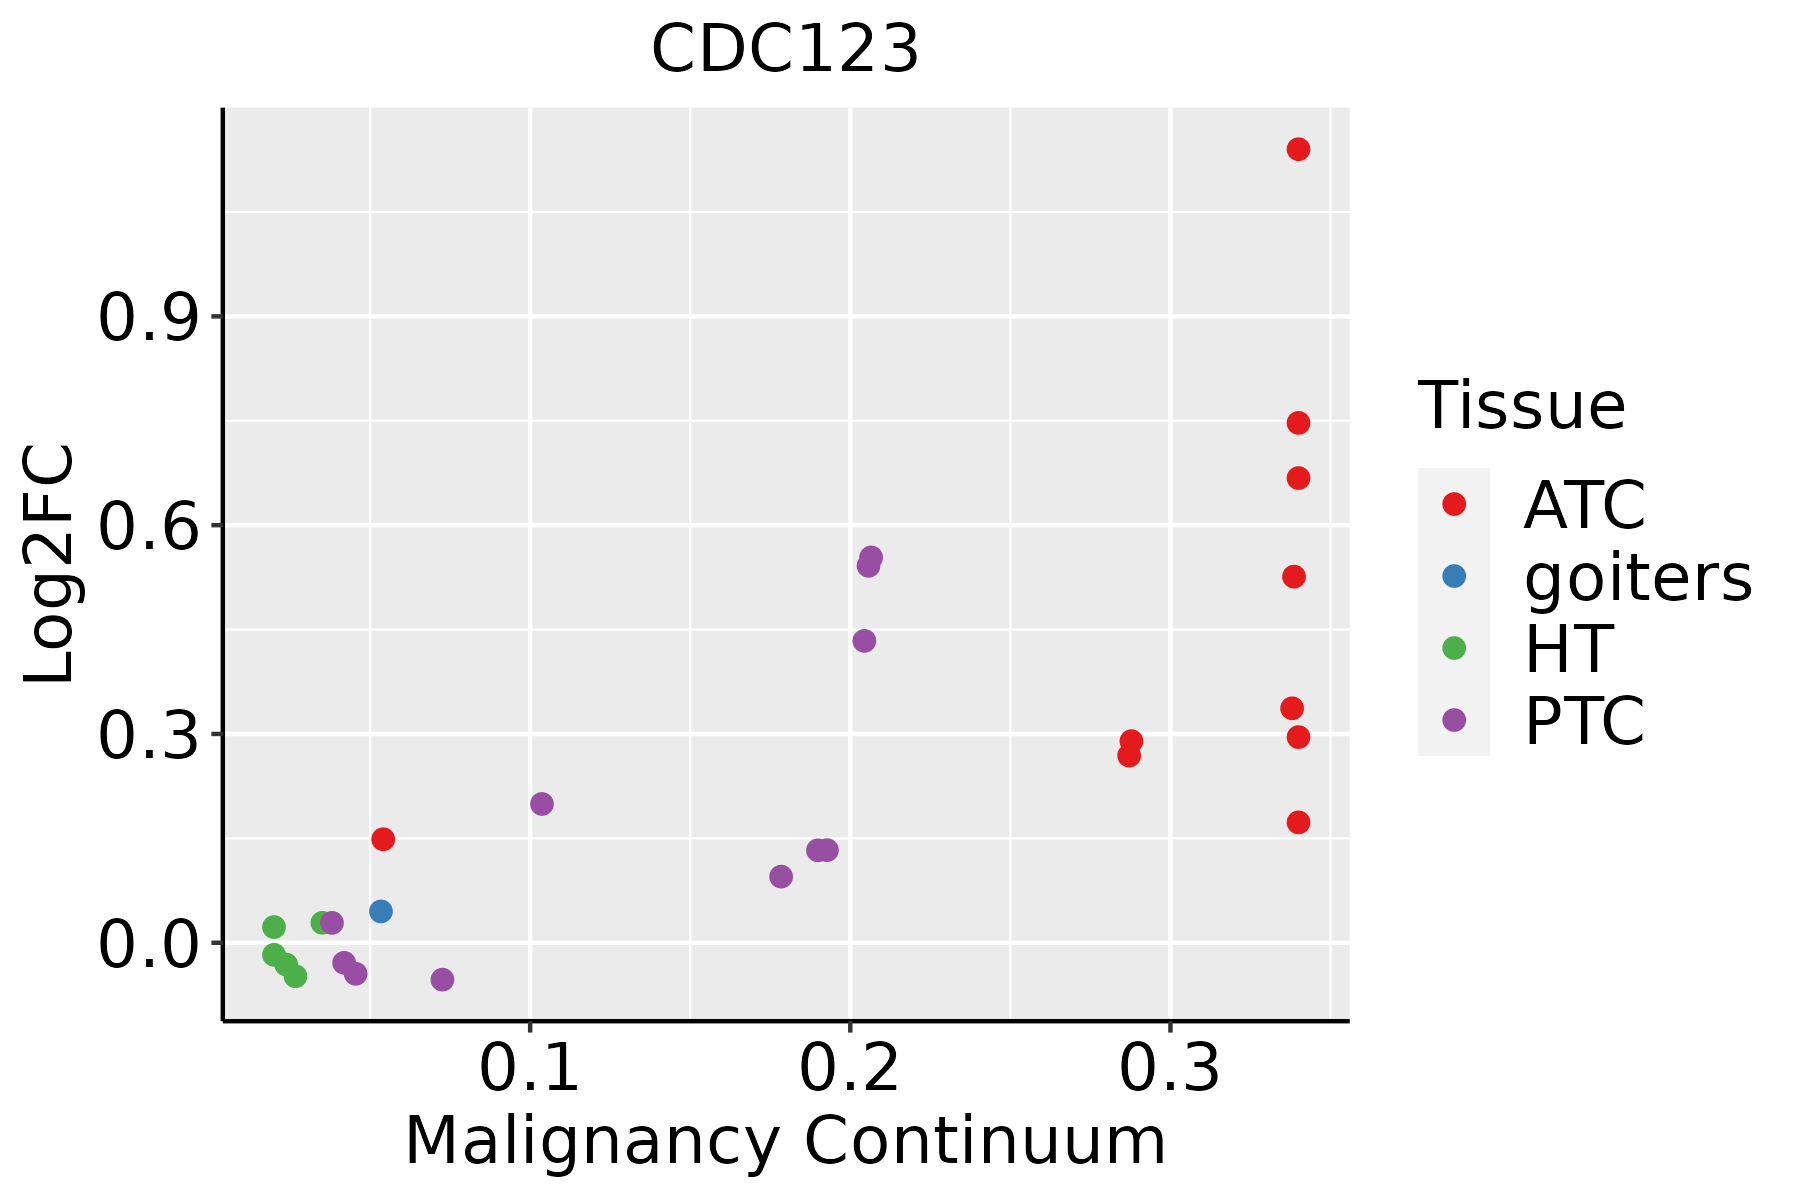 | ATC: Anaplastic thyroid cancer |
| HT: Hashimoto's thyroiditis | ||
| PTC: Papillary thyroid cancer |
| ∗log2FC in expression of this searched gene in stem-like cells from each diseased tissue sample relative to stem-like cells in normal samples in each tissue plotted against the malignancy continuum. Samples are colored based on if they are from different disease stage. |
Top |
Malignant transformation related pathway analysis |
| Find out the enriched GO biological processes and KEGG pathways involved in transition from healthy to precancer to cancer |
| Tissue | Disease Stage | Enriched GO biological Processes |
| Colorectum | AD |  |
| Colorectum | SER |  |
| Colorectum | MSS |  |
| Colorectum | MSI-H |  |
| Colorectum | FAP |  |
| ∗Top 15 enriched GO BP terms are showed in the bar plot of each disease state in each tissue. Each row represents a significant GO biological process which is colored according to the -log10(p.adjust). |
| Page: 1 2 3 4 5 6 7 8 9 |
| GO ID | Tissue | Disease Stage | Description | Gene Ratio | Bg Ratio | pvalue | p.adjust | Count |
| GO:0006417 | Colorectum | AD | regulation of translation | 141/3918 | 468/18723 | 1.32e-06 | 4.22e-05 | 141 |
| GO:0006413 | Colorectum | AD | translational initiation | 45/3918 | 118/18723 | 1.35e-05 | 2.92e-04 | 45 |
| GO:0034250 | Colorectum | AD | positive regulation of cellular amide metabolic process | 53/3918 | 162/18723 | 2.98e-04 | 3.60e-03 | 53 |
| GO:0045727 | Colorectum | AD | positive regulation of translation | 45/3918 | 136/18723 | 6.24e-04 | 6.48e-03 | 45 |
| GO:0006446 | Colorectum | AD | regulation of translational initiation | 28/3918 | 79/18723 | 2.02e-03 | 1.63e-02 | 28 |
| GO:00064172 | Colorectum | MSS | regulation of translation | 134/3467 | 468/18723 | 4.43e-08 | 2.38e-06 | 134 |
| GO:00064132 | Colorectum | MSS | translational initiation | 43/3467 | 118/18723 | 3.19e-06 | 9.38e-05 | 43 |
| GO:00342502 | Colorectum | MSS | positive regulation of cellular amide metabolic process | 51/3467 | 162/18723 | 4.70e-05 | 8.60e-04 | 51 |
| GO:00457272 | Colorectum | MSS | positive regulation of translation | 43/3467 | 136/18723 | 1.60e-04 | 2.29e-03 | 43 |
| GO:00064461 | Colorectum | MSS | regulation of translational initiation | 26/3467 | 79/18723 | 1.56e-03 | 1.42e-02 | 26 |
| GO:00064174 | Colorectum | FAP | regulation of translation | 111/2622 | 468/18723 | 8.47e-09 | 1.13e-06 | 111 |
| GO:00064463 | Colorectum | FAP | regulation of translational initiation | 26/2622 | 79/18723 | 1.54e-05 | 4.01e-04 | 26 |
| GO:00064134 | Colorectum | FAP | translational initiation | 34/2622 | 118/18723 | 2.13e-05 | 5.12e-04 | 34 |
| GO:00342504 | Colorectum | FAP | positive regulation of cellular amide metabolic process | 39/2622 | 162/18723 | 4.02e-04 | 4.86e-03 | 39 |
| GO:00457274 | Colorectum | FAP | positive regulation of translation | 34/2622 | 136/18723 | 4.43e-04 | 5.25e-03 | 34 |
| GO:000641727 | Esophagus | HGIN | regulation of translation | 139/2587 | 468/18723 | 1.46e-19 | 7.98e-17 | 139 |
| GO:000641320 | Esophagus | HGIN | translational initiation | 55/2587 | 118/18723 | 7.33e-18 | 2.31e-15 | 55 |
| GO:004572720 | Esophagus | HGIN | positive regulation of translation | 49/2587 | 136/18723 | 5.88e-11 | 6.30e-09 | 49 |
| GO:000644610 | Esophagus | HGIN | regulation of translational initiation | 34/2587 | 79/18723 | 2.09e-10 | 1.97e-08 | 34 |
| GO:003425020 | Esophagus | HGIN | positive regulation of cellular amide metabolic process | 53/2587 | 162/18723 | 6.01e-10 | 5.15e-08 | 53 |
| Page: 1 2 3 4 |
| Pathway ID | Tissue | Disease Stage | Description | Gene Ratio | Bg Ratio | pvalue | p.adjust | qvalue | Count |
| Page: 1 |
Top |
Cell-cell communication analysis |
| Identification of potential cell-cell interactions between two cell types and their ligand-receptor pairs for different disease states |
| Ligand | Receptor | LRpair | Pathway | Tissue | Disease Stage |
| Page: 1 |
Top |
Single-cell gene regulatory network inference analysis |
| Find out the significant the regulons (TFs) and the target genes of each regulon across cell types for different disease states |
| TF | Cell Type | Tissue | Disease Stage | Target Gene | RSS | Regulon Activity |
| ∗The dot plots of a searched regulon are shown for all cell subpopulations in each disease state of each tissue based on the regulon specific score inferred using pySCENIC and by calculating the average expression. |
| Page: 1 |
Top |
Somatic mutation of malignant transformation related genes |
| Annotation of somatic variants for genes involved in malignant transformation |
| Hugo Symbol | Variant Class | Variant Classification | dbSNP RS | HGVSc | HGVSp | HGVSp Short | SWISSPROT | BIOTYPE | SIFT | PolyPhen | Tumor Sample Barcode | Tissue | Histology | Sex | Age | Stage | Therapy Types | Drugs | Outcome |
| CDC123 | SNV | Missense_Mutation | rs770706077 | c.941N>T | p.Ser314Phe | p.S314F | O75794 | protein_coding | deleterious(0) | probably_damaging(0.954) | TCGA-C8-A12T-01 | Breast | breast invasive carcinoma | Female | <65 | I/II | Unknown | Unknown | SD |
| CDC123 | SNV | Missense_Mutation | rs752610319 | c.425N>A | p.Arg142His | p.R142H | O75794 | protein_coding | tolerated(1) | benign(0) | TCGA-C8-A27A-01 | Breast | breast invasive carcinoma | Female | <65 | I/II | Chemotherapy | 5-fluorouracil | CR |
| CDC123 | SNV | Missense_Mutation | novel | c.953N>G | p.Asp318Gly | p.D318G | O75794 | protein_coding | deleterious(0) | possibly_damaging(0.463) | TCGA-UC-A7PG-06 | Cervix | cervical & endocervical cancer | Female | <65 | III/IV | Chemotherapy | cisplatin | PD |
| CDC123 | SNV | Missense_Mutation | novel | c.151N>A | p.Asp51Asn | p.D51N | O75794 | protein_coding | tolerated(0.47) | benign(0.003) | TCGA-ZJ-A8QO-01 | Cervix | cervical & endocervical cancer | Female | >=65 | I/II | Unknown | Unknown | SD |
| CDC123 | SNV | Missense_Mutation | novel | c.892N>T | p.Pro298Ser | p.P298S | O75794 | protein_coding | tolerated(0.08) | probably_damaging(0.936) | TCGA-AA-3950-01 | Colorectum | colon adenocarcinoma | Female | >=65 | I/II | Unknown | Unknown | SD |
| CDC123 | SNV | Missense_Mutation | novel | c.675N>A | p.Phe225Leu | p.F225L | O75794 | protein_coding | deleterious(0) | probably_damaging(0.998) | TCGA-CA-6717-01 | Colorectum | colon adenocarcinoma | Male | <65 | I/II | Chemotherapy | oxaliplatin | CR |
| CDC123 | SNV | Missense_Mutation | c.989N>T | p.Arg330Ile | p.R330I | O75794 | protein_coding | tolerated(0.26) | benign(0.113) | TCGA-AG-A002-01 | Colorectum | rectum adenocarcinoma | Male | <65 | I/II | Unknown | Unknown | SD | |
| CDC123 | SNV | Missense_Mutation | novel | c.289N>A | p.Leu97Ile | p.L97I | O75794 | protein_coding | deleterious(0.01) | probably_damaging(0.992) | TCGA-AP-A1DR-01 | Endometrium | uterine corpus endometrioid carcinoma | Female | <65 | III/IV | Chemotherapy | cisplatin | SD |
| CDC123 | SNV | Missense_Mutation | novel | c.975N>A | p.Phe325Leu | p.F325L | O75794 | protein_coding | tolerated(0.34) | benign(0.007) | TCGA-AX-A05Z-01 | Endometrium | uterine corpus endometrioid carcinoma | Female | <65 | III/IV | Chemotherapy | adriamycin | SD |
| CDC123 | SNV | Missense_Mutation | novel | c.608N>G | p.Ser203Cys | p.S203C | O75794 | protein_coding | tolerated(0.17) | possibly_damaging(0.855) | TCGA-AX-A2IO-01 | Endometrium | uterine corpus endometrioid carcinoma | Female | >=65 | I/II | Chemotherapy | carboplatin | SD |
| Page: 1 2 3 |
Top |
Related drugs of malignant transformation related genes |
| Identification of chemicals and drugs interact with genes involved in malignant transfromation |
| (DGIdb 4.0) |
| Entrez ID | Symbol | Category | Interaction Types | Drug Claim Name | Drug Name | PMIDs |
| Page: 1 |

Copyright 2023-Present -The University of Texas Health Science Center at Houston |