
|
|||||
|
 | |
| |
| |
| |
| |
| |
|
Gene: CDADC1 |
Gene summary for CDADC1 |
| Gene information | Species | Human | Gene symbol | CDADC1 | Gene ID | 81602 |
| Gene name | cytidine and dCMP deaminase domain containing 1 | |
| Gene Alias | NYD-SP15 | |
| Cytomap | 13q14.2 | |
| Gene Type | protein-coding | GO ID | GO:0006139 | UniProtAcc | Q9BWV3 |
Top |
Malignant transformation analysis |
| Identification of the aberrant gene expression in precancerous and cancerous lesions by comparing the gene expression of stem-like cells in diseased tissues with normal stem cells |
| Entrez ID | Symbol | Replicates | Species | Organ | Tissue | Adj P-value | Log2FC | Malignancy |
| 81602 | CDADC1 | LZE4T | Human | Esophagus | ESCC | 3.68e-04 | 9.51e-02 | 0.0811 |
| 81602 | CDADC1 | LZE20T | Human | Esophagus | ESCC | 7.31e-04 | 1.18e-01 | 0.0662 |
| 81602 | CDADC1 | LZE21T | Human | Esophagus | ESCC | 3.85e-03 | 1.36e-01 | 0.0655 |
| 81602 | CDADC1 | P2T-E | Human | Esophagus | ESCC | 2.59e-15 | 2.82e-01 | 0.1177 |
| 81602 | CDADC1 | P4T-E | Human | Esophagus | ESCC | 6.87e-09 | 1.03e-01 | 0.1323 |
| 81602 | CDADC1 | P5T-E | Human | Esophagus | ESCC | 1.01e-04 | 7.03e-02 | 0.1327 |
| 81602 | CDADC1 | P8T-E | Human | Esophagus | ESCC | 1.15e-14 | 1.79e-01 | 0.0889 |
| 81602 | CDADC1 | P9T-E | Human | Esophagus | ESCC | 2.62e-09 | 1.09e-01 | 0.1131 |
| 81602 | CDADC1 | P10T-E | Human | Esophagus | ESCC | 2.73e-16 | 2.64e-01 | 0.116 |
| 81602 | CDADC1 | P11T-E | Human | Esophagus | ESCC | 4.01e-11 | 3.29e-01 | 0.1426 |
| 81602 | CDADC1 | P12T-E | Human | Esophagus | ESCC | 1.12e-16 | 2.15e-01 | 0.1122 |
| 81602 | CDADC1 | P15T-E | Human | Esophagus | ESCC | 9.71e-10 | 1.34e-01 | 0.1149 |
| 81602 | CDADC1 | P16T-E | Human | Esophagus | ESCC | 3.77e-18 | 2.86e-01 | 0.1153 |
| 81602 | CDADC1 | P17T-E | Human | Esophagus | ESCC | 2.50e-04 | 1.44e-01 | 0.1278 |
| 81602 | CDADC1 | P20T-E | Human | Esophagus | ESCC | 4.11e-10 | 1.31e-01 | 0.1124 |
| 81602 | CDADC1 | P21T-E | Human | Esophagus | ESCC | 1.09e-09 | 1.29e-01 | 0.1617 |
| 81602 | CDADC1 | P22T-E | Human | Esophagus | ESCC | 8.06e-10 | 8.97e-02 | 0.1236 |
| 81602 | CDADC1 | P23T-E | Human | Esophagus | ESCC | 1.70e-06 | 8.72e-02 | 0.108 |
| 81602 | CDADC1 | P24T-E | Human | Esophagus | ESCC | 2.55e-12 | 1.77e-01 | 0.1287 |
| 81602 | CDADC1 | P26T-E | Human | Esophagus | ESCC | 1.48e-13 | 1.60e-01 | 0.1276 |
| Page: 1 2 3 4 |
| Tissue | Expression Dynamics | Abbreviation |
| Esophagus | 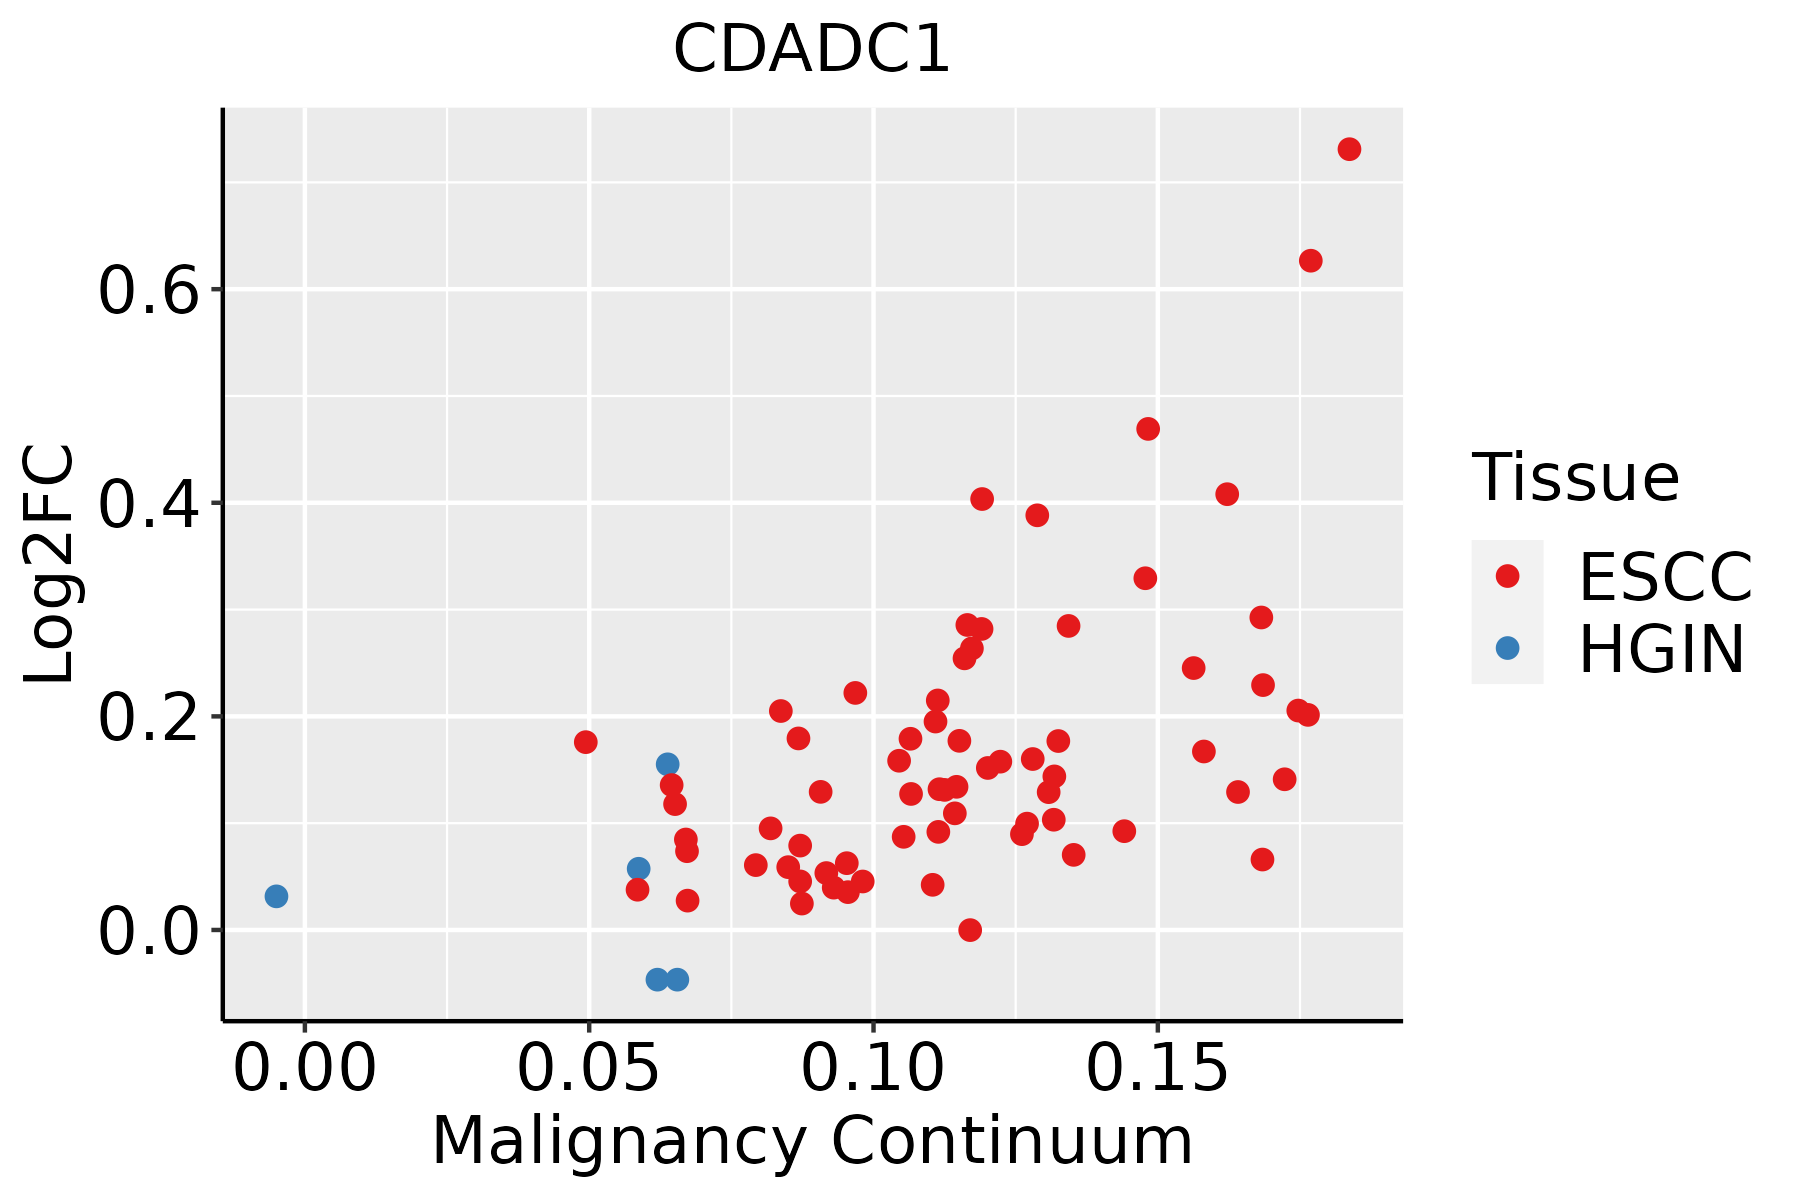 | ESCC: Esophageal squamous cell carcinoma |
| HGIN: High-grade intraepithelial neoplasias | ||
| LGIN: Low-grade intraepithelial neoplasias | ||
| Oral Cavity | 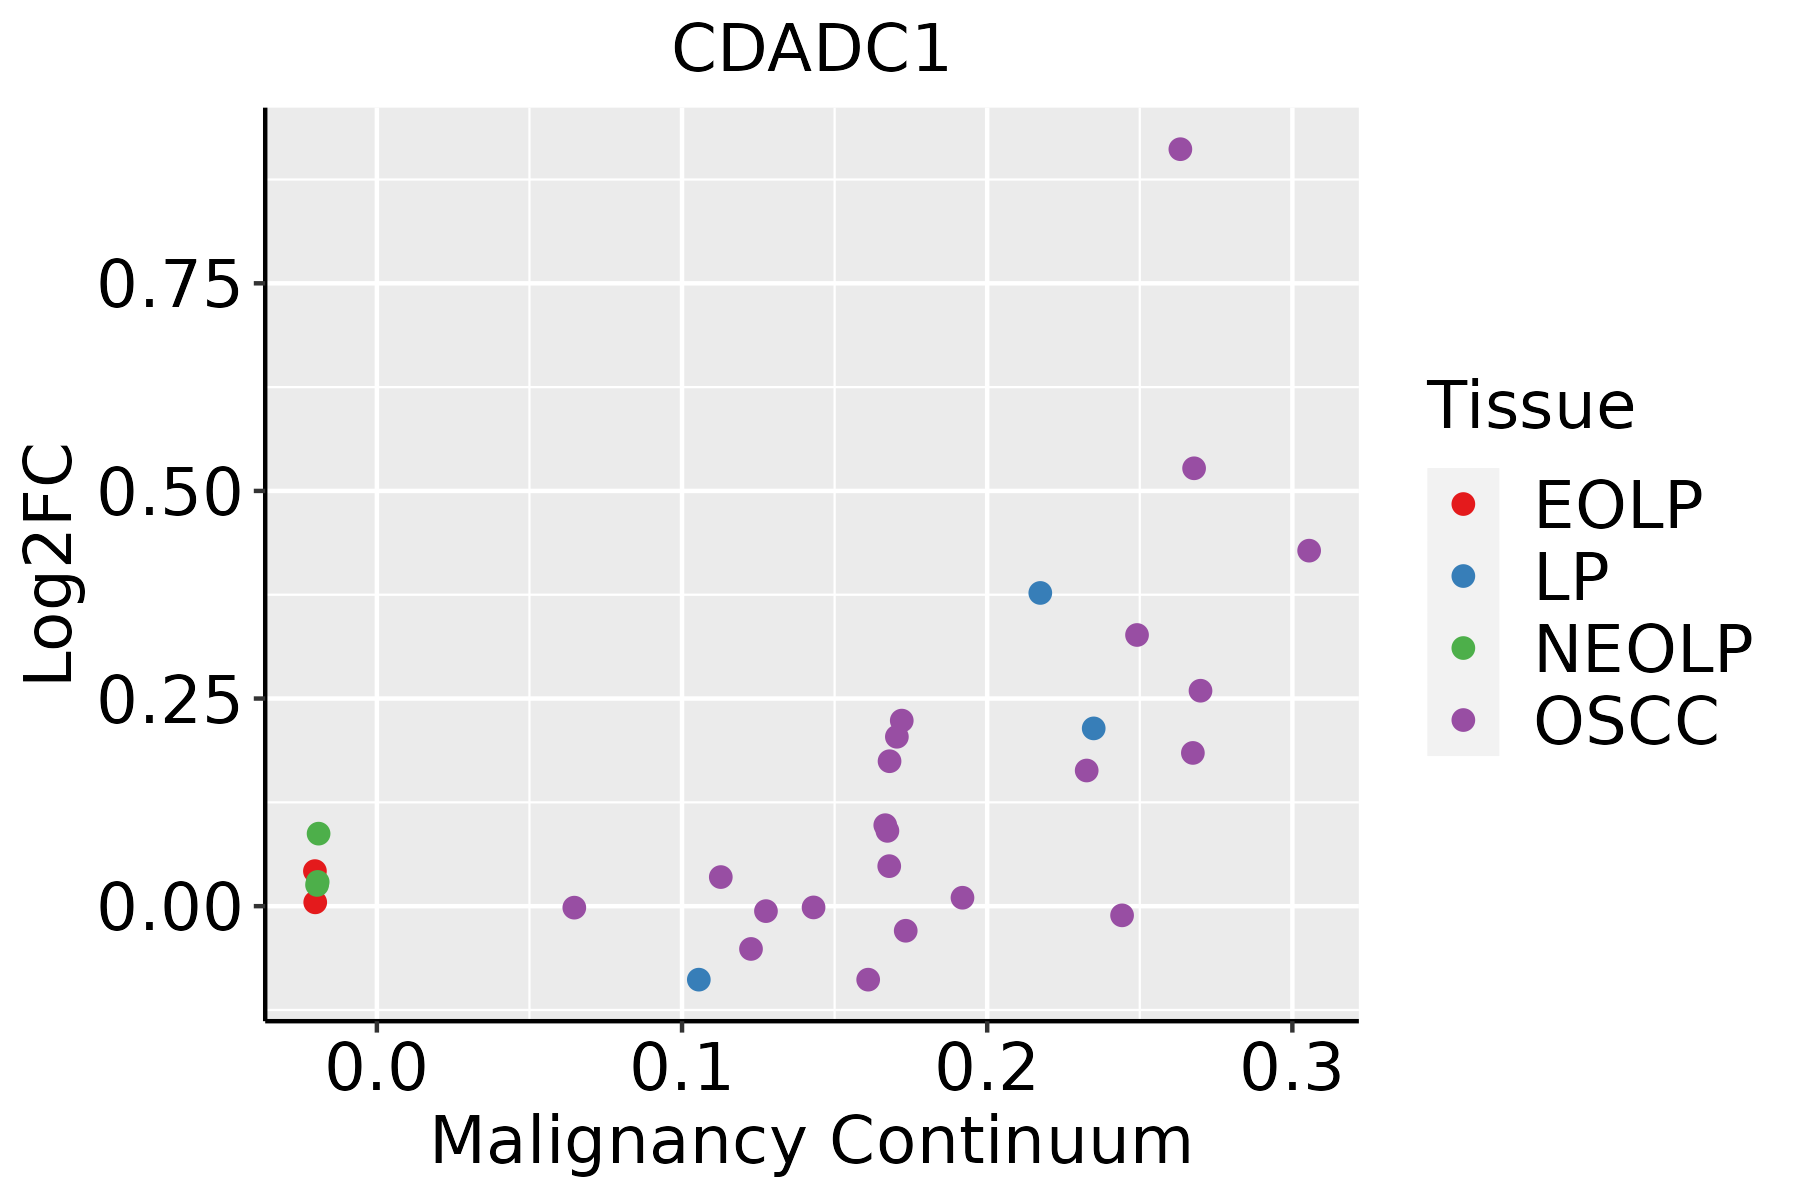 | EOLP: Erosive Oral lichen planus |
| LP: leukoplakia | ||
| NEOLP: Non-erosive oral lichen planus | ||
| OSCC: Oral squamous cell carcinoma | ||
| Thyroid | 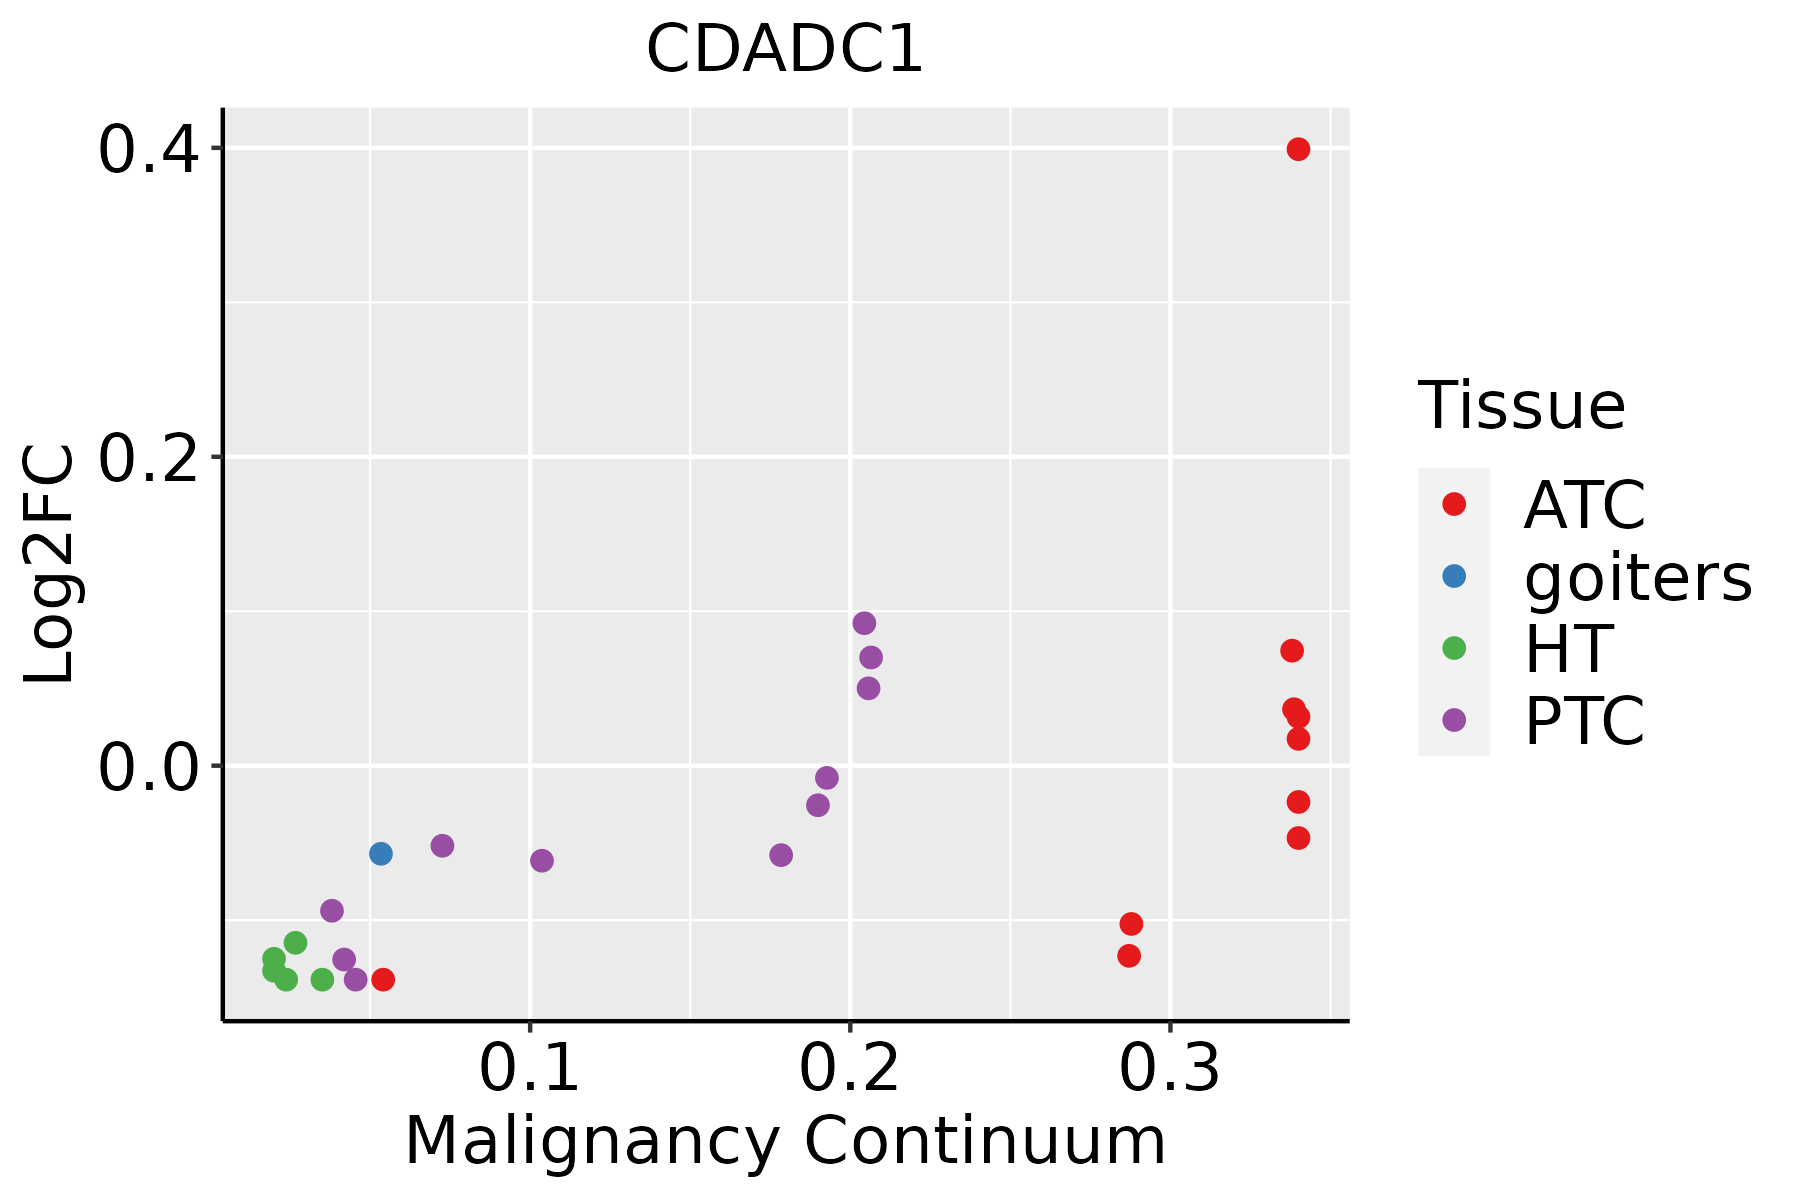 | ATC: Anaplastic thyroid cancer |
| HT: Hashimoto's thyroiditis | ||
| PTC: Papillary thyroid cancer |
| ∗log2FC in expression of this searched gene in stem-like cells from each diseased tissue sample relative to stem-like cells in normal samples in each tissue plotted against the malignancy continuum. Samples are colored based on if they are from different disease stage. |
Top |
Malignant transformation related pathway analysis |
| Find out the enriched GO biological processes and KEGG pathways involved in transition from healthy to precancer to cancer |
| Tissue | Disease Stage | Enriched GO biological Processes |
| Colorectum | AD |  |
| Colorectum | SER |  |
| Colorectum | MSS |  |
| Colorectum | MSI-H |  |
| Colorectum | FAP |  |
| ∗Top 15 enriched GO BP terms are showed in the bar plot of each disease state in each tissue. Each row represents a significant GO biological process which is colored according to the -log10(p.adjust). |
| Page: 1 2 3 4 5 6 7 8 9 |
| GO ID | Tissue | Disease Stage | Description | Gene Ratio | Bg Ratio | pvalue | p.adjust | Count |
| GO:0034655110 | Esophagus | ESCC | nucleobase-containing compound catabolic process | 272/8552 | 407/18723 | 2.92e-18 | 2.90e-16 | 272 |
| GO:004670018 | Esophagus | ESCC | heterocycle catabolic process | 286/8552 | 445/18723 | 1.12e-15 | 7.47e-14 | 286 |
| GO:004427019 | Esophagus | ESCC | cellular nitrogen compound catabolic process | 288/8552 | 451/18723 | 3.03e-15 | 1.79e-13 | 288 |
| GO:001943918 | Esophagus | ESCC | aromatic compound catabolic process | 295/8552 | 467/18723 | 1.09e-14 | 5.98e-13 | 295 |
| GO:190136118 | Esophagus | ESCC | organic cyclic compound catabolic process | 307/8552 | 495/18723 | 9.99e-14 | 4.80e-12 | 307 |
| GO:19016574 | Esophagus | ESCC | glycosyl compound metabolic process | 57/8552 | 88/18723 | 2.32e-04 | 1.44e-03 | 57 |
| GO:00725273 | Esophagus | ESCC | pyrimidine-containing compound metabolic process | 52/8552 | 82/18723 | 9.03e-04 | 4.61e-03 | 52 |
| GO:19011362 | Esophagus | ESCC | carbohydrate derivative catabolic process | 99/8552 | 172/18723 | 1.11e-03 | 5.54e-03 | 99 |
| GO:00442827 | Esophagus | ESCC | small molecule catabolic process | 201/8552 | 376/18723 | 1.35e-03 | 6.41e-03 | 201 |
| GO:00091163 | Esophagus | ESCC | nucleoside metabolic process | 39/8552 | 62/18723 | 4.68e-03 | 1.82e-02 | 39 |
| GO:0006304 | Esophagus | ESCC | DNA modification | 68/8552 | 120/18723 | 9.95e-03 | 3.42e-02 | 68 |
| GO:003465517 | Oral cavity | OSCC | nucleobase-containing compound catabolic process | 244/7305 | 407/18723 | 5.38e-18 | 5.49e-16 | 244 |
| GO:004670015 | Oral cavity | OSCC | heterocycle catabolic process | 254/7305 | 445/18723 | 5.07e-15 | 3.31e-13 | 254 |
| GO:004427016 | Oral cavity | OSCC | cellular nitrogen compound catabolic process | 256/7305 | 451/18723 | 9.67e-15 | 5.88e-13 | 256 |
| GO:001943915 | Oral cavity | OSCC | aromatic compound catabolic process | 263/7305 | 467/18723 | 1.49e-14 | 8.84e-13 | 263 |
| GO:190136115 | Oral cavity | OSCC | organic cyclic compound catabolic process | 272/7305 | 495/18723 | 2.73e-13 | 1.36e-11 | 272 |
| GO:19016573 | Oral cavity | OSCC | glycosyl compound metabolic process | 52/7305 | 88/18723 | 1.06e-04 | 7.84e-04 | 52 |
| GO:19011361 | Oral cavity | OSCC | carbohydrate derivative catabolic process | 89/7305 | 172/18723 | 4.52e-04 | 2.73e-03 | 89 |
| GO:00091162 | Oral cavity | OSCC | nucleoside metabolic process | 37/7305 | 62/18723 | 7.79e-04 | 4.23e-03 | 37 |
| GO:00442826 | Oral cavity | OSCC | small molecule catabolic process | 174/7305 | 376/18723 | 2.25e-03 | 1.00e-02 | 174 |
| Page: 1 2 |
| Pathway ID | Tissue | Disease Stage | Description | Gene Ratio | Bg Ratio | pvalue | p.adjust | qvalue | Count |
| Page: 1 |
Top |
Cell-cell communication analysis |
| Identification of potential cell-cell interactions between two cell types and their ligand-receptor pairs for different disease states |
| Ligand | Receptor | LRpair | Pathway | Tissue | Disease Stage |
| Page: 1 |
Top |
Single-cell gene regulatory network inference analysis |
| Find out the significant the regulons (TFs) and the target genes of each regulon across cell types for different disease states |
| TF | Cell Type | Tissue | Disease Stage | Target Gene | RSS | Regulon Activity |
| ∗The dot plots of a searched regulon are shown for all cell subpopulations in each disease state of each tissue based on the regulon specific score inferred using pySCENIC and by calculating the average expression. |
| Page: 1 |
Top |
Somatic mutation of malignant transformation related genes |
| Annotation of somatic variants for genes involved in malignant transformation |
| Hugo Symbol | Variant Class | Variant Classification | dbSNP RS | HGVSc | HGVSp | HGVSp Short | SWISSPROT | BIOTYPE | SIFT | PolyPhen | Tumor Sample Barcode | Tissue | Histology | Sex | Age | Stage | Therapy Types | Drugs | Outcome |
| CDADC1 | SNV | Missense_Mutation | c.872N>T | p.Pro291Leu | p.P291L | Q9BWV3 | protein_coding | deleterious(0) | probably_damaging(0.967) | TCGA-A2-A0ET-01 | Breast | breast invasive carcinoma | Female | <65 | III/IV | Chemotherapy | cytoxan | SD | |
| CDADC1 | SNV | Missense_Mutation | c.1124A>C | p.Tyr375Ser | p.Y375S | Q9BWV3 | protein_coding | deleterious(0) | probably_damaging(1) | TCGA-AR-A0TQ-01 | Breast | breast invasive carcinoma | Female | <65 | III/IV | Chemotherapy | doxorubicin | SD | |
| CDADC1 | SNV | Missense_Mutation | novel | c.768G>A | p.Met256Ile | p.M256I | Q9BWV3 | protein_coding | tolerated(0.1) | benign(0.201) | TCGA-BH-A42V-01 | Breast | breast invasive carcinoma | Female | <65 | I/II | Unknown | Unknown | SD |
| CDADC1 | SNV | Missense_Mutation | c.1129G>A | p.Asp377Asn | p.D377N | Q9BWV3 | protein_coding | tolerated(0.17) | probably_damaging(0.953) | TCGA-C8-A1HO-01 | Breast | breast invasive carcinoma | Female | <65 | III/IV | Chemotherapy | 5-fluorouracil | CR | |
| CDADC1 | SNV | Missense_Mutation | c.206N>C | p.Leu69Ser | p.L69S | Q9BWV3 | protein_coding | tolerated(0.12) | benign(0) | TCGA-E2-A1LS-01 | Breast | breast invasive carcinoma | Female | <65 | I/II | Unspecific | Cyclophosphamide | SD | |
| CDADC1 | insertion | Frame_Shift_Ins | novel | c.1544_1545insG | p.Ter515%3D | p.*515%3D | Q9BWV3 | protein_coding | TCGA-B6-A0IK-01 | Breast | breast invasive carcinoma | Female | <65 | III/IV | Unknown | Unknown | PD | ||
| CDADC1 | SNV | Missense_Mutation | rs141868508 | c.485N>T | p.Thr162Met | p.T162M | Q9BWV3 | protein_coding | tolerated(0.1) | benign(0.163) | TCGA-A6-5661-01 | Colorectum | colon adenocarcinoma | Female | >=65 | I/II | Unknown | Unknown | SD |
| CDADC1 | SNV | Missense_Mutation | rs376714185 | c.1528C>T | p.Arg510Cys | p.R510C | Q9BWV3 | protein_coding | tolerated_low_confidence(0.37) | benign(0) | TCGA-A6-6141-01 | Colorectum | colon adenocarcinoma | Male | <65 | I/II | Chemotherapy | 5-fu | SD |
| CDADC1 | SNV | Missense_Mutation | c.581C>A | p.Pro194His | p.P194H | Q9BWV3 | protein_coding | deleterious(0) | possibly_damaging(0.8) | TCGA-A6-6780-01 | Colorectum | colon adenocarcinoma | Male | >=65 | I/II | Unknown | Unknown | SD | |
| CDADC1 | SNV | Missense_Mutation | c.1373N>C | p.Met458Thr | p.M458T | Q9BWV3 | protein_coding | deleterious(0) | benign(0.428) | TCGA-AA-A022-01 | Colorectum | colon adenocarcinoma | Female | >=65 | I/II | Unknown | Unknown | SD |
| Page: 1 2 3 4 5 |
Top |
Related drugs of malignant transformation related genes |
| Identification of chemicals and drugs interact with genes involved in malignant transfromation |
| (DGIdb 4.0) |
| Entrez ID | Symbol | Category | Interaction Types | Drug Claim Name | Drug Name | PMIDs |
| Page: 1 |

Copyright 2023-Present -The University of Texas Health Science Center at Houston |