
|
|||||
|
 | |
| |
| |
| |
| |
| |
|
Gene: CDA |
Gene summary for CDA |
| Gene information | Species | Human | Gene symbol | CDA | Gene ID | 978 |
| Gene name | cytidine deaminase | |
| Gene Alias | CDD | |
| Cytomap | 1p36.12 | |
| Gene Type | protein-coding | GO ID | GO:0001558 | UniProtAcc | P32320 |
Top |
Malignant transformation analysis |
| Identification of the aberrant gene expression in precancerous and cancerous lesions by comparing the gene expression of stem-like cells in diseased tissues with normal stem cells |
| Entrez ID | Symbol | Replicates | Species | Organ | Tissue | Adj P-value | Log2FC | Malignancy |
| 978 | CDA | HTA11_2487_2000001011 | Human | Colorectum | SER | 4.18e-09 | 6.85e-01 | -0.1808 |
| 978 | CDA | HTA11_411_2000001011 | Human | Colorectum | SER | 5.83e-08 | 1.40e+00 | -0.2602 |
| 978 | CDA | HTA11_2112_2000001011 | Human | Colorectum | SER | 4.02e-06 | 8.66e-01 | -0.2196 |
| 978 | CDA | HTA11_3361_2000001011 | Human | Colorectum | AD | 4.59e-03 | 2.32e-01 | -0.1207 |
| 978 | CDA | HTA11_696_2000001011 | Human | Colorectum | AD | 6.48e-05 | 4.07e-01 | -0.1464 |
| 978 | CDA | HTA11_5212_2000001011 | Human | Colorectum | AD | 1.57e-06 | 6.60e-01 | -0.2061 |
| 978 | CDA | P4T-E | Human | Esophagus | ESCC | 2.13e-05 | 1.75e-01 | 0.1323 |
| 978 | CDA | P5T-E | Human | Esophagus | ESCC | 5.79e-16 | 2.73e-01 | 0.1327 |
| 978 | CDA | P9T-E | Human | Esophagus | ESCC | 1.66e-02 | 1.74e-01 | 0.1131 |
| 978 | CDA | P17T-E | Human | Esophagus | ESCC | 6.50e-11 | 7.65e-01 | 0.1278 |
| 978 | CDA | P24T-E | Human | Esophagus | ESCC | 3.50e-02 | 8.73e-02 | 0.1287 |
| 978 | CDA | P26T-E | Human | Esophagus | ESCC | 4.31e-06 | 1.62e-01 | 0.1276 |
| 978 | CDA | P27T-E | Human | Esophagus | ESCC | 1.35e-07 | 2.28e-01 | 0.1055 |
| 978 | CDA | P28T-E | Human | Esophagus | ESCC | 3.75e-03 | 1.29e-01 | 0.1149 |
| 978 | CDA | P31T-E | Human | Esophagus | ESCC | 1.78e-03 | 1.85e-01 | 0.1251 |
| 978 | CDA | P36T-E | Human | Esophagus | ESCC | 6.01e-08 | 4.00e-01 | 0.1187 |
| 978 | CDA | P37T-E | Human | Esophagus | ESCC | 1.63e-62 | 1.78e+00 | 0.1371 |
| 978 | CDA | P38T-E | Human | Esophagus | ESCC | 3.72e-13 | 8.23e-01 | 0.127 |
| 978 | CDA | P49T-E | Human | Esophagus | ESCC | 1.92e-16 | 1.33e+00 | 0.1768 |
| 978 | CDA | P52T-E | Human | Esophagus | ESCC | 2.05e-07 | 1.62e-01 | 0.1555 |
| Page: 1 2 3 |
| Tissue | Expression Dynamics | Abbreviation |
| Colorectum (GSE201348) |  | FAP: Familial adenomatous polyposis |
| CRC: Colorectal cancer | ||
| Colorectum (HTA11) |  | AD: Adenomas |
| SER: Sessile serrated lesions | ||
| MSI-H: Microsatellite-high colorectal cancer | ||
| MSS: Microsatellite stable colorectal cancer | ||
| Esophagus | 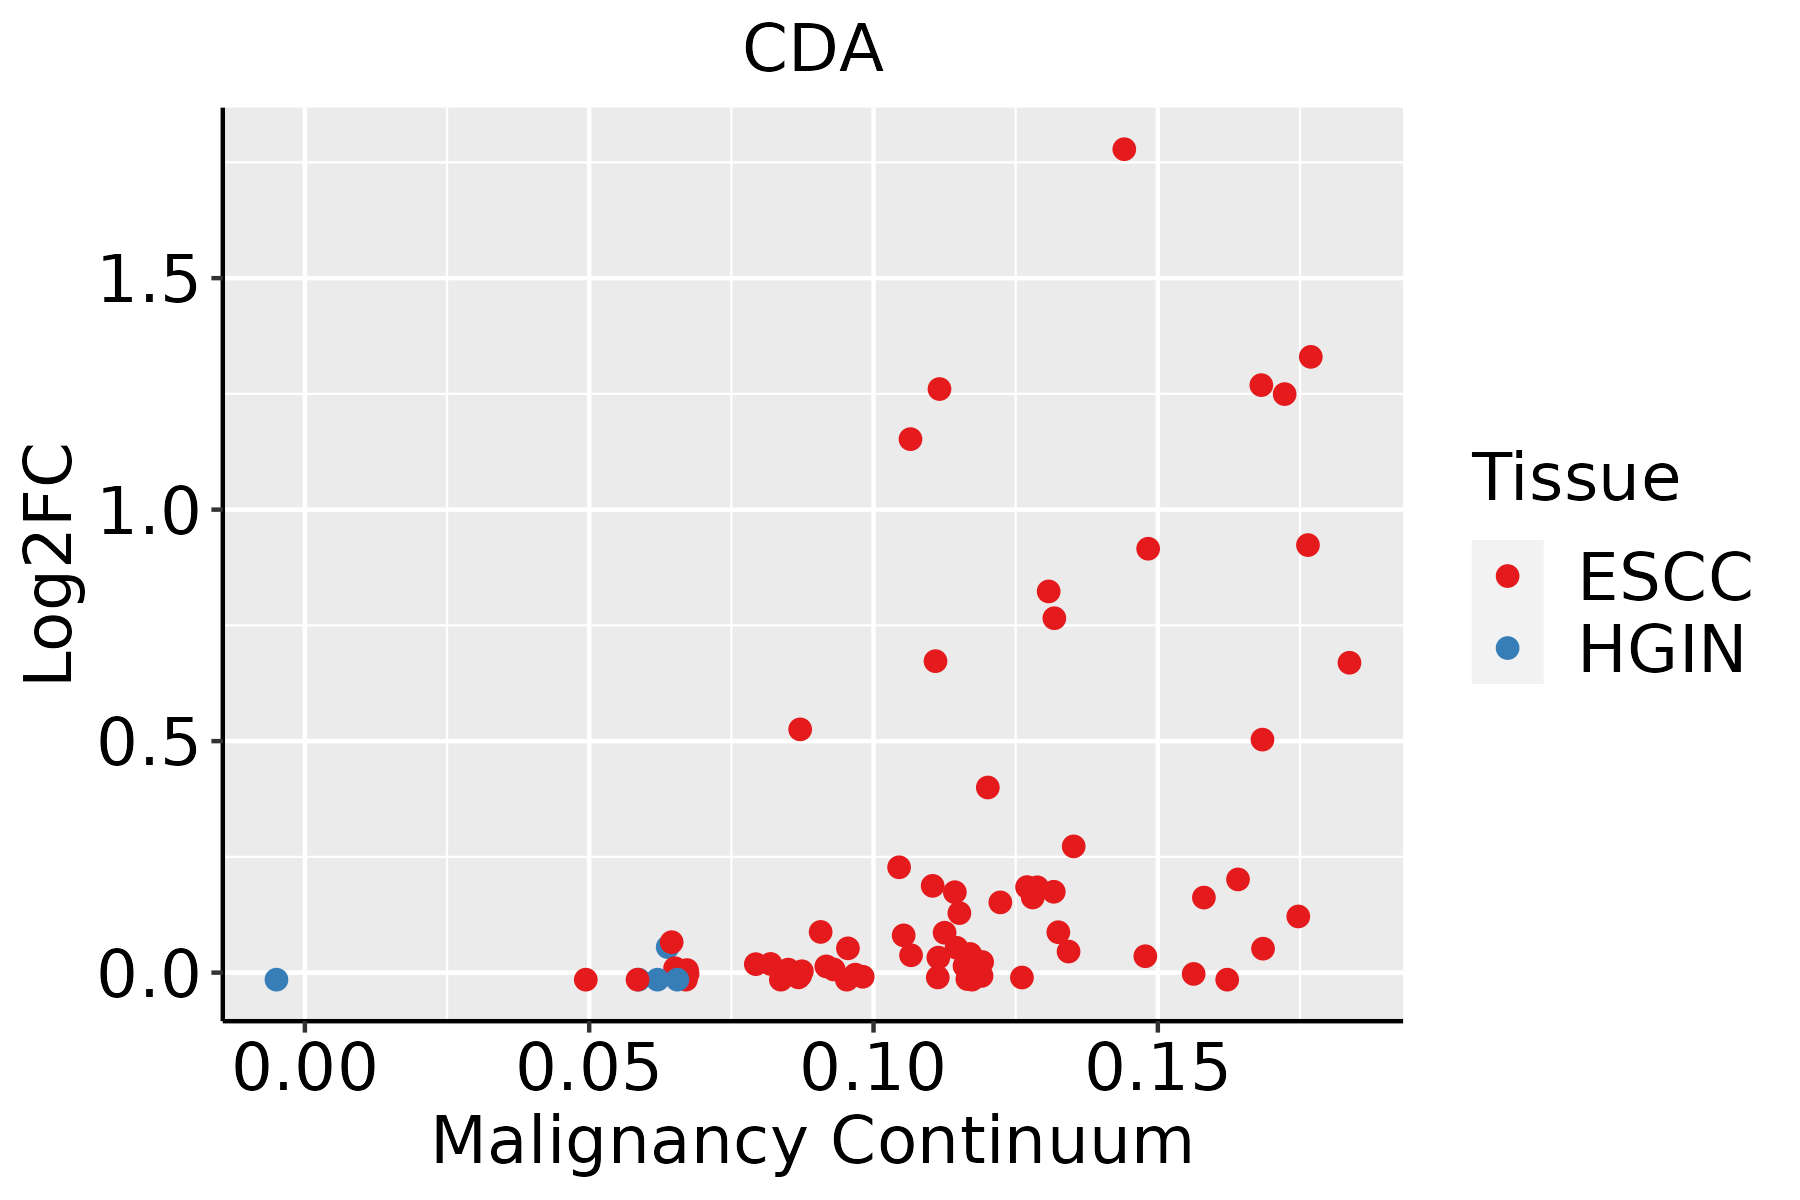 | ESCC: Esophageal squamous cell carcinoma |
| HGIN: High-grade intraepithelial neoplasias | ||
| LGIN: Low-grade intraepithelial neoplasias | ||
| GC |  | CAG: Chronic atrophic gastritis |
| CAG with IM: Chronic atrophic gastritis with intestinal metaplasia | ||
| CSG: Chronic superficial gastritis | ||
| GC: Gastric cancer | ||
| SIM: Severe intestinal metaplasia | ||
| WIM: Wild intestinal metaplasia | ||
| Liver | 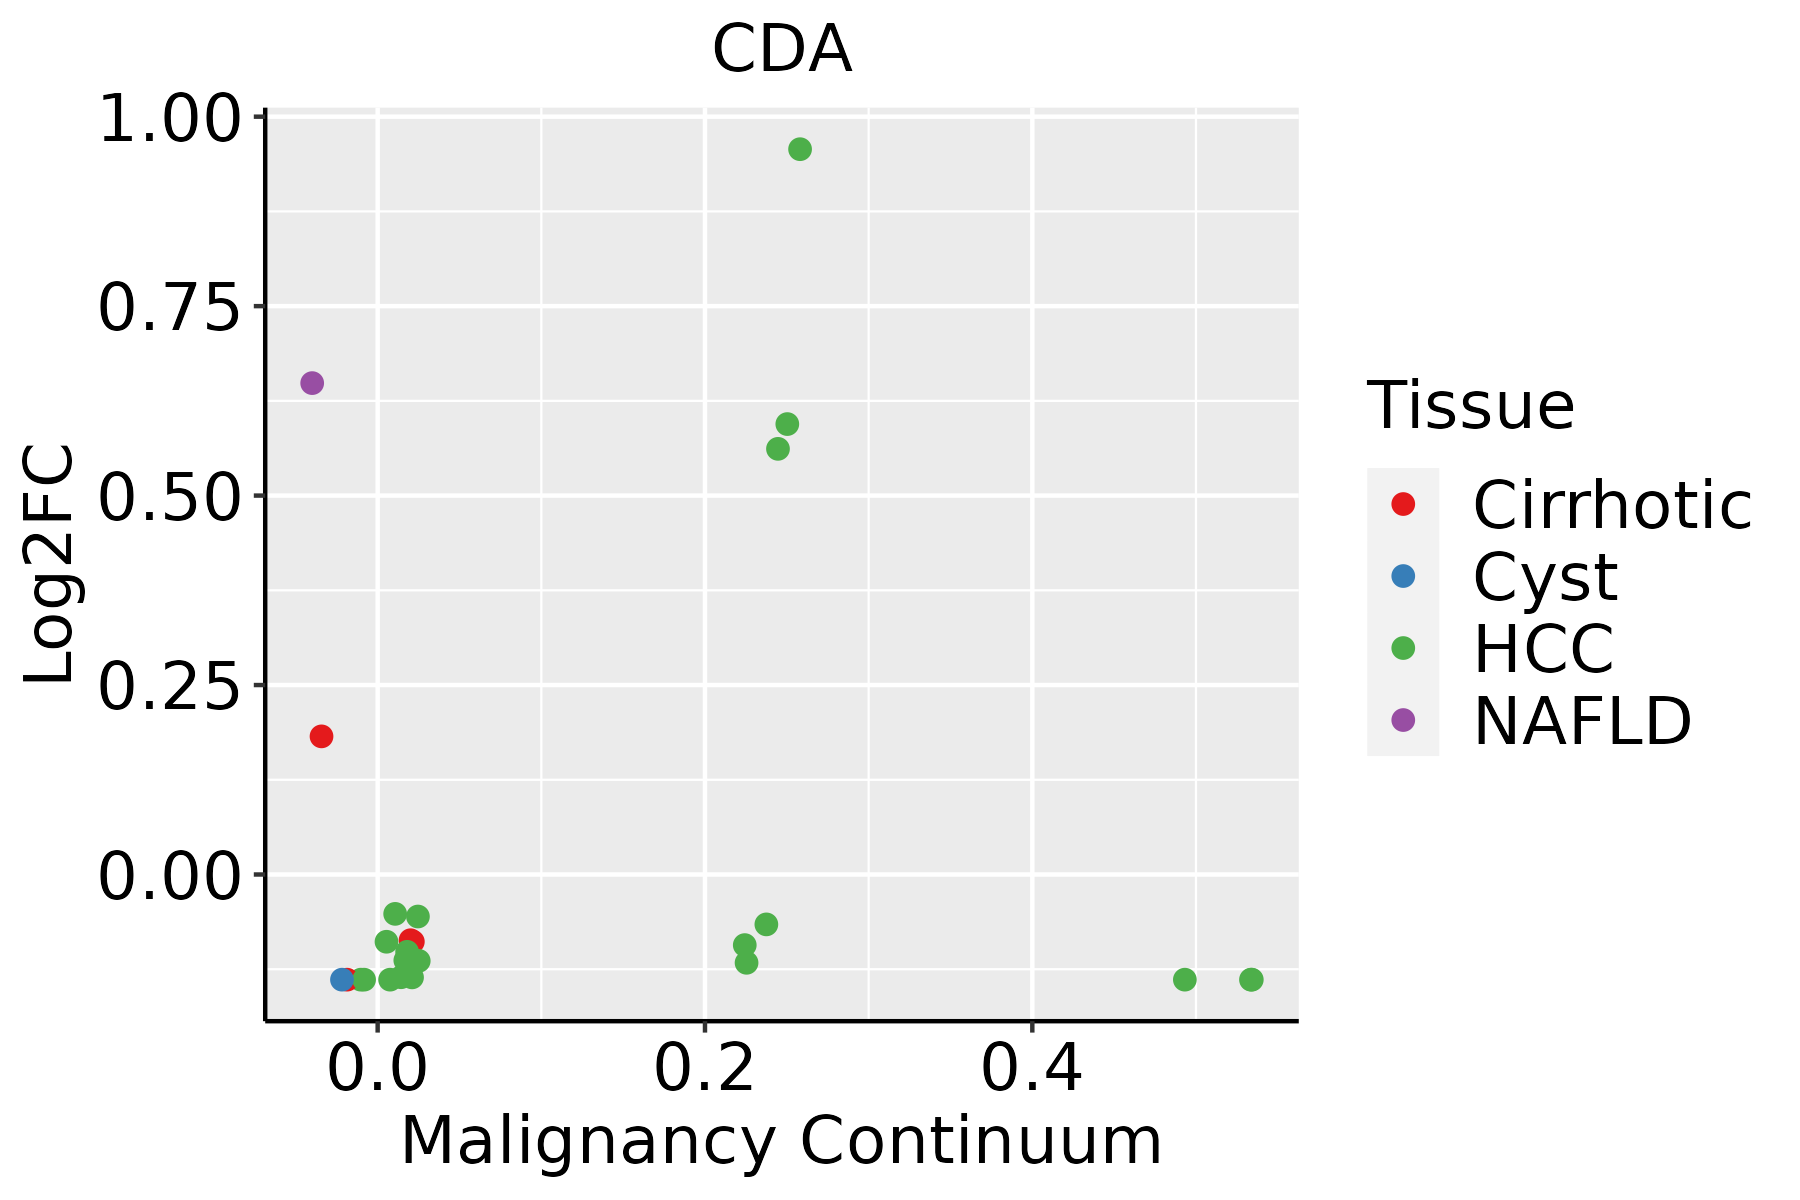 | HCC: Hepatocellular carcinoma |
| NAFLD: Non-alcoholic fatty liver disease | ||
| Oral Cavity |  | EOLP: Erosive Oral lichen planus |
| LP: leukoplakia | ||
| NEOLP: Non-erosive oral lichen planus | ||
| OSCC: Oral squamous cell carcinoma | ||
| Skin | 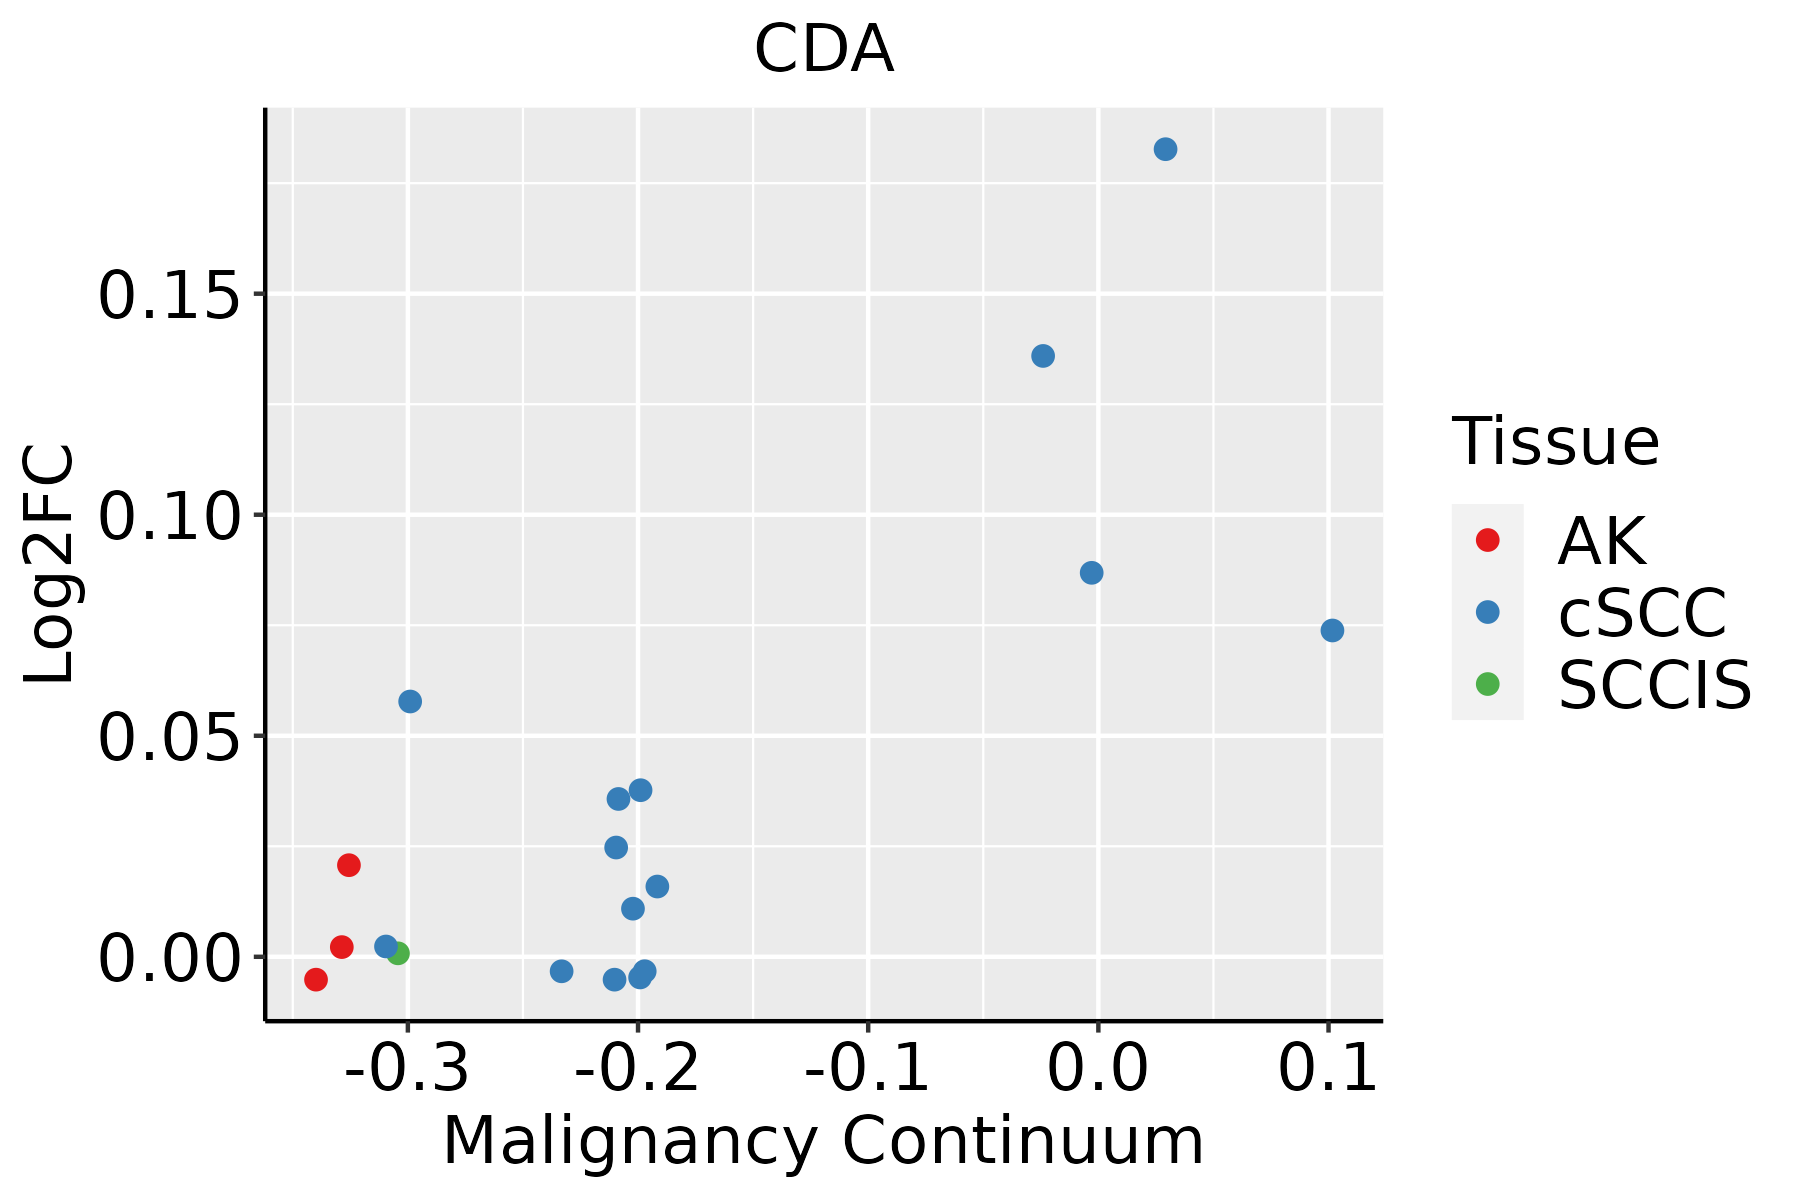 | AK: Actinic keratosis |
| cSCC: Cutaneous squamous cell carcinoma | ||
| SCCIS:squamous cell carcinoma in situ | ||
| Thyroid | 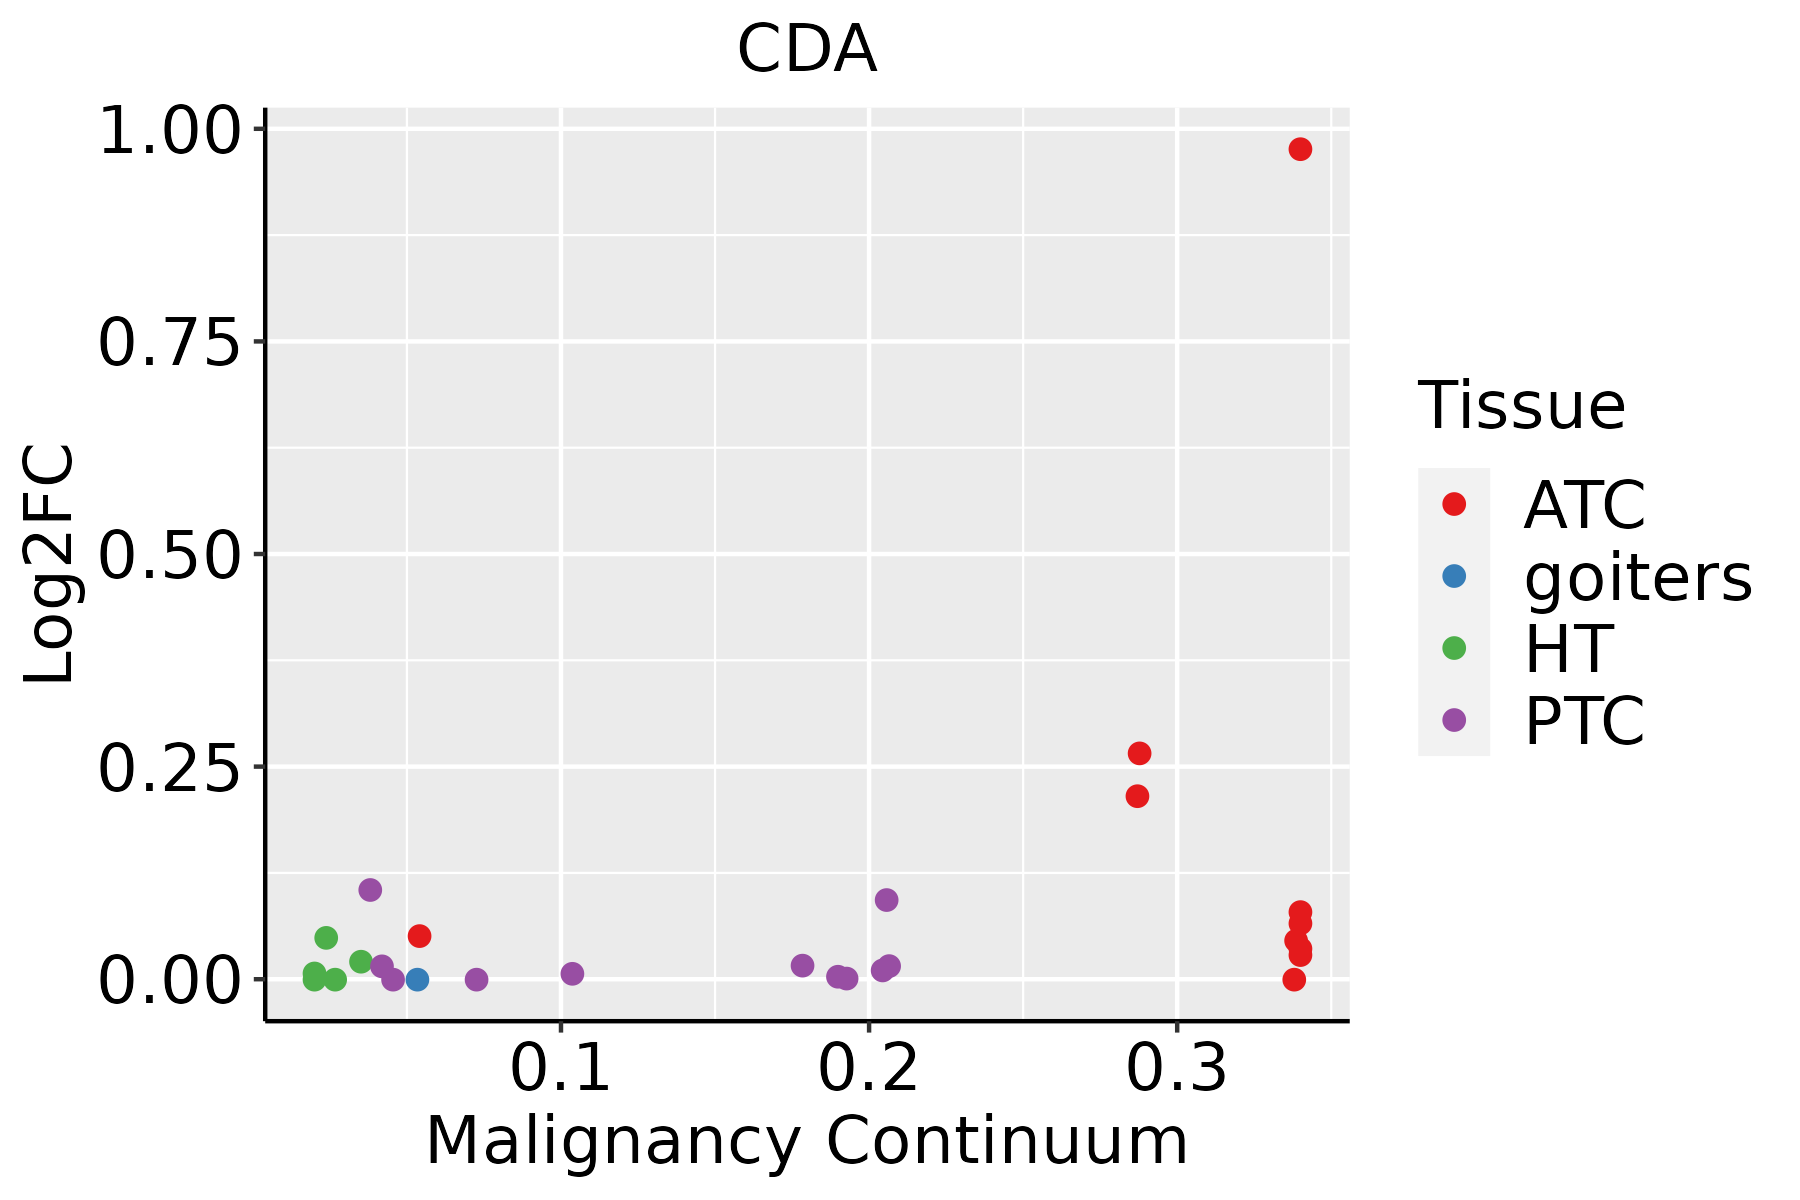 | ATC: Anaplastic thyroid cancer |
| HT: Hashimoto's thyroiditis | ||
| PTC: Papillary thyroid cancer |
| ∗log2FC in expression of this searched gene in stem-like cells from each diseased tissue sample relative to stem-like cells in normal samples in each tissue plotted against the malignancy continuum. Samples are colored based on if they are from different disease stage. |
Top |
Malignant transformation related pathway analysis |
| Find out the enriched GO biological processes and KEGG pathways involved in transition from healthy to precancer to cancer |
| Tissue | Disease Stage | Enriched GO biological Processes |
| Colorectum | AD |  |
| Colorectum | SER |  |
| Colorectum | MSS |  |
| Colorectum | MSI-H |  |
| Colorectum | FAP |  |
| ∗Top 15 enriched GO BP terms are showed in the bar plot of each disease state in each tissue. Each row represents a significant GO biological process which is colored according to the -log10(p.adjust). |
| Page: 1 2 3 4 5 6 7 8 9 |
| GO ID | Tissue | Disease Stage | Description | Gene Ratio | Bg Ratio | pvalue | p.adjust | Count |
| GO:0009117 | Colorectum | AD | nucleotide metabolic process | 168/3918 | 489/18723 | 2.20e-12 | 3.36e-10 | 168 |
| GO:0006753 | Colorectum | AD | nucleoside phosphate metabolic process | 169/3918 | 497/18723 | 4.99e-12 | 6.98e-10 | 169 |
| GO:0044270 | Colorectum | AD | cellular nitrogen compound catabolic process | 147/3918 | 451/18723 | 3.35e-09 | 2.23e-07 | 147 |
| GO:0046700 | Colorectum | AD | heterocycle catabolic process | 145/3918 | 445/18723 | 4.37e-09 | 2.84e-07 | 145 |
| GO:0034655 | Colorectum | AD | nucleobase-containing compound catabolic process | 133/3918 | 407/18723 | 1.56e-08 | 9.12e-07 | 133 |
| GO:0019439 | Colorectum | AD | aromatic compound catabolic process | 146/3918 | 467/18723 | 7.48e-08 | 3.84e-06 | 146 |
| GO:1901361 | Colorectum | AD | organic cyclic compound catabolic process | 153/3918 | 495/18723 | 8.23e-08 | 4.18e-06 | 153 |
| GO:0044282 | Colorectum | AD | small molecule catabolic process | 118/3918 | 376/18723 | 1.05e-06 | 3.55e-05 | 118 |
| GO:0016049 | Colorectum | AD | cell growth | 143/3918 | 482/18723 | 2.83e-06 | 8.09e-05 | 143 |
| GO:0001558 | Colorectum | AD | regulation of cell growth | 124/3918 | 414/18723 | 7.67e-06 | 1.86e-04 | 124 |
| GO:0010563 | Colorectum | AD | negative regulation of phosphorus metabolic process | 130/3918 | 442/18723 | 1.26e-05 | 2.76e-04 | 130 |
| GO:0045936 | Colorectum | AD | negative regulation of phosphate metabolic process | 129/3918 | 441/18723 | 1.81e-05 | 3.76e-04 | 129 |
| GO:0062012 | Colorectum | AD | regulation of small molecule metabolic process | 93/3918 | 334/18723 | 1.46e-03 | 1.24e-02 | 93 |
| GO:0045926 | Colorectum | AD | negative regulation of growth | 70/3918 | 249/18723 | 4.07e-03 | 2.83e-02 | 70 |
| GO:00091171 | Colorectum | SER | nucleotide metabolic process | 122/2897 | 489/18723 | 2.50e-08 | 1.76e-06 | 122 |
| GO:00067531 | Colorectum | SER | nucleoside phosphate metabolic process | 122/2897 | 497/18723 | 6.64e-08 | 4.33e-06 | 122 |
| GO:00105631 | Colorectum | SER | negative regulation of phosphorus metabolic process | 101/2897 | 442/18723 | 2.39e-05 | 6.70e-04 | 101 |
| GO:00459361 | Colorectum | SER | negative regulation of phosphate metabolic process | 100/2897 | 441/18723 | 3.62e-05 | 9.39e-04 | 100 |
| GO:00442821 | Colorectum | SER | small molecule catabolic process | 87/2897 | 376/18723 | 5.31e-05 | 1.27e-03 | 87 |
| GO:00442701 | Colorectum | SER | cellular nitrogen compound catabolic process | 99/2897 | 451/18723 | 1.46e-04 | 2.86e-03 | 99 |
| Page: 1 2 3 4 5 6 7 8 9 |
| Pathway ID | Tissue | Disease Stage | Description | Gene Ratio | Bg Ratio | pvalue | p.adjust | qvalue | Count |
| hsa01232 | Liver | Cirrhotic | Nucleotide metabolism | 39/2530 | 85/8465 | 1.27e-03 | 6.73e-03 | 4.15e-03 | 39 |
| hsa00240 | Liver | Cirrhotic | Pyrimidine metabolism | 27/2530 | 58/8465 | 5.31e-03 | 1.88e-02 | 1.16e-02 | 27 |
| hsa00983 | Liver | Cirrhotic | Drug metabolism - other enzymes | 34/2530 | 80/8465 | 1.08e-02 | 3.57e-02 | 2.20e-02 | 34 |
| hsa012321 | Liver | Cirrhotic | Nucleotide metabolism | 39/2530 | 85/8465 | 1.27e-03 | 6.73e-03 | 4.15e-03 | 39 |
| hsa002401 | Liver | Cirrhotic | Pyrimidine metabolism | 27/2530 | 58/8465 | 5.31e-03 | 1.88e-02 | 1.16e-02 | 27 |
| hsa009831 | Liver | Cirrhotic | Drug metabolism - other enzymes | 34/2530 | 80/8465 | 1.08e-02 | 3.57e-02 | 2.20e-02 | 34 |
| hsa002402 | Liver | HCC | Pyrimidine metabolism | 44/4020 | 58/8465 | 9.34e-06 | 7.11e-05 | 3.95e-05 | 44 |
| hsa012322 | Liver | HCC | Nucleotide metabolism | 59/4020 | 85/8465 | 3.30e-05 | 1.88e-04 | 1.04e-04 | 59 |
| hsa009832 | Liver | HCC | Drug metabolism - other enzymes | 54/4020 | 80/8465 | 2.25e-04 | 1.09e-03 | 6.08e-04 | 54 |
| hsa002403 | Liver | HCC | Pyrimidine metabolism | 44/4020 | 58/8465 | 9.34e-06 | 7.11e-05 | 3.95e-05 | 44 |
| hsa012323 | Liver | HCC | Nucleotide metabolism | 59/4020 | 85/8465 | 3.30e-05 | 1.88e-04 | 1.04e-04 | 59 |
| hsa009833 | Liver | HCC | Drug metabolism - other enzymes | 54/4020 | 80/8465 | 2.25e-04 | 1.09e-03 | 6.08e-04 | 54 |
| hsa012324 | Oral cavity | OSCC | Nucleotide metabolism | 54/3704 | 85/8465 | 1.78e-04 | 5.95e-04 | 3.03e-04 | 54 |
| hsa002404 | Oral cavity | OSCC | Pyrimidine metabolism | 37/3704 | 58/8465 | 1.62e-03 | 4.45e-03 | 2.26e-03 | 37 |
| hsa0123211 | Oral cavity | OSCC | Nucleotide metabolism | 54/3704 | 85/8465 | 1.78e-04 | 5.95e-04 | 3.03e-04 | 54 |
| hsa0024011 | Oral cavity | OSCC | Pyrimidine metabolism | 37/3704 | 58/8465 | 1.62e-03 | 4.45e-03 | 2.26e-03 | 37 |
| Page: 1 |
Top |
Cell-cell communication analysis |
| Identification of potential cell-cell interactions between two cell types and their ligand-receptor pairs for different disease states |
| Ligand | Receptor | LRpair | Pathway | Tissue | Disease Stage |
| Page: 1 |
Top |
Single-cell gene regulatory network inference analysis |
| Find out the significant the regulons (TFs) and the target genes of each regulon across cell types for different disease states |
| TF | Cell Type | Tissue | Disease Stage | Target Gene | RSS | Regulon Activity |
| ∗The dot plots of a searched regulon are shown for all cell subpopulations in each disease state of each tissue based on the regulon specific score inferred using pySCENIC and by calculating the average expression. |
| Page: 1 |
Top |
Somatic mutation of malignant transformation related genes |
| Annotation of somatic variants for genes involved in malignant transformation |
| Hugo Symbol | Variant Class | Variant Classification | dbSNP RS | HGVSc | HGVSp | HGVSp Short | SWISSPROT | BIOTYPE | SIFT | PolyPhen | Tumor Sample Barcode | Tissue | Histology | Sex | Age | Stage | Therapy Types | Drugs | Outcome |
| CDA | SNV | Missense_Mutation | c.325N>G | p.Phe109Val | p.F109V | P32320 | protein_coding | deleterious(0.03) | probably_damaging(1) | TCGA-E9-A22E-01 | Breast | breast invasive carcinoma | Female | <65 | III/IV | Chemotherapy | cyclophosphane | SD | |
| CDA | deletion | Frame_Shift_Del | novel | c.196delG | p.Ala66LeufsTer41 | p.A66Lfs*41 | P32320 | protein_coding | TCGA-D8-A27V-01 | Breast | breast invasive carcinoma | Female | <65 | I/II | Hormone Therapy | tamoxiphen | SD | ||
| CDA | SNV | Missense_Mutation | novel | c.318N>A | p.Met106Ile | p.M106I | P32320 | protein_coding | tolerated(0.43) | benign(0.025) | TCGA-C5-A2LZ-01 | Cervix | cervical & endocervical cancer | Female | >=65 | III/IV | Unknown | Unknown | PD |
| CDA | SNV | Missense_Mutation | novel | c.203G>T | p.Arg68Leu | p.R68L | P32320 | protein_coding | deleterious(0) | probably_damaging(0.996) | TCGA-F5-6814-01 | Colorectum | rectum adenocarcinoma | Male | <65 | I/II | Unknown | Unknown | SD |
| CDA | SNV | Missense_Mutation | c.254N>C | p.Ile85Thr | p.I85T | P32320 | protein_coding | deleterious(0) | probably_damaging(0.962) | TCGA-BS-A0UV-01 | Endometrium | uterine corpus endometrioid carcinoma | Female | <65 | III/IV | Unknown | Unknown | SD | |
| CDA | SNV | Missense_Mutation | c.240N>T | p.Lys80Asn | p.K80N | P32320 | protein_coding | tolerated(0.06) | possibly_damaging(0.499) | TCGA-D1-A17B-01 | Endometrium | uterine corpus endometrioid carcinoma | Female | >=65 | I/II | Unknown | Unknown | SD | |
| CDA | SNV | Missense_Mutation | c.78N>T | p.Lys26Asn | p.K26N | P32320 | protein_coding | deleterious(0) | probably_damaging(0.99) | TCGA-EO-A3AV-01 | Endometrium | uterine corpus endometrioid carcinoma | Female | <65 | III/IV | Chemotherapy | carboplatin | CR | |
| CDA | SNV | Missense_Mutation | novel | c.138G>T | p.Glu46Asp | p.E46D | P32320 | protein_coding | tolerated(1) | benign(0) | TCGA-FI-A2D5-01 | Endometrium | uterine corpus endometrioid carcinoma | Female | <65 | III/IV | Chemotherapy | carboplatinum | PD |
| CDA | SNV | Missense_Mutation | novel | c.157N>C | p.Cys53Arg | p.C53R | P32320 | protein_coding | deleterious(0) | probably_damaging(0.999) | TCGA-4R-AA8I-01 | Liver | liver hepatocellular carcinoma | Male | >=65 | I/II | Unknown | Unknown | PD |
| CDA | SNV | Missense_Mutation | c.271N>G | p.Met91Val | p.M91V | P32320 | protein_coding | tolerated(0.85) | benign(0) | TCGA-5C-A9VG-01 | Liver | liver hepatocellular carcinoma | Male | <65 | I/II | Unknown | Unknown | SD |
| Page: 1 2 |
Top |
Related drugs of malignant transformation related genes |
| Identification of chemicals and drugs interact with genes involved in malignant transfromation |
| (DGIdb 4.0) |
| Entrez ID | Symbol | Category | Interaction Types | Drug Claim Name | Drug Name | PMIDs |
| 978 | CDA | ENZYME, DRUGGABLE GENOME | CYTARABINE | CYTARABINE | 12008078 | |
| 978 | CDA | ENZYME, DRUGGABLE GENOME | cytarabine | CYTARABINE | 21325291,21521023,22304580,22379997,25003625,19458626,23651026,23230131,18473752 | |
| 978 | CDA | ENZYME, DRUGGABLE GENOME | Tetrahydrouridine | TETRAHYDROURIDINE | ||
| 978 | CDA | ENZYME, DRUGGABLE GENOME | DEOXYCYTIDINE | DEOXYCYTIDINE | 12008078 | |
| 978 | CDA | ENZYME, DRUGGABLE GENOME | capecitabine | CAPECITABINE | 21325291,24167597,28347776,18473752,23736036 | |
| 978 | CDA | ENZYME, DRUGGABLE GENOME | GEMCITABINE | GEMCITABINE | 12477049 | |
| 978 | CDA | ENZYME, DRUGGABLE GENOME | TETRAHYDROURIDINE | TETRAHYDROURIDINE | 2932216 | |
| 978 | CDA | ENZYME, DRUGGABLE GENOME | difluorodeoxyuridine | 22838949 | ||
| 978 | CDA | ENZYME, DRUGGABLE GENOME | azacitidine | AZACITIDINE | 25850965 | |
| 978 | CDA | ENZYME, DRUGGABLE GENOME | ARA-C | 8791999,12008078 |
| Page: 1 2 |

Copyright 2023-Present -The University of Texas Health Science Center at Houston |