
|
|||||
|
 | |
| |
| |
| |
| |
| |
|
Gene: CD99L2 |
Gene summary for CD99L2 |
| Gene information | Species | Human | Gene symbol | CD99L2 | Gene ID | 83692 |
| Gene name | CD99 molecule like 2 | |
| Gene Alias | CD99B | |
| Cytomap | Xq28 | |
| Gene Type | protein-coding | GO ID | GO:0007155 | UniProtAcc | Q8TCZ2 |
Top |
Malignant transformation analysis |
| Identification of the aberrant gene expression in precancerous and cancerous lesions by comparing the gene expression of stem-like cells in diseased tissues with normal stem cells |
| Entrez ID | Symbol | Replicates | Species | Organ | Tissue | Adj P-value | Log2FC | Malignancy |
| 83692 | CD99L2 | LZE2T | Human | Esophagus | ESCC | 7.89e-04 | 4.44e-01 | 0.082 |
| 83692 | CD99L2 | LZE7T | Human | Esophagus | ESCC | 2.01e-06 | 4.09e-01 | 0.0667 |
| 83692 | CD99L2 | LZE21T | Human | Esophagus | ESCC | 5.19e-03 | 2.32e-01 | 0.0655 |
| 83692 | CD99L2 | P2T-E | Human | Esophagus | ESCC | 8.33e-17 | 2.62e-01 | 0.1177 |
| 83692 | CD99L2 | P4T-E | Human | Esophagus | ESCC | 3.34e-16 | 2.01e-01 | 0.1323 |
| 83692 | CD99L2 | P5T-E | Human | Esophagus | ESCC | 5.36e-06 | 9.20e-02 | 0.1327 |
| 83692 | CD99L2 | P8T-E | Human | Esophagus | ESCC | 1.54e-27 | 4.21e-01 | 0.0889 |
| 83692 | CD99L2 | P9T-E | Human | Esophagus | ESCC | 1.75e-17 | 3.40e-01 | 0.1131 |
| 83692 | CD99L2 | P10T-E | Human | Esophagus | ESCC | 4.61e-17 | 2.78e-01 | 0.116 |
| 83692 | CD99L2 | P11T-E | Human | Esophagus | ESCC | 3.14e-10 | 4.57e-01 | 0.1426 |
| 83692 | CD99L2 | P12T-E | Human | Esophagus | ESCC | 7.40e-22 | 3.71e-01 | 0.1122 |
| 83692 | CD99L2 | P15T-E | Human | Esophagus | ESCC | 3.50e-09 | 2.68e-01 | 0.1149 |
| 83692 | CD99L2 | P16T-E | Human | Esophagus | ESCC | 4.59e-08 | 7.67e-02 | 0.1153 |
| 83692 | CD99L2 | P19T-E | Human | Esophagus | ESCC | 5.23e-04 | 3.54e-01 | 0.1662 |
| 83692 | CD99L2 | P20T-E | Human | Esophagus | ESCC | 6.97e-08 | 1.50e-01 | 0.1124 |
| 83692 | CD99L2 | P21T-E | Human | Esophagus | ESCC | 9.29e-06 | 1.17e-01 | 0.1617 |
| 83692 | CD99L2 | P22T-E | Human | Esophagus | ESCC | 3.55e-29 | 5.28e-01 | 0.1236 |
| 83692 | CD99L2 | P23T-E | Human | Esophagus | ESCC | 1.50e-09 | 2.48e-01 | 0.108 |
| 83692 | CD99L2 | P24T-E | Human | Esophagus | ESCC | 2.33e-12 | 1.86e-01 | 0.1287 |
| 83692 | CD99L2 | P26T-E | Human | Esophagus | ESCC | 1.99e-12 | 2.54e-01 | 0.1276 |
| Page: 1 2 3 |
| Tissue | Expression Dynamics | Abbreviation |
| Esophagus | 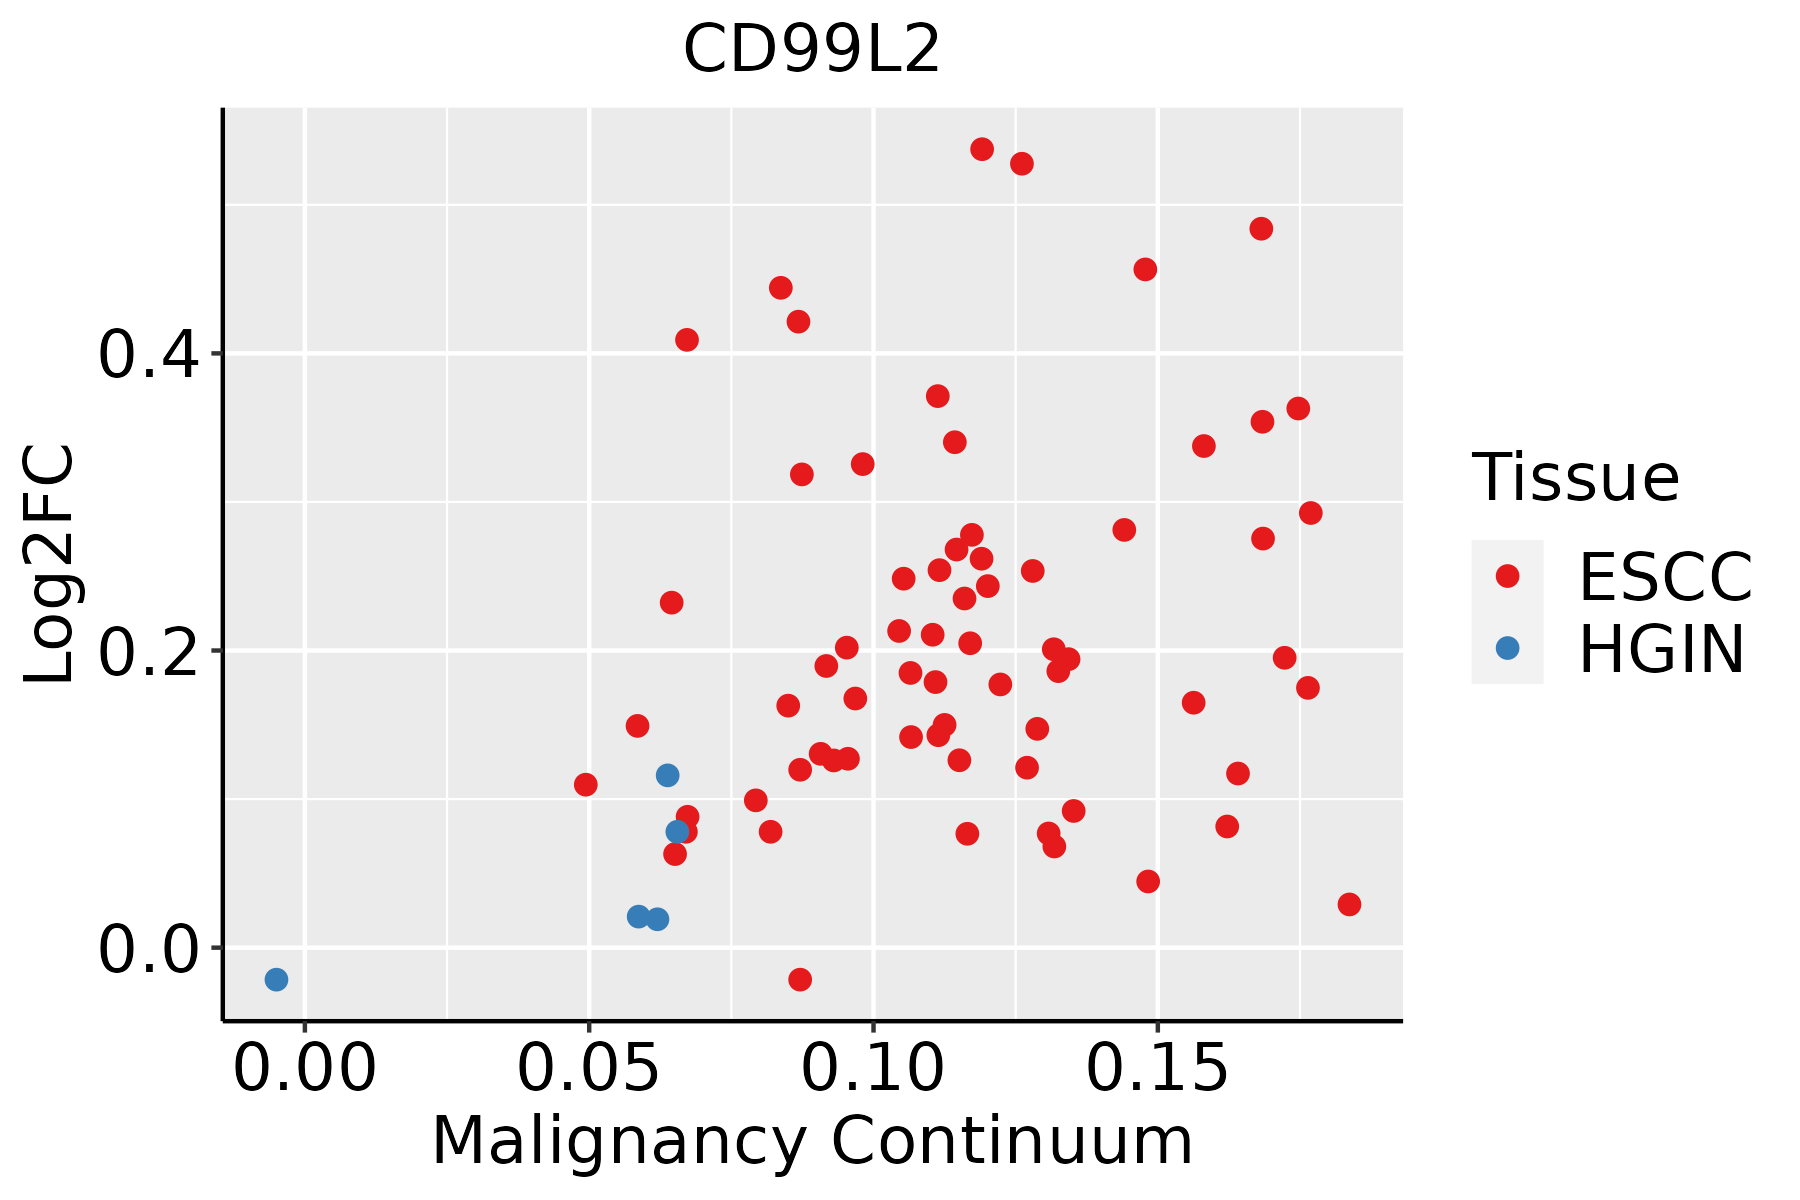 | ESCC: Esophageal squamous cell carcinoma |
| HGIN: High-grade intraepithelial neoplasias | ||
| LGIN: Low-grade intraepithelial neoplasias | ||
| Liver | 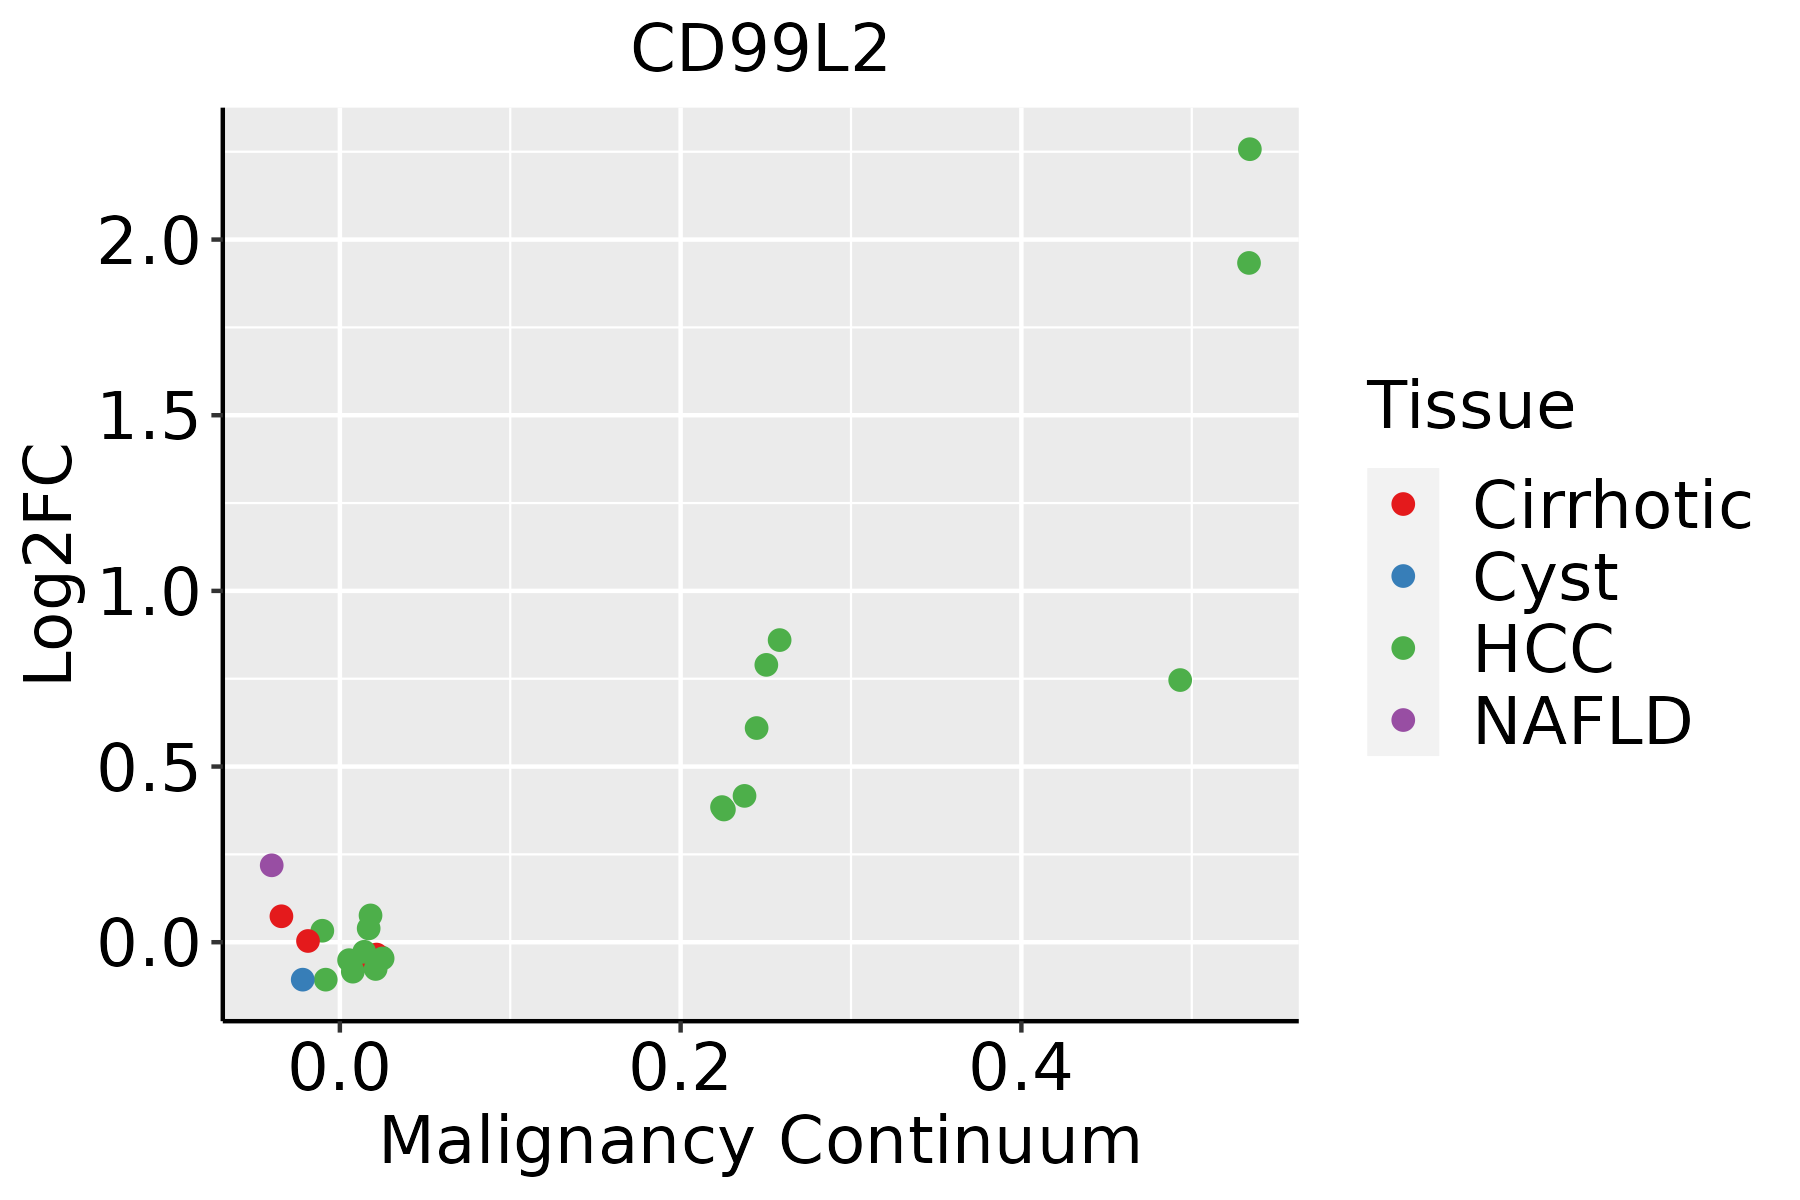 | HCC: Hepatocellular carcinoma |
| NAFLD: Non-alcoholic fatty liver disease |
| ∗log2FC in expression of this searched gene in stem-like cells from each diseased tissue sample relative to stem-like cells in normal samples in each tissue plotted against the malignancy continuum. Samples are colored based on if they are from different disease stage. |
Top |
Malignant transformation related pathway analysis |
| Find out the enriched GO biological processes and KEGG pathways involved in transition from healthy to precancer to cancer |
| Tissue | Disease Stage | Enriched GO biological Processes |
| Colorectum | AD |  |
| Colorectum | SER |  |
| Colorectum | MSS |  |
| Colorectum | MSI-H |  |
| Colorectum | FAP |  |
| ∗Top 15 enriched GO BP terms are showed in the bar plot of each disease state in each tissue. Each row represents a significant GO biological process which is colored according to the -log10(p.adjust). |
| Page: 1 2 3 4 5 6 7 8 9 |
| GO ID | Tissue | Disease Stage | Description | Gene Ratio | Bg Ratio | pvalue | p.adjust | Count |
| Page: 1 |
| Pathway ID | Tissue | Disease Stage | Description | Gene Ratio | Bg Ratio | pvalue | p.adjust | qvalue | Count |
| hsa0467042 | Liver | HCC | Leukocyte transendothelial migration | 68/4020 | 114/8465 | 5.79e-03 | 1.64e-02 | 9.15e-03 | 68 |
| hsa0467052 | Liver | HCC | Leukocyte transendothelial migration | 68/4020 | 114/8465 | 5.79e-03 | 1.64e-02 | 9.15e-03 | 68 |
| Page: 1 |
Top |
Cell-cell communication analysis |
| Identification of potential cell-cell interactions between two cell types and their ligand-receptor pairs for different disease states |
| Ligand | Receptor | LRpair | Pathway | Tissue | Disease Stage |
| CD99 | CD99L2 | CD99_CD99L2 | CD99 | Cervix | CC |
| CD99 | CD99L2 | CD99_CD99L2 | CD99 | CRC | SER |
| CD99 | CD99L2 | CD99_CD99L2 | CD99 | HNSCC | OSCC |
| CD99 | CD99L2 | CD99_CD99L2 | CD99 | Liver | Healthy |
| CD99 | CD99L2 | CD99_CD99L2 | CD99 | Liver | Precancer |
| CD99 | CD99L2 | CD99_CD99L2 | CD99 | Lung | AAH |
| Page: 1 |
Top |
Single-cell gene regulatory network inference analysis |
| Find out the significant the regulons (TFs) and the target genes of each regulon across cell types for different disease states |
| TF | Cell Type | Tissue | Disease Stage | Target Gene | RSS | Regulon Activity |
| ∗The dot plots of a searched regulon are shown for all cell subpopulations in each disease state of each tissue based on the regulon specific score inferred using pySCENIC and by calculating the average expression. |
| Page: 1 |
Top |
Somatic mutation of malignant transformation related genes |
| Annotation of somatic variants for genes involved in malignant transformation |
| Hugo Symbol | Variant Class | Variant Classification | dbSNP RS | HGVSc | HGVSp | HGVSp Short | SWISSPROT | BIOTYPE | SIFT | PolyPhen | Tumor Sample Barcode | Tissue | Histology | Sex | Age | Stage | Therapy Types | Drugs | Outcome |
| CD99L2 | SNV | Missense_Mutation | c.82N>A | p.Asp28Asn | p.D28N | Q8TCZ2 | protein_coding | tolerated(0.26) | benign(0) | TCGA-5L-AAT1-01 | Breast | breast invasive carcinoma | Female | <65 | III/IV | Hormone Therapy | letrozol | SD | |
| CD99L2 | insertion | Nonsense_Mutation | novel | c.203_204insTTAAGCGTAGTGTGGAGTGTGAAACTCTGTCAGTGAACTTT | p.Pro69Ter | p.P69* | Q8TCZ2 | protein_coding | TCGA-A8-A08H-01 | Breast | breast invasive carcinoma | Female | >=65 | I/II | Unknown | Unknown | SD | ||
| CD99L2 | insertion | In_Frame_Ins | novel | c.456_457insTCTCATTCACTGCTTCTTTCTGAA | p.Lys152_Asp153insSerHisSerLeuLeuLeuSerGlu | p.K152_D153insSHSLLLSE | Q8TCZ2 | protein_coding | TCGA-AN-A03X-01 | Breast | breast invasive carcinoma | Female | >=65 | I/II | Unknown | Unknown | SD | ||
| CD99L2 | insertion | Nonsense_Mutation | novel | c.454_455insTTGACTGGTCTCATTCATG | p.Lys152IlefsTer7 | p.K152Ifs*7 | Q8TCZ2 | protein_coding | TCGA-AN-A03X-01 | Breast | breast invasive carcinoma | Female | >=65 | I/II | Unknown | Unknown | SD | ||
| CD99L2 | insertion | In_Frame_Ins | novel | c.612_613insACGGAA | p.Gly204_Ala205insThrGlu | p.G204_A205insTE | Q8TCZ2 | protein_coding | TCGA-B6-A0IN-01 | Breast | breast invasive carcinoma | Female | <65 | I/II | Unknown | Unknown | PD | ||
| CD99L2 | SNV | Missense_Mutation | c.82N>C | p.Asp28His | p.D28H | Q8TCZ2 | protein_coding | deleterious(0.02) | benign(0.206) | TCGA-DG-A2KK-01 | Cervix | cervical & endocervical cancer | Female | <65 | III/IV | Chemotherapy | cisplatin | SD | |
| CD99L2 | SNV | Missense_Mutation | novel | c.379N>A | p.Asp127Asn | p.D127N | Q8TCZ2 | protein_coding | deleterious(0.01) | probably_damaging(0.996) | TCGA-EA-A3Y4-01 | Cervix | cervical & endocervical cancer | Female | <65 | I/II | Unknown | Unknown | SD |
| CD99L2 | SNV | Missense_Mutation | c.434G>A | p.Gly145Glu | p.G145E | Q8TCZ2 | protein_coding | tolerated(0.11) | possibly_damaging(0.906) | TCGA-IR-A3LH-01 | Cervix | cervical & endocervical cancer | Female | <65 | I/II | Chemotherapy | cisplatin | CR | |
| CD99L2 | SNV | Missense_Mutation | rs146802752 | c.404N>A | p.Arg135Gln | p.R135Q | Q8TCZ2 | protein_coding | tolerated(0.39) | benign(0) | TCGA-AA-A00N-01 | Colorectum | colon adenocarcinoma | Male | >=65 | I/II | Unknown | Unknown | PD |
| CD99L2 | SNV | Missense_Mutation | rs189223919 | c.314N>T | p.Thr105Met | p.T105M | Q8TCZ2 | protein_coding | deleterious(0) | probably_damaging(0.997) | TCGA-AD-6895-01 | Colorectum | colon adenocarcinoma | Male | >=65 | III/IV | Unknown | Unknown | SD |
| Page: 1 2 3 4 |
Top |
Related drugs of malignant transformation related genes |
| Identification of chemicals and drugs interact with genes involved in malignant transfromation |
| (DGIdb 4.0) |
| Entrez ID | Symbol | Category | Interaction Types | Drug Claim Name | Drug Name | PMIDs |
| Page: 1 |

Copyright 2023-Present -The University of Texas Health Science Center at Houston |