
|
|||||
|
 | |
| |
| |
| |
| |
| |
|
Gene: CD96 |
Gene summary for CD96 |
| Gene information | Species | Human | Gene symbol | CD96 | Gene ID | 10225 |
| Gene name | CD96 molecule | |
| Gene Alias | TACTILE | |
| Cytomap | 3q13.13-q13.2 | |
| Gene Type | protein-coding | GO ID | GO:0001816 | UniProtAcc | Q8WUE2 |
Top |
Malignant transformation analysis |
| Identification of the aberrant gene expression in precancerous and cancerous lesions by comparing the gene expression of stem-like cells in diseased tissues with normal stem cells |
| Entrez ID | Symbol | Replicates | Species | Organ | Tissue | Adj P-value | Log2FC | Malignancy |
| 10225 | CD96 | LZE4T | Human | Esophagus | ESCC | 3.78e-08 | 2.82e-01 | 0.0811 |
| 10225 | CD96 | LZE7T | Human | Esophagus | ESCC | 1.40e-08 | 4.84e-01 | 0.0667 |
| 10225 | CD96 | LZE22D1 | Human | Esophagus | HGIN | 3.26e-02 | 1.74e-01 | 0.0595 |
| 10225 | CD96 | LZE6T | Human | Esophagus | ESCC | 1.60e-16 | 6.43e-01 | 0.0845 |
| 10225 | CD96 | P56T-E | Human | Esophagus | ESCC | 1.16e-08 | 9.65e-01 | 0.1613 |
| 10225 | CD96 | P62T-E | Human | Esophagus | ESCC | 1.21e-03 | 9.80e-02 | 0.1302 |
| 10225 | CD96 | P80T-E | Human | Esophagus | ESCC | 3.16e-03 | 1.34e-01 | 0.155 |
| 10225 | CD96 | HCC1 | Human | Liver | HCC | 2.88e-03 | 1.43e+00 | 0.5336 |
| 10225 | CD96 | HCC2 | Human | Liver | HCC | 4.10e-12 | 1.18e+00 | 0.5341 |
| 10225 | CD96 | HCC5 | Human | Liver | HCC | 1.49e-08 | 1.65e+00 | 0.4932 |
| Page: 1 |
| Tissue | Expression Dynamics | Abbreviation |
| Esophagus | 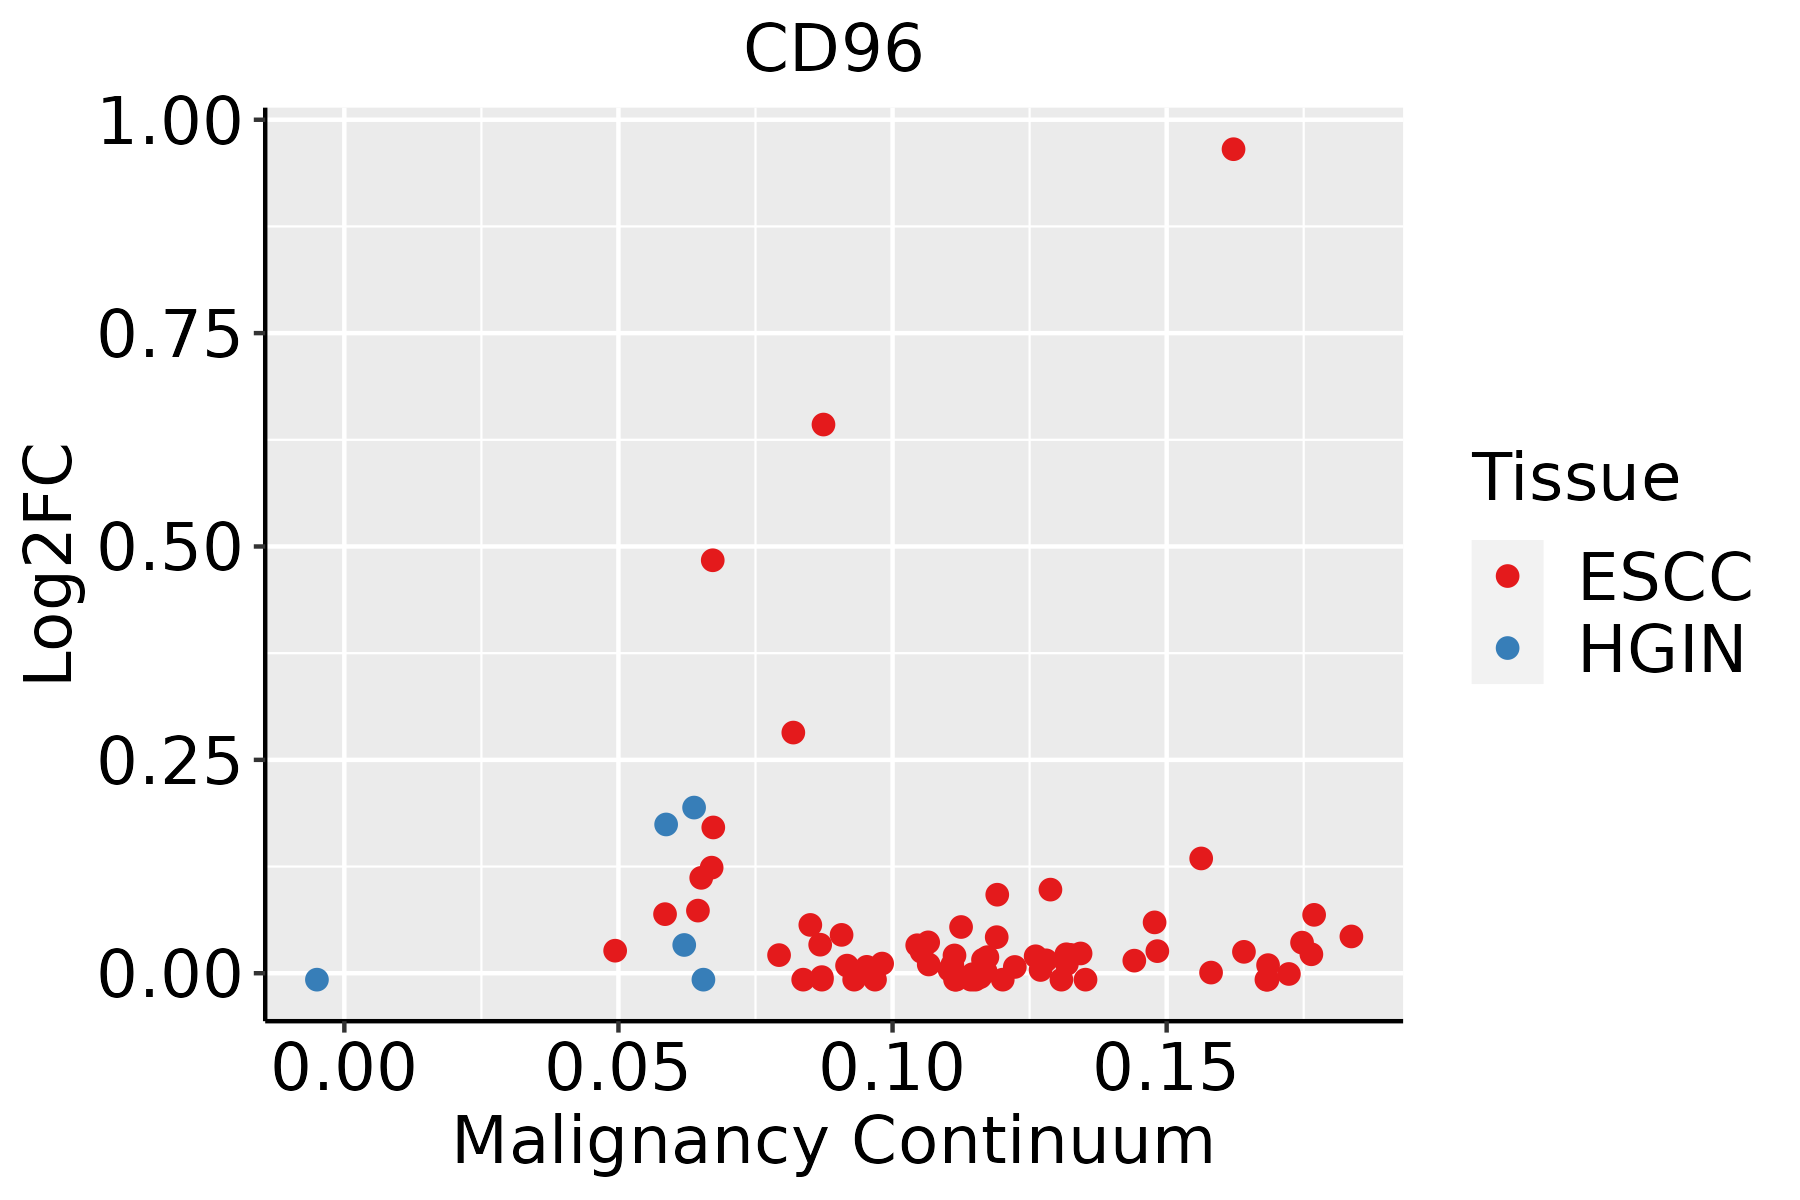 | ESCC: Esophageal squamous cell carcinoma |
| HGIN: High-grade intraepithelial neoplasias | ||
| LGIN: Low-grade intraepithelial neoplasias | ||
| Liver | 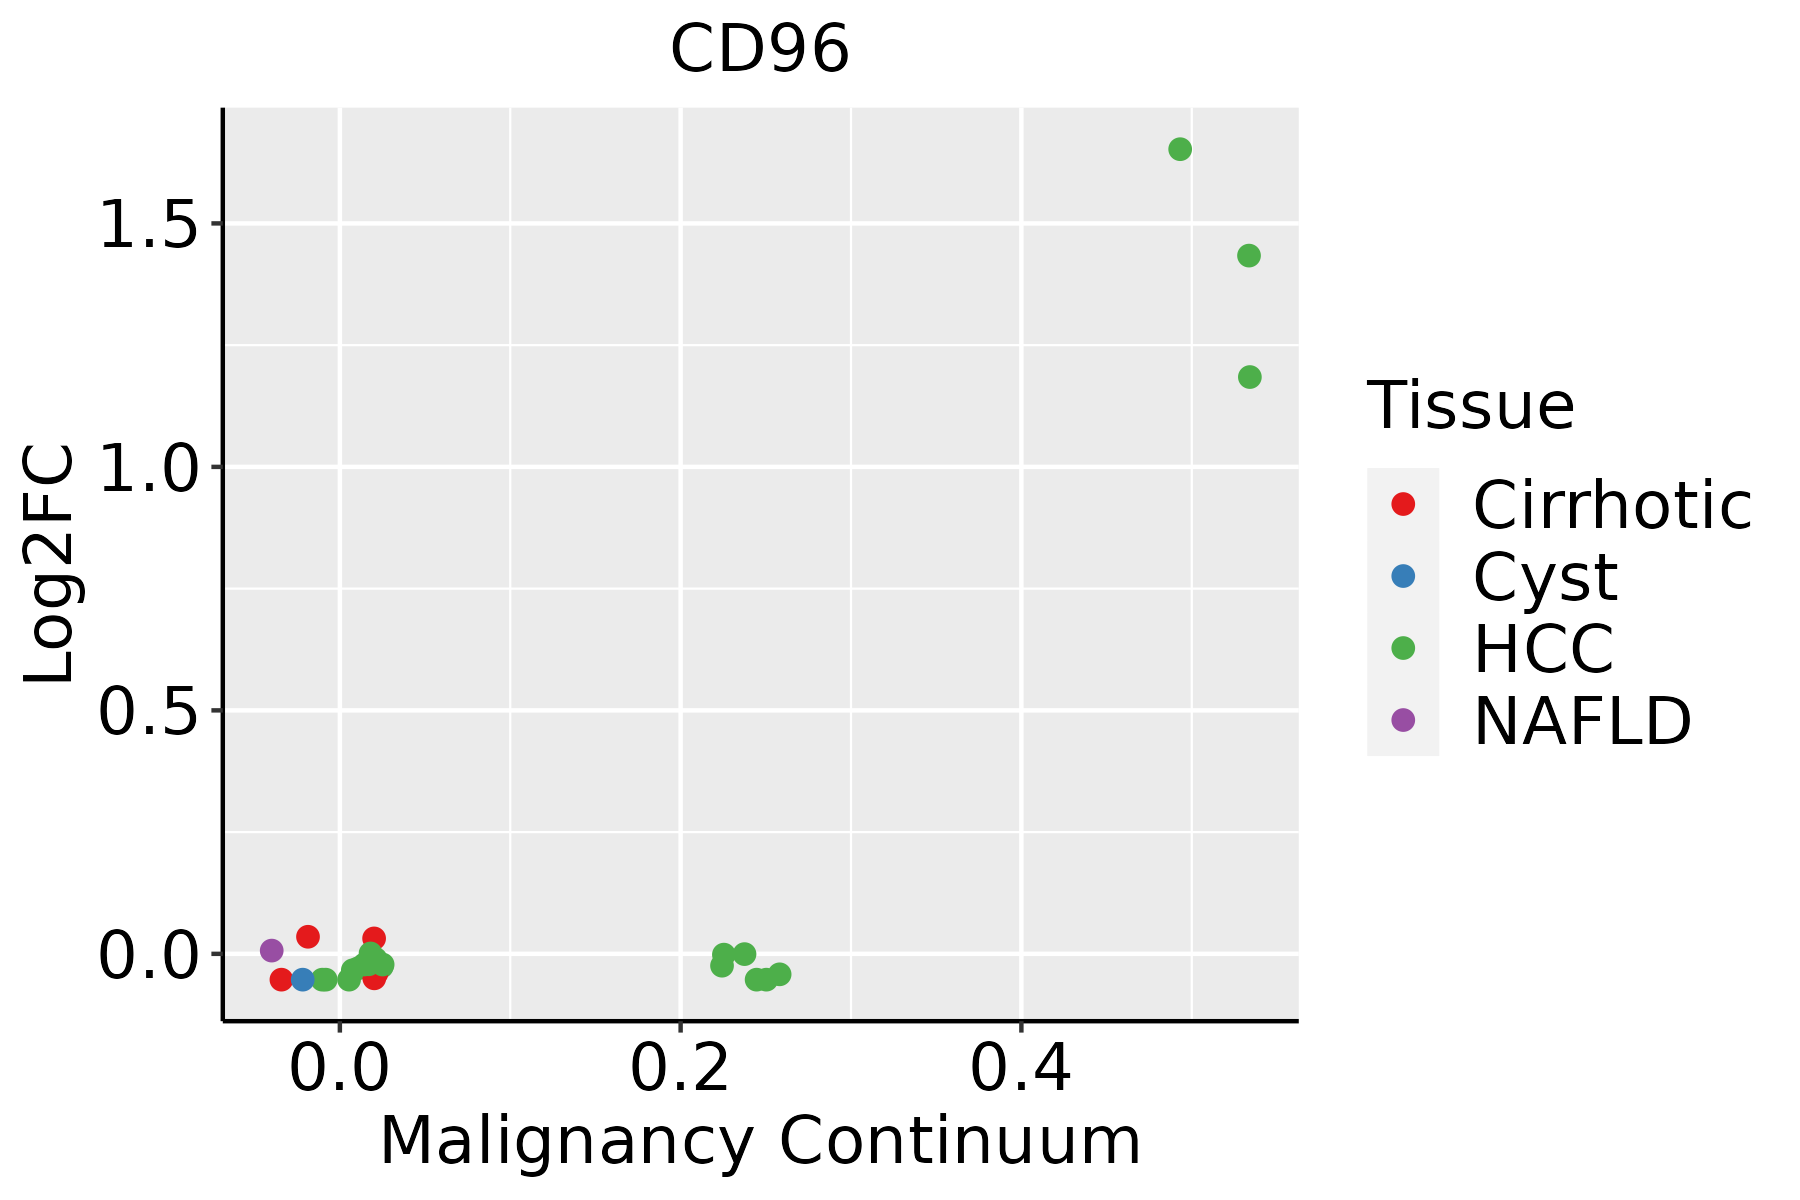 | HCC: Hepatocellular carcinoma |
| NAFLD: Non-alcoholic fatty liver disease |
| ∗log2FC in expression of this searched gene in stem-like cells from each diseased tissue sample relative to stem-like cells in normal samples in each tissue plotted against the malignancy continuum. Samples are colored based on if they are from different disease stage. |
Top |
Malignant transformation related pathway analysis |
| Find out the enriched GO biological processes and KEGG pathways involved in transition from healthy to precancer to cancer |
| Tissue | Disease Stage | Enriched GO biological Processes |
| Colorectum | AD |  |
| Colorectum | SER |  |
| Colorectum | MSS |  |
| Colorectum | MSI-H |  |
| Colorectum | FAP |  |
| ∗Top 15 enriched GO BP terms are showed in the bar plot of each disease state in each tissue. Each row represents a significant GO biological process which is colored according to the -log10(p.adjust). |
| Page: 1 2 3 4 5 6 7 8 9 |
| GO ID | Tissue | Disease Stage | Description | Gene Ratio | Bg Ratio | pvalue | p.adjust | Count |
| GO:00028325 | Esophagus | HGIN | negative regulation of response to biotic stimulus | 25/2587 | 108/18723 | 5.87e-03 | 4.77e-02 | 25 |
| GO:003158919 | Esophagus | ESCC | cell-substrate adhesion | 221/8552 | 363/18723 | 3.06e-09 | 6.62e-08 | 221 |
| GO:00028318 | Esophagus | ESCC | regulation of response to biotic stimulus | 191/8552 | 327/18723 | 2.12e-06 | 2.45e-05 | 191 |
| GO:000716018 | Esophagus | ESCC | cell-matrix adhesion | 141/8552 | 233/18723 | 3.33e-06 | 3.71e-05 | 141 |
| GO:000283212 | Esophagus | ESCC | negative regulation of response to biotic stimulus | 72/8552 | 108/18723 | 8.36e-06 | 8.11e-05 | 72 |
| GO:003249619 | Esophagus | ESCC | response to lipopolysaccharide | 191/8552 | 343/18723 | 1.11e-04 | 7.73e-04 | 191 |
| GO:00450885 | Esophagus | ESCC | regulation of innate immune response | 125/8552 | 218/18723 | 3.34e-04 | 1.96e-03 | 125 |
| GO:00507775 | Esophagus | ESCC | negative regulation of immune response | 112/8552 | 194/18723 | 4.67e-04 | 2.62e-03 | 112 |
| GO:000268316 | Esophagus | ESCC | negative regulation of immune system process | 231/8552 | 434/18723 | 8.48e-04 | 4.36e-03 | 231 |
| GO:000223719 | Esophagus | ESCC | response to molecule of bacterial origin | 194/8552 | 363/18723 | 1.64e-03 | 7.61e-03 | 194 |
| GO:00458245 | Esophagus | ESCC | negative regulation of innate immune response | 45/8552 | 71/18723 | 1.98e-03 | 8.90e-03 | 45 |
| GO:00028321 | Liver | HCC | negative regulation of response to biotic stimulus | 66/7958 | 108/18723 | 7.24e-05 | 6.50e-04 | 66 |
| GO:00028312 | Liver | HCC | regulation of response to biotic stimulus | 173/7958 | 327/18723 | 8.55e-05 | 7.48e-04 | 173 |
| GO:003158922 | Liver | HCC | cell-substrate adhesion | 188/7958 | 363/18723 | 2.00e-04 | 1.55e-03 | 188 |
| GO:000716021 | Liver | HCC | cell-matrix adhesion | 123/7958 | 233/18723 | 9.34e-04 | 5.47e-03 | 123 |
| GO:003249611 | Liver | HCC | response to lipopolysaccharide | 174/7958 | 343/18723 | 1.19e-03 | 6.62e-03 | 174 |
| GO:000223711 | Liver | HCC | response to molecule of bacterial origin | 181/7958 | 363/18723 | 2.58e-03 | 1.24e-02 | 181 |
| GO:00450881 | Liver | HCC | regulation of innate immune response | 113/7958 | 218/18723 | 3.27e-03 | 1.50e-02 | 113 |
| GO:00458241 | Liver | HCC | negative regulation of innate immune response | 42/7958 | 71/18723 | 3.41e-03 | 1.55e-02 | 42 |
| GO:0050777 | Liver | HCC | negative regulation of immune response | 101/7958 | 194/18723 | 4.40e-03 | 1.90e-02 | 101 |
| Page: 1 |
| Pathway ID | Tissue | Disease Stage | Description | Gene Ratio | Bg Ratio | pvalue | p.adjust | qvalue | Count |
| Page: 1 |
Top |
Cell-cell communication analysis |
| Identification of potential cell-cell interactions between two cell types and their ligand-receptor pairs for different disease states |
| Ligand | Receptor | LRpair | Pathway | Tissue | Disease Stage |
| CD96 | PVR | CD96_PVR | CD96 | Breast | ADJ |
| CD96 | PVR | CD96_PVR | CD96 | Breast | Healthy |
| NECTIN1 | CD96 | NECTIN1_CD96 | NECTIN | Cervix | CC |
| CD96 | NECTIN1 | CD96_NECTIN1 | CD96 | Cervix | CC |
| NECTIN1 | CD96 | NECTIN1_CD96 | NECTIN | CRC | AD |
| CD96 | NECTIN1 | CD96_NECTIN1 | CD96 | CRC | AD |
| NECTIN1 | CD96 | NECTIN1_CD96 | NECTIN | CRC | MSI-H |
| CD96 | NECTIN1 | CD96_NECTIN1 | CD96 | CRC | MSI-H |
| CD96 | PVR | CD96_PVR | CD96 | CRC | MSI-H |
| NECTIN1 | CD96 | NECTIN1_CD96 | NECTIN | CRC | MSS |
| CD96 | NECTIN1 | CD96_NECTIN1 | CD96 | CRC | MSS |
| CD96 | PVR | CD96_PVR | CD96 | HNSCC | OSCC |
| CD96 | PVR | CD96_PVR | CD96 | HNSCC | Precancer |
| CD96 | PVR | CD96_PVR | CD96 | Liver | Precancer |
| NECTIN1 | CD96 | NECTIN1_CD96 | NECTIN | Prostate | BPH |
| CD96 | NECTIN1 | CD96_NECTIN1 | CD96 | Prostate | BPH |
| CD96 | PVR | CD96_PVR | CD96 | Prostate | BPH |
| NECTIN1 | CD96 | NECTIN1_CD96 | NECTIN | Prostate | Healthy |
| CD96 | NECTIN1 | CD96_NECTIN1 | CD96 | Prostate | Healthy |
| NECTIN1 | CD96 | NECTIN1_CD96 | NECTIN | Skin | ADJ |
| Page: 1 |
Top |
Single-cell gene regulatory network inference analysis |
| Find out the significant the regulons (TFs) and the target genes of each regulon across cell types for different disease states |
| TF | Cell Type | Tissue | Disease Stage | Target Gene | RSS | Regulon Activity |
| ∗The dot plots of a searched regulon are shown for all cell subpopulations in each disease state of each tissue based on the regulon specific score inferred using pySCENIC and by calculating the average expression. |
| Page: 1 |
Top |
Somatic mutation of malignant transformation related genes |
| Annotation of somatic variants for genes involved in malignant transformation |
| Hugo Symbol | Variant Class | Variant Classification | dbSNP RS | HGVSc | HGVSp | HGVSp Short | SWISSPROT | BIOTYPE | SIFT | PolyPhen | Tumor Sample Barcode | Tissue | Histology | Sex | Age | Stage | Therapy Types | Drugs | Outcome |
| CD96 | SNV | Missense_Mutation | c.1178N>G | p.Glu393Gly | p.E393G | P40200 | protein_coding | tolerated(0.28) | benign(0.003) | TCGA-AN-A0AK-01 | Breast | breast invasive carcinoma | Female | >=65 | I/II | Unknown | Unknown | SD | |
| CD96 | SNV | Missense_Mutation | c.460N>A | p.Glu154Lys | p.E154K | P40200 | protein_coding | tolerated(0.37) | benign(0.03) | TCGA-D8-A1J8-01 | Breast | breast invasive carcinoma | Female | >=65 | I/II | Hormone Therapy | nolvadex | SD | |
| CD96 | SNV | Missense_Mutation | rs119477056 | c.839N>A | p.Thr280Lys | p.T280K | P40200 | protein_coding | tolerated(0.17) | benign(0.009) | TCGA-E2-A1B4-01 | Breast | breast invasive carcinoma | Female | >=65 | III/IV | Hormone Therapy | arimidex | SD |
| CD96 | SNV | Missense_Mutation | c.1025N>T | p.Ser342Ile | p.S342I | P40200 | protein_coding | tolerated(0.29) | benign(0.001) | TCGA-GI-A2C8-01 | Breast | breast invasive carcinoma | Female | <65 | III/IV | Unspecific | Adriamycin | SD | |
| CD96 | deletion | Frame_Shift_Del | novel | c.250delN | p.Cys85ValfsTer5 | p.C85Vfs*5 | P40200 | protein_coding | TCGA-D8-A27V-01 | Breast | breast invasive carcinoma | Female | <65 | I/II | Hormone Therapy | tamoxiphen | SD | ||
| CD96 | SNV | Missense_Mutation | c.895G>A | p.Ala299Thr | p.A299T | P40200 | protein_coding | deleterious(0.02) | probably_damaging(0.999) | TCGA-2W-A8YY-01 | Cervix | cervical & endocervical cancer | Female | <65 | I/II | Chemotherapy | cisplatin | CR | |
| CD96 | SNV | Missense_Mutation | rs374177461 | c.1322N>A | p.Arg441Gln | p.R441Q | P40200 | protein_coding | tolerated(1) | benign(0) | TCGA-VS-A959-01 | Cervix | cervical & endocervical cancer | Female | >=65 | I/II | Unknown | Unknown | SD |
| CD96 | SNV | Missense_Mutation | c.1129N>A | p.Leu377Ile | p.L377I | P40200 | protein_coding | tolerated(0.08) | benign(0.015) | TCGA-AA-3510-01 | Colorectum | colon adenocarcinoma | Male | >=65 | I/II | Unknown | Unknown | SD | |
| CD96 | SNV | Missense_Mutation | c.1753C>A | p.Leu585Ile | p.L585I | P40200 | protein_coding | deleterious(0) | possibly_damaging(0.891) | TCGA-AA-3712-01 | Colorectum | colon adenocarcinoma | Male | >=65 | III/IV | Unknown | Unknown | SD | |
| CD96 | SNV | Missense_Mutation | c.1336N>T | p.Pro446Ser | p.P446S | P40200 | protein_coding | tolerated(1) | benign(0) | TCGA-AA-3852-01 | Colorectum | colon adenocarcinoma | Male | >=65 | I/II | Unknown | Unknown | PD |
| Page: 1 2 3 4 5 6 7 |
Top |
Related drugs of malignant transformation related genes |
| Identification of chemicals and drugs interact with genes involved in malignant transfromation |
| (DGIdb 4.0) |
| Entrez ID | Symbol | Category | Interaction Types | Drug Claim Name | Drug Name | PMIDs |
| Page: 1 |

Copyright 2023-Present -The University of Texas Health Science Center at Houston |