| Tissue | Expression Dynamics | Abbreviation |
| Breast | 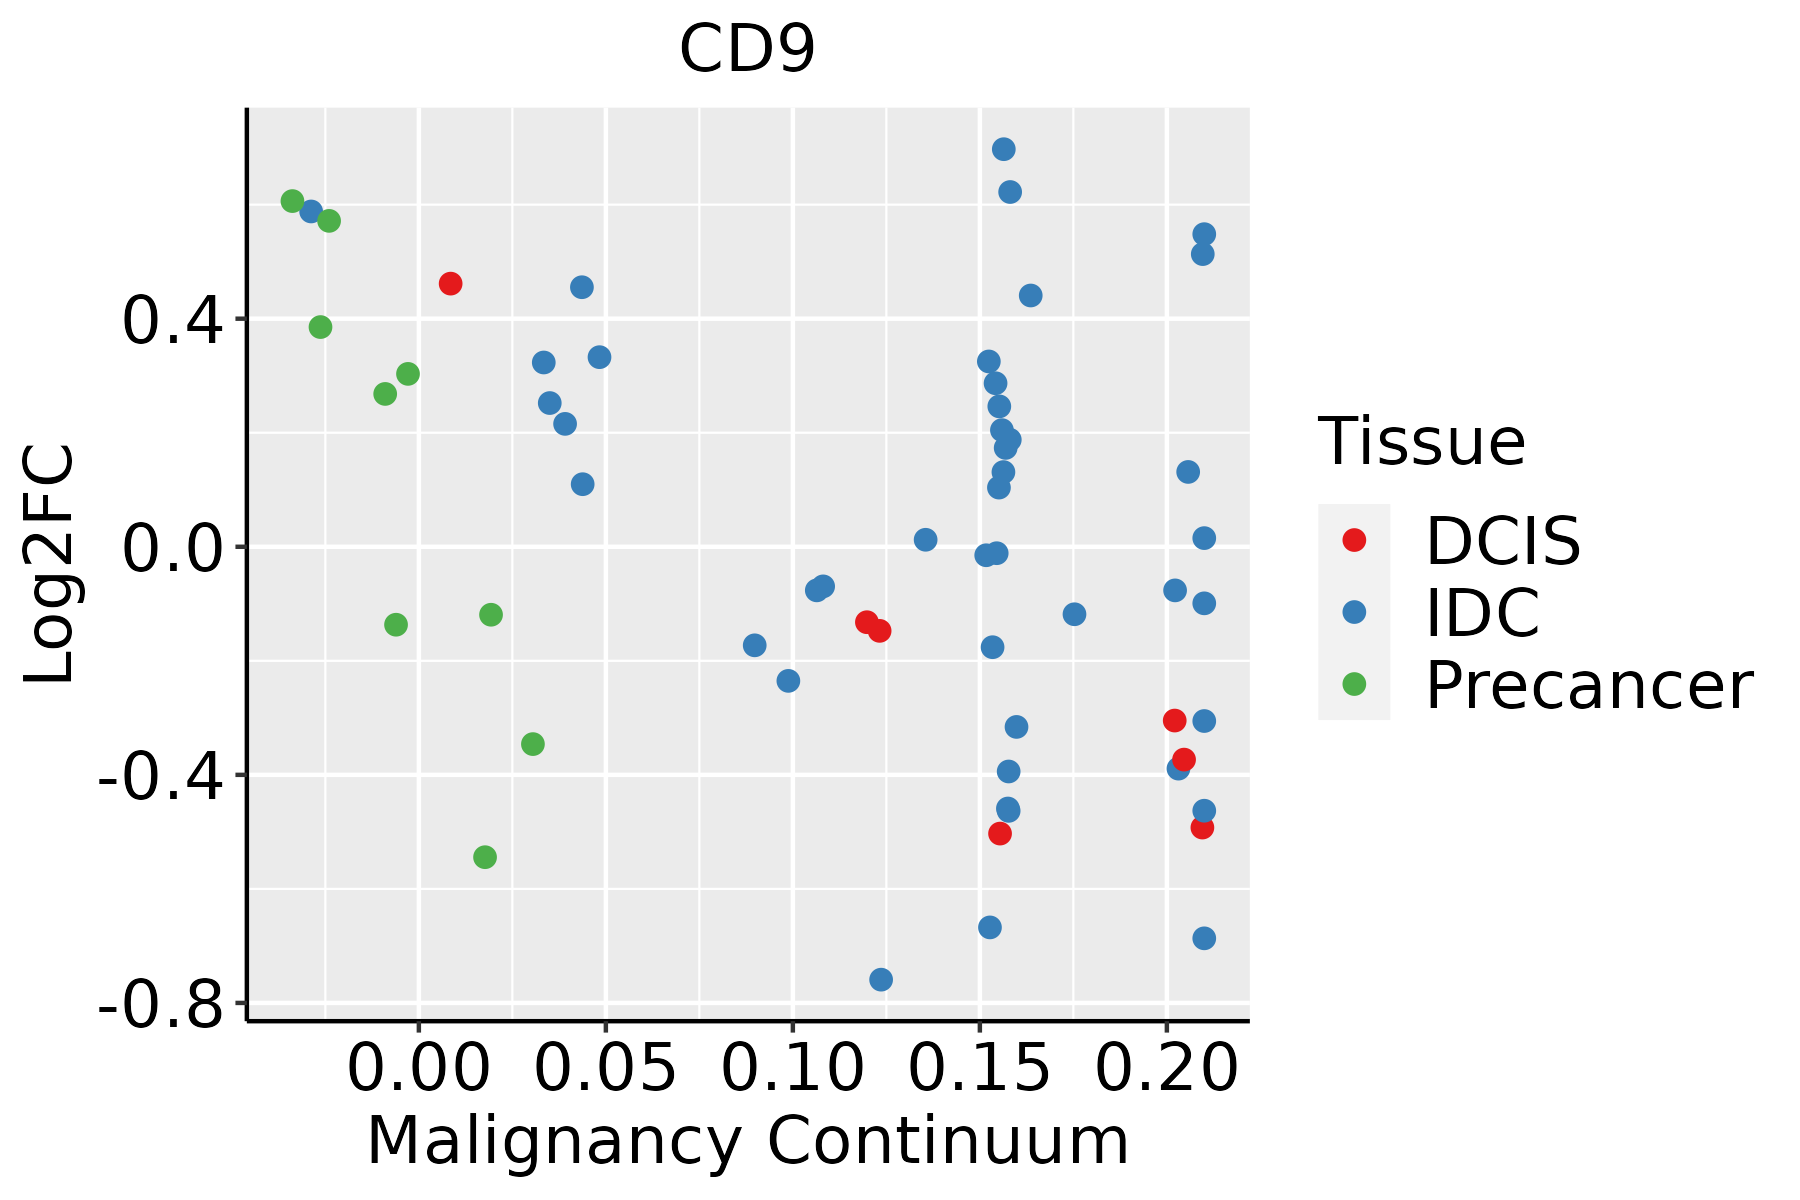 | IDC: Invasive ductal carcinoma |
| DCIS: Ductal carcinoma in situ |
| Precancer(BRCA1-mut): Precancerous lesion from BRCA1 mutation carriers |
| Cervix | 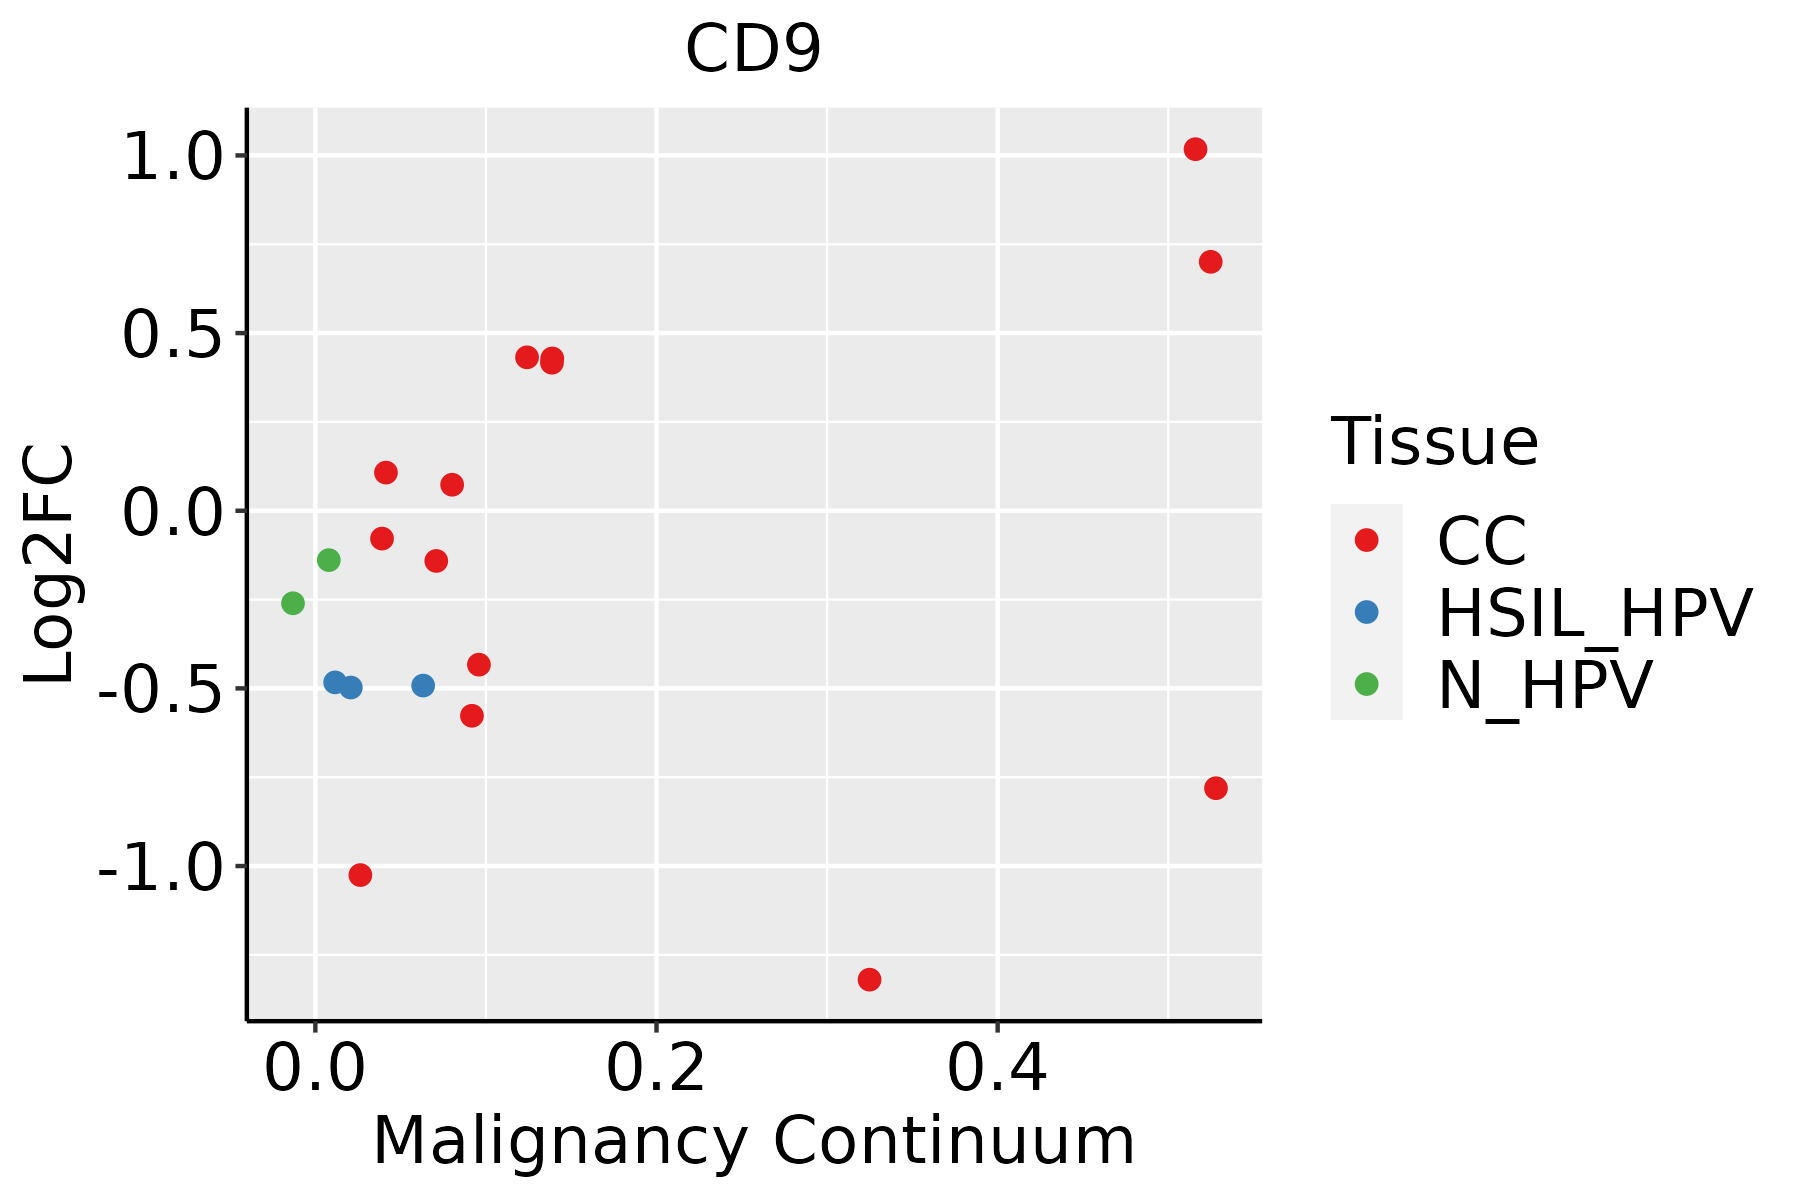 | CC: Cervix cancer |
| HSIL_HPV: HPV-infected high-grade squamous intraepithelial lesions |
| N_HPV: HPV-infected normal cervix |
| Colorectum (GSE201348) |  | FAP: Familial adenomatous polyposis |
| CRC: Colorectal cancer |
| Colorectum (HTA11) |  | AD: Adenomas |
| SER: Sessile serrated lesions |
| MSI-H: Microsatellite-high colorectal cancer |
| MSS: Microsatellite stable colorectal cancer |
| Endometrium | 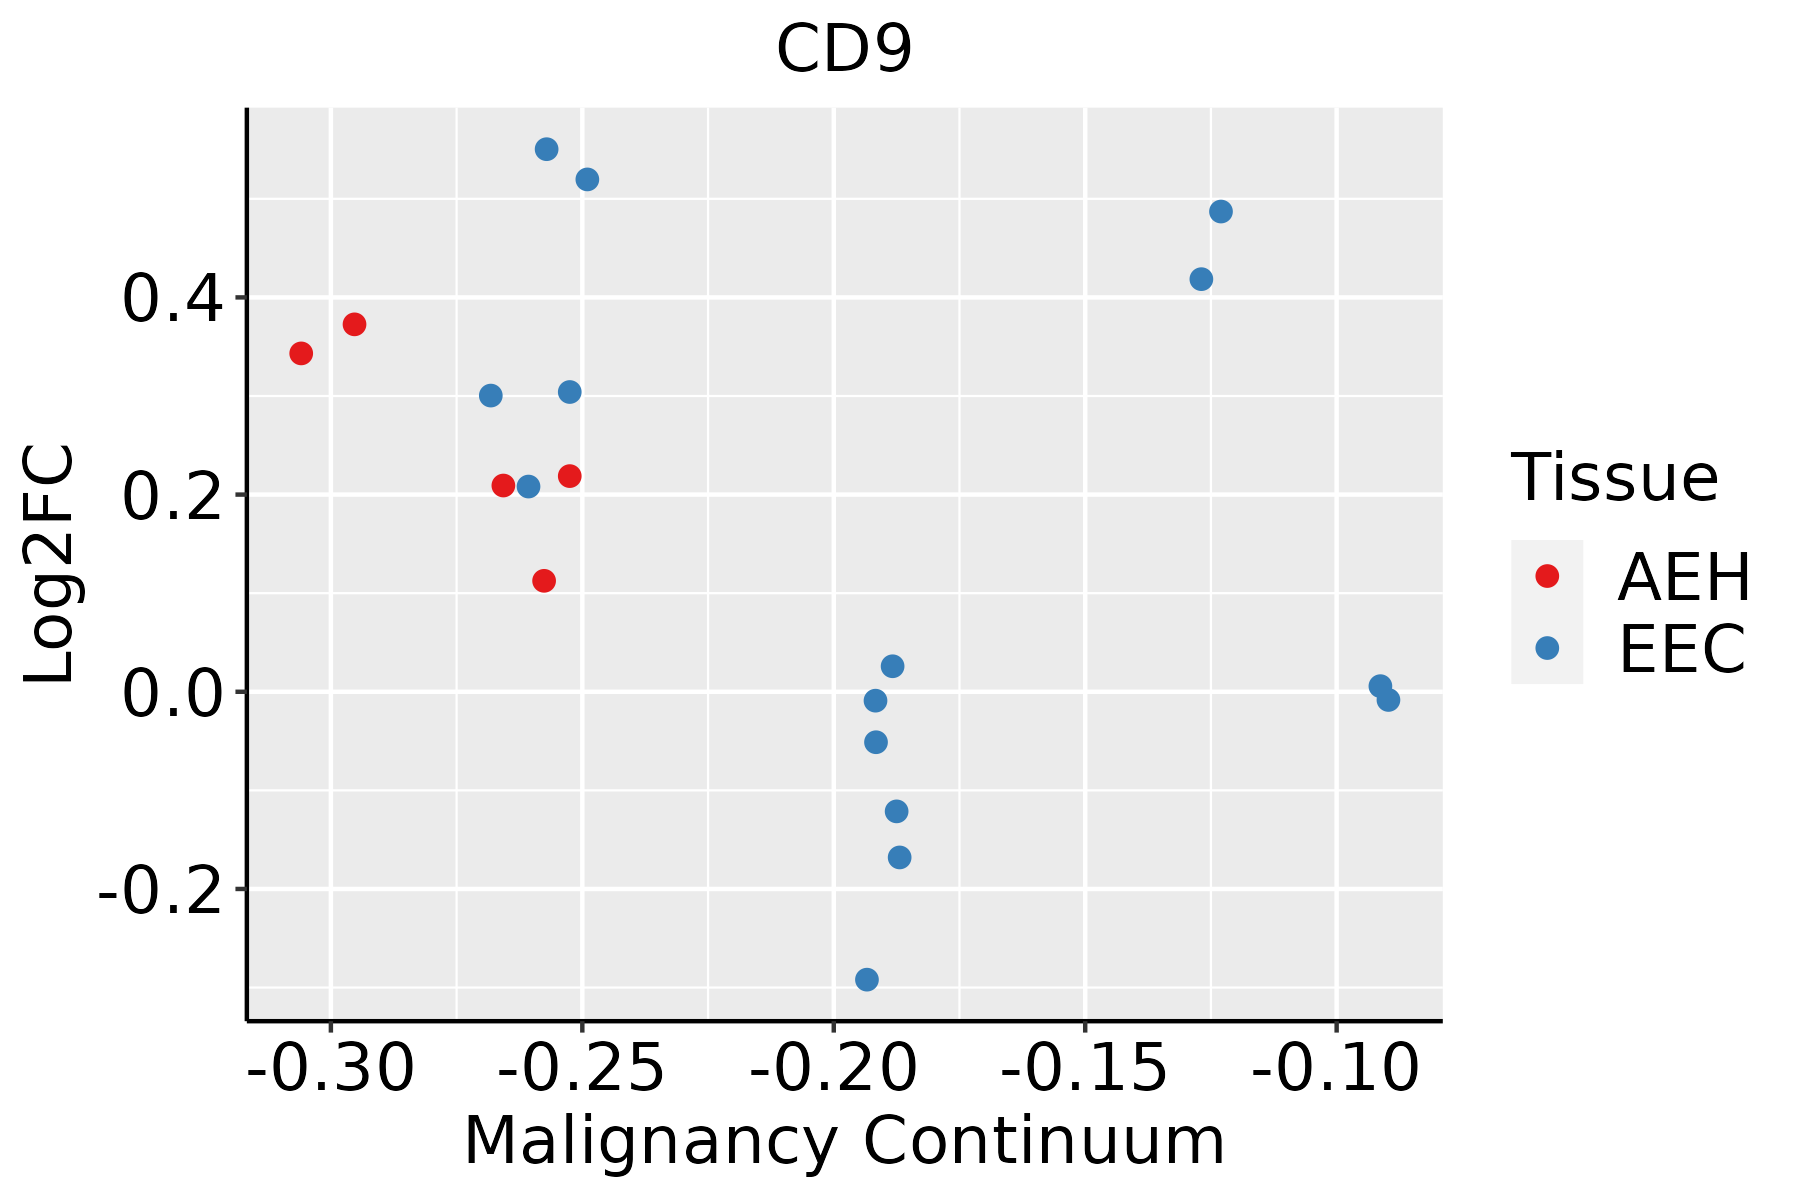 | AEH: Atypical endometrial hyperplasia |
| EEC: Endometrioid Cancer |
| Esophagus | 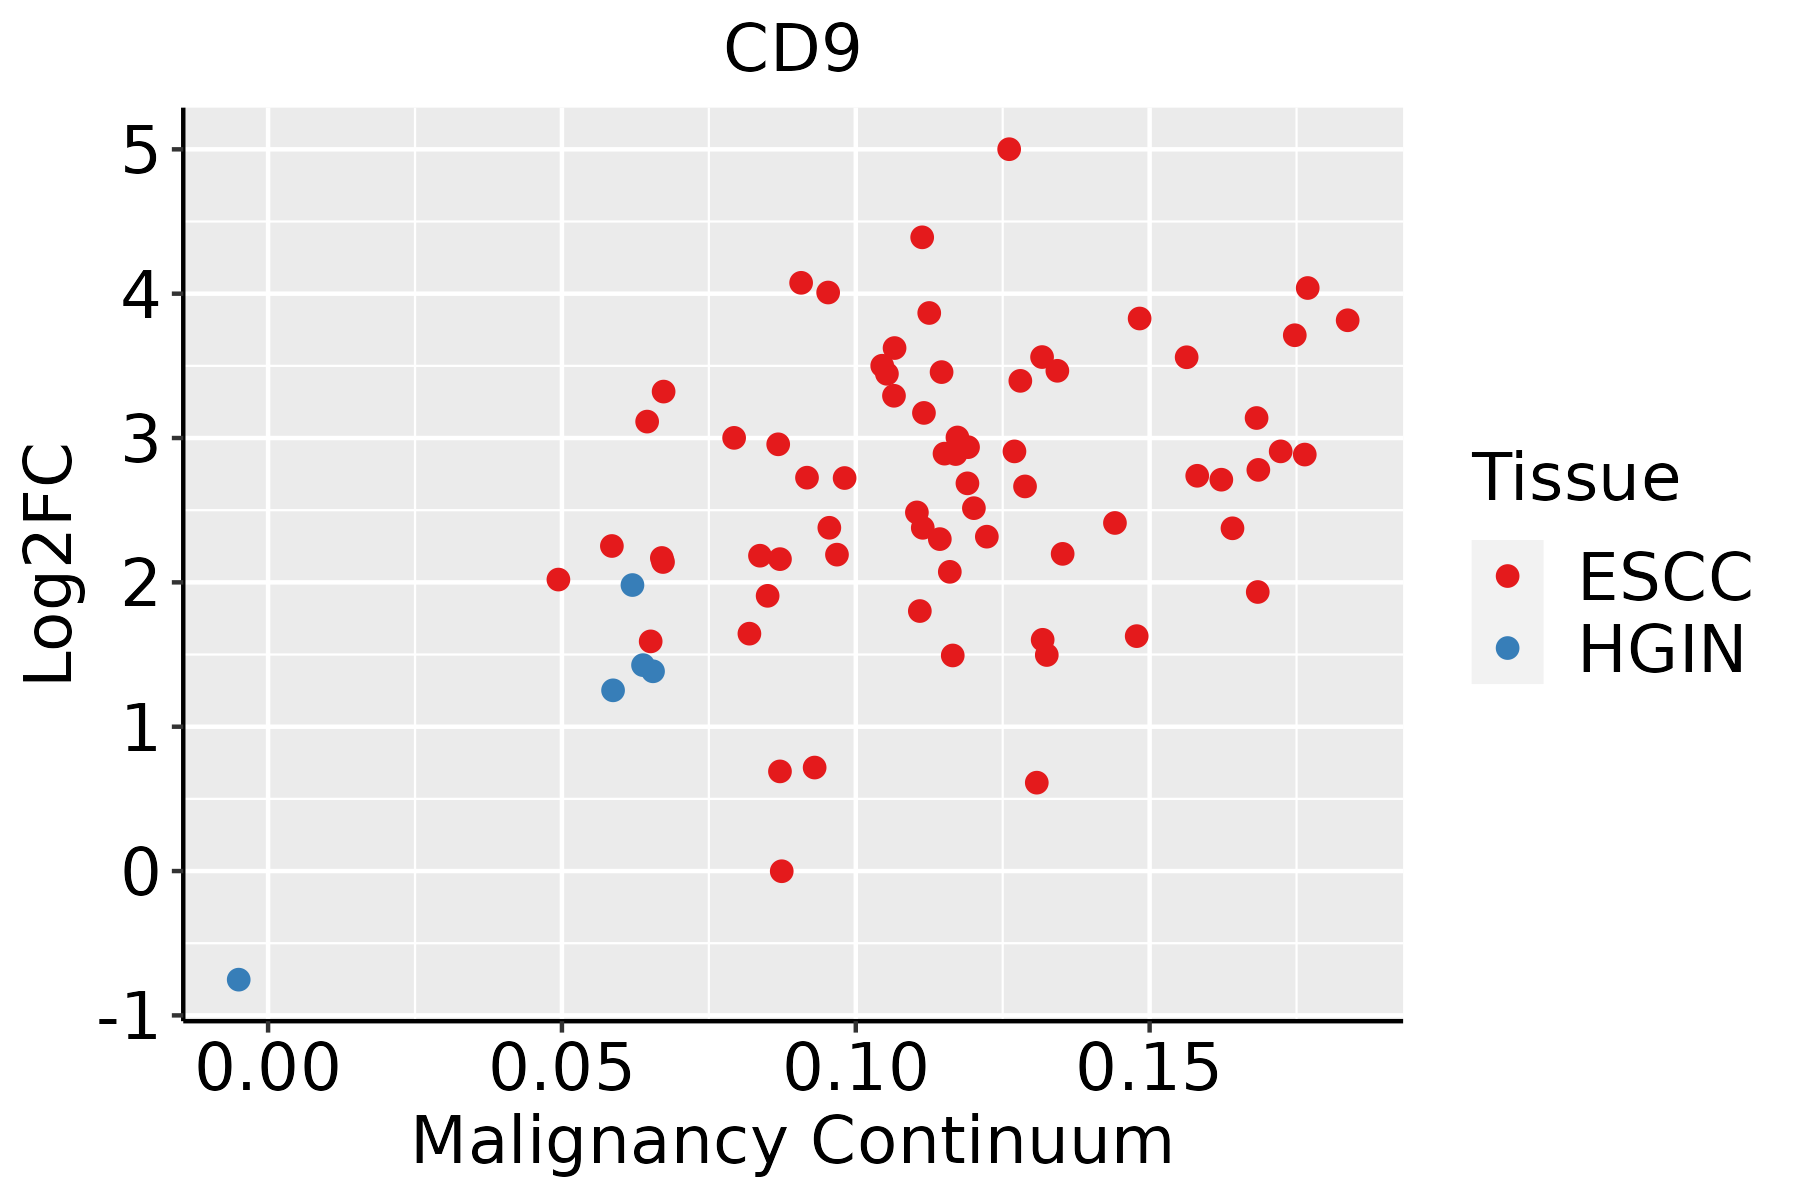 | ESCC: Esophageal squamous cell carcinoma |
| HGIN: High-grade intraepithelial neoplasias |
| LGIN: Low-grade intraepithelial neoplasias |
| GC | 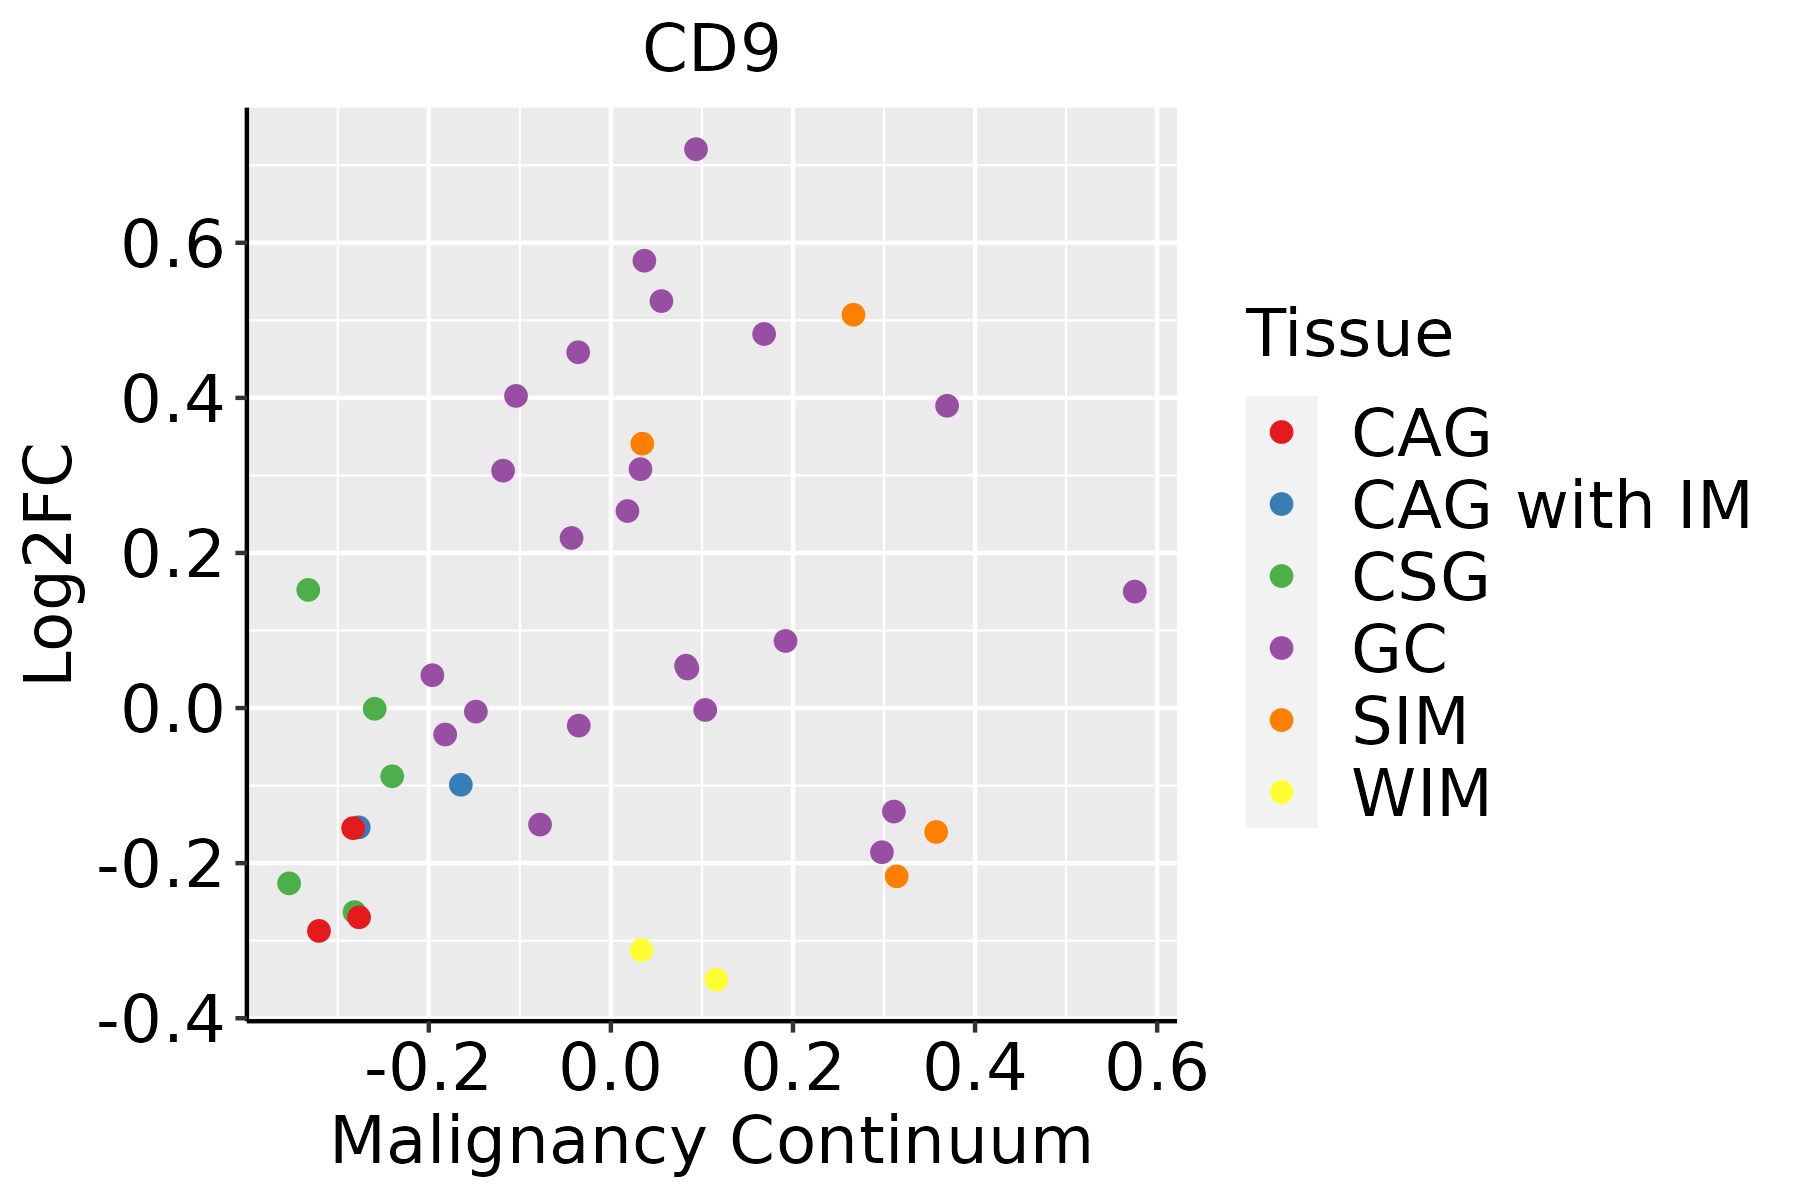 | CAG: Chronic atrophic gastritis |
| CAG with IM: Chronic atrophic gastritis with intestinal metaplasia |
| CSG: Chronic superficial gastritis |
| GC: Gastric cancer |
| SIM: Severe intestinal metaplasia |
| WIM: Wild intestinal metaplasia |
| Liver | 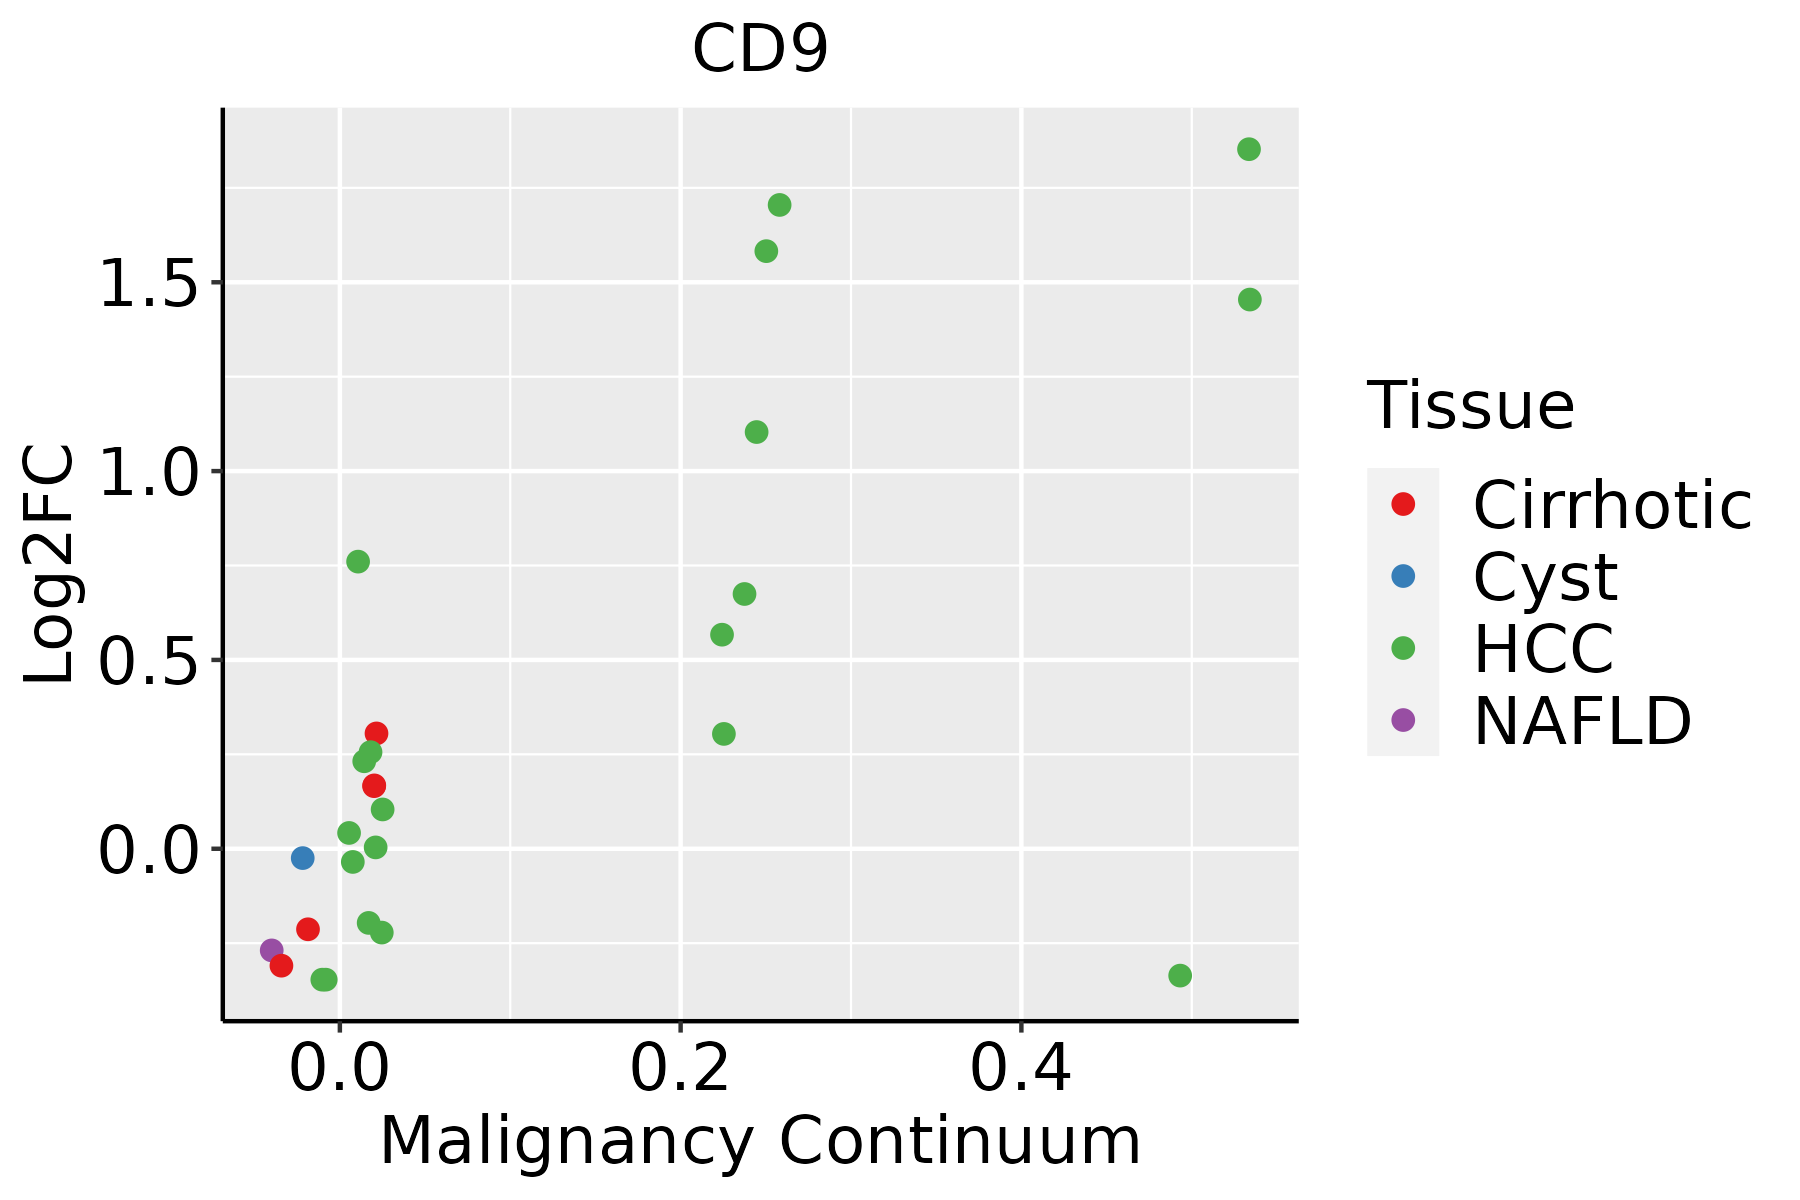 | HCC: Hepatocellular carcinoma |
| NAFLD: Non-alcoholic fatty liver disease |
| Lung | 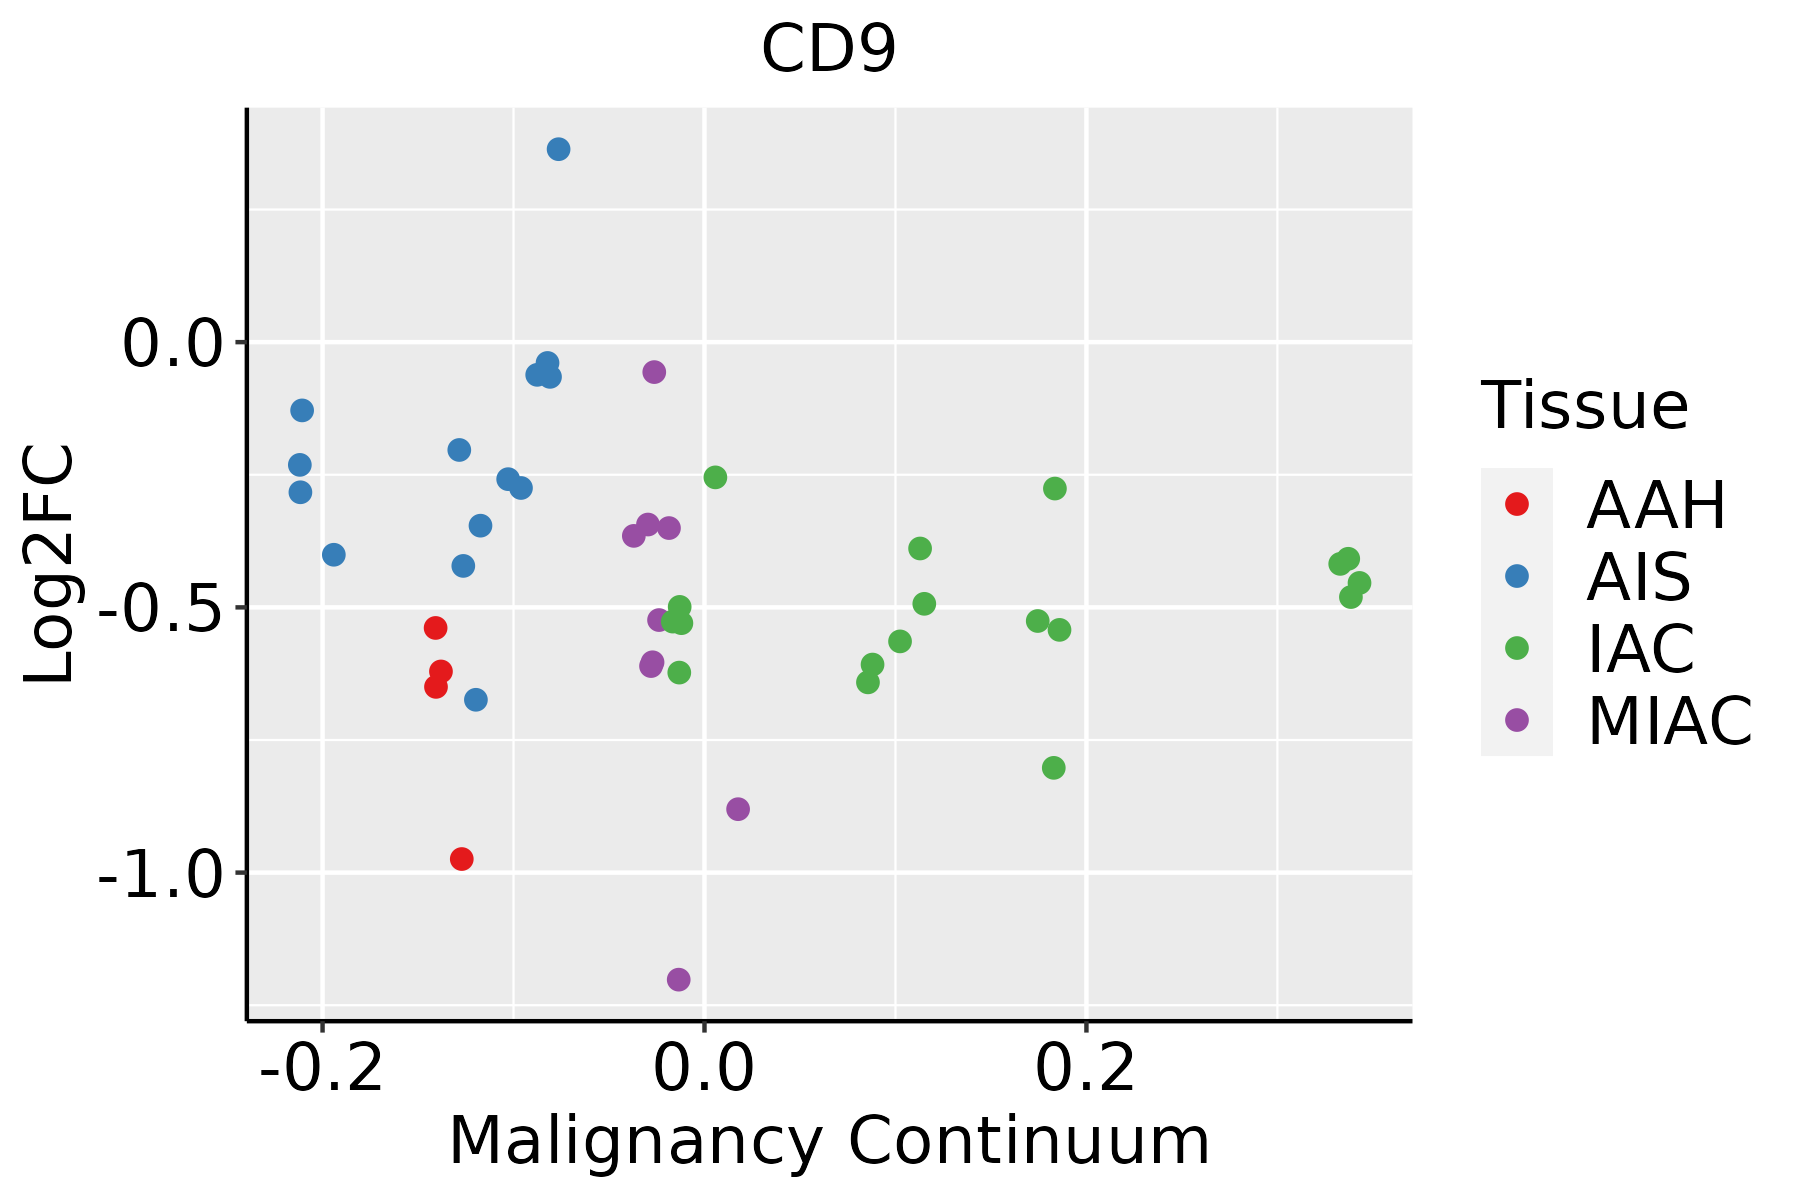 | AAH: Atypical adenomatous hyperplasia |
| AIS: Adenocarcinoma in situ |
| IAC: Invasive lung adenocarcinoma |
| MIA: Minimally invasive adenocarcinoma |
| Oral Cavity | 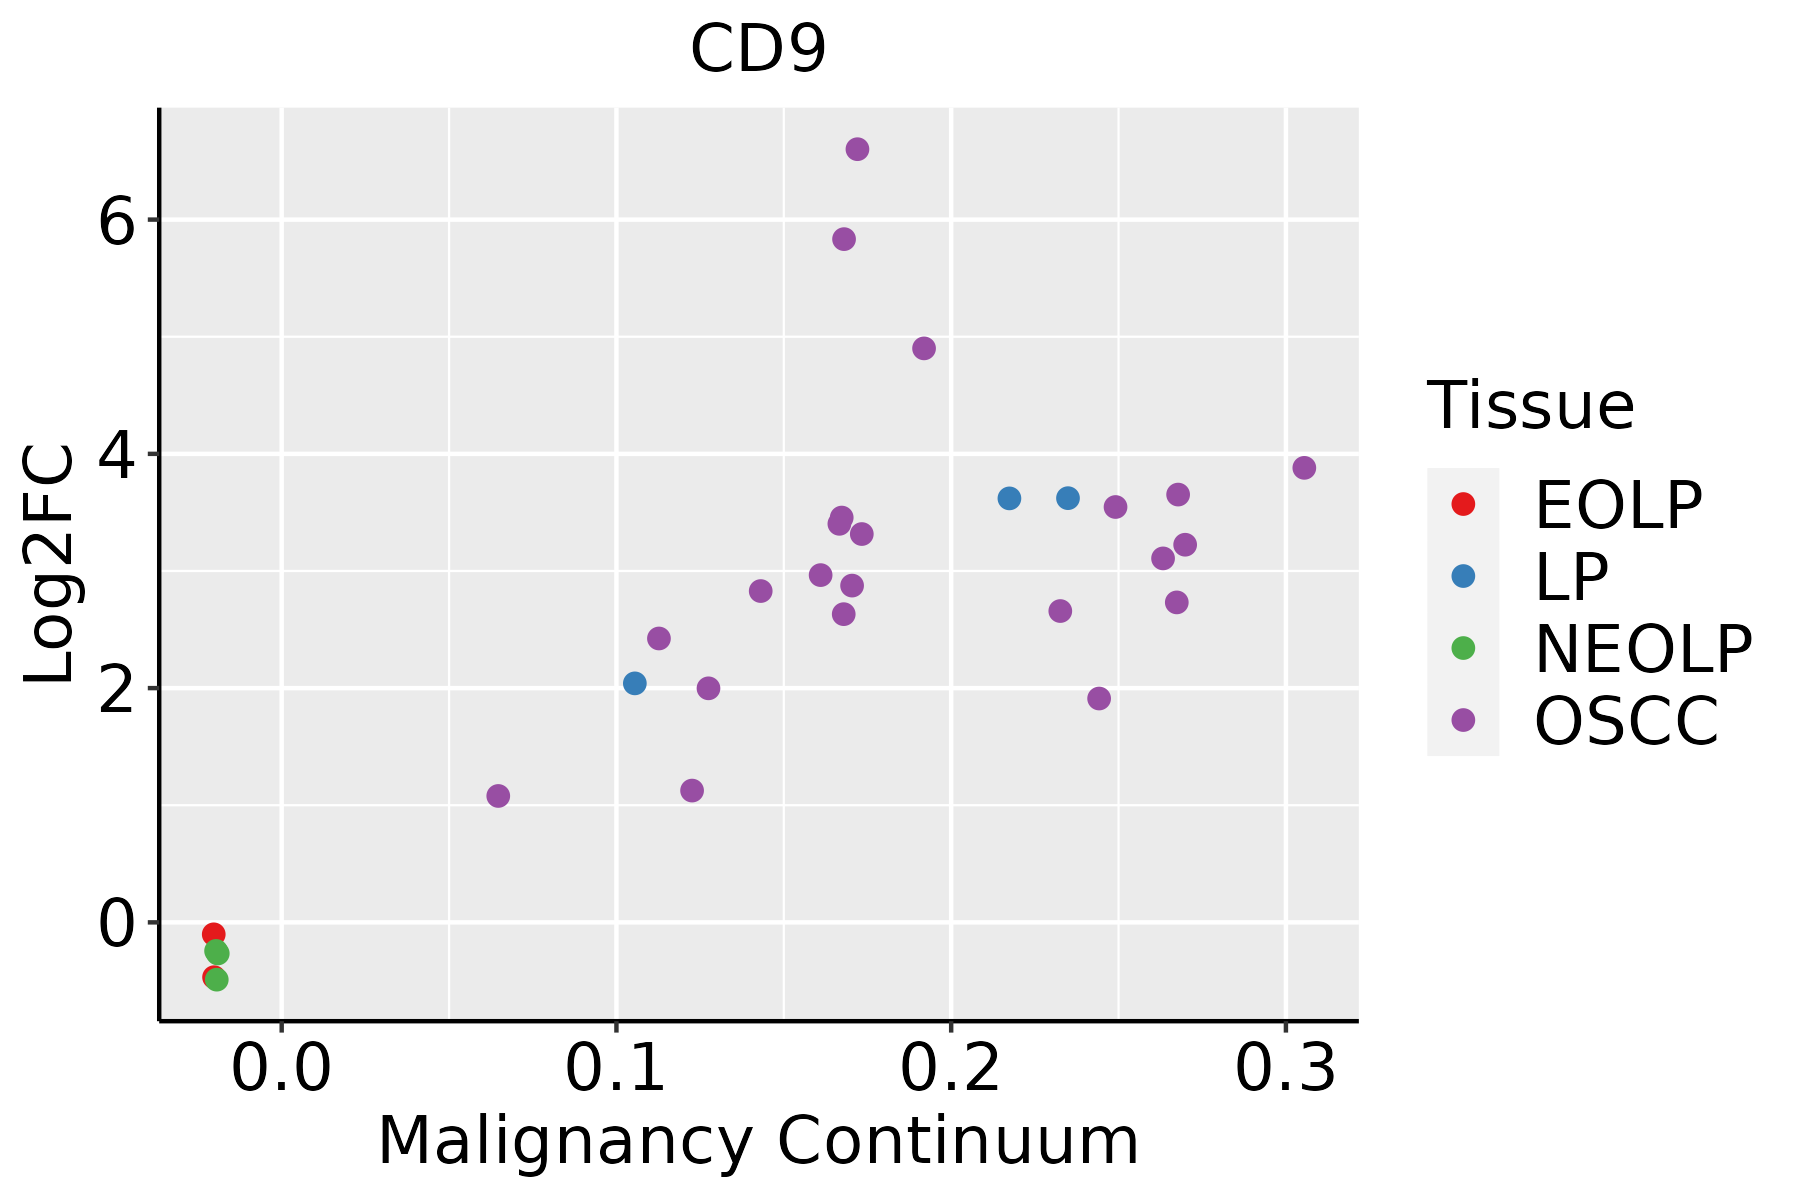 | EOLP: Erosive Oral lichen planus |
| LP: leukoplakia |
| NEOLP: Non-erosive oral lichen planus |
| OSCC: Oral squamous cell carcinoma |
| Prostate | 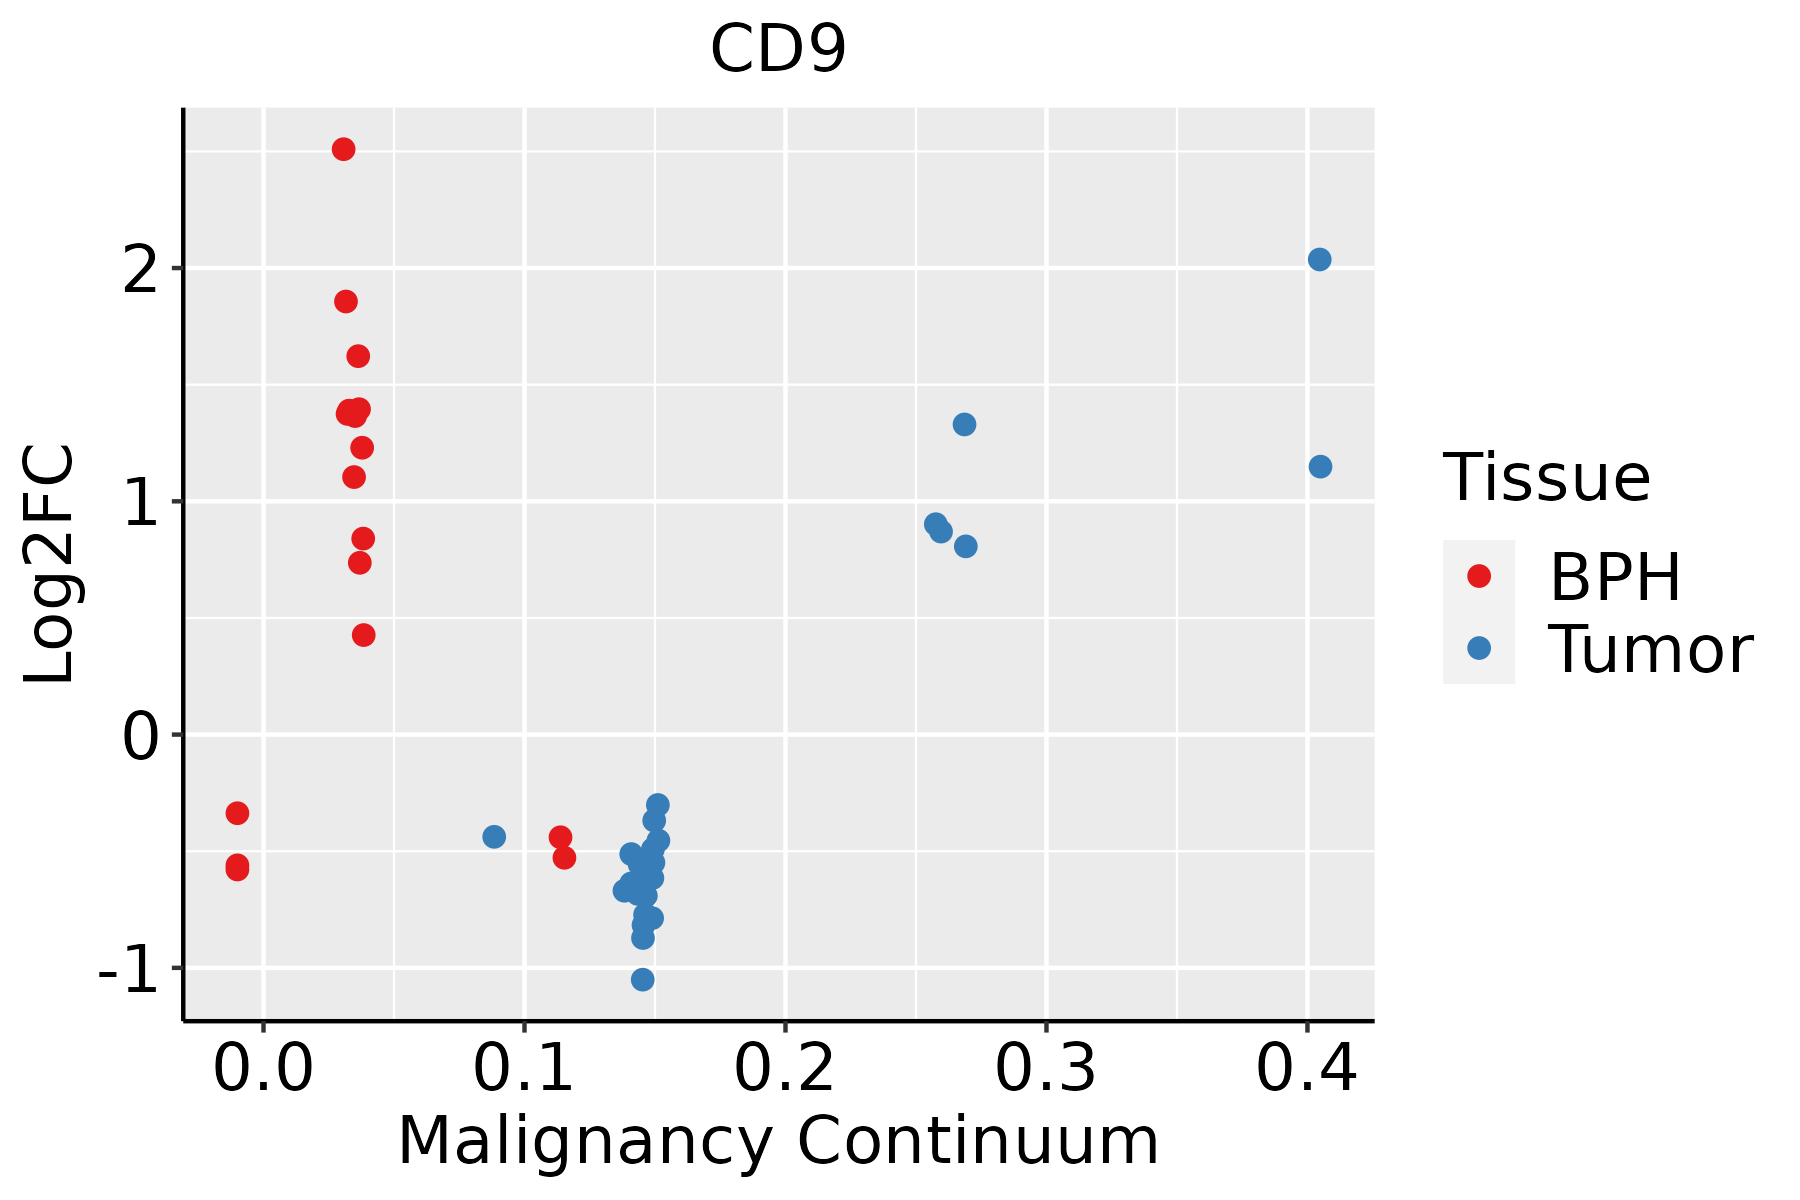 | BPH: Benign Prostatic Hyperplasia |
| Skin | 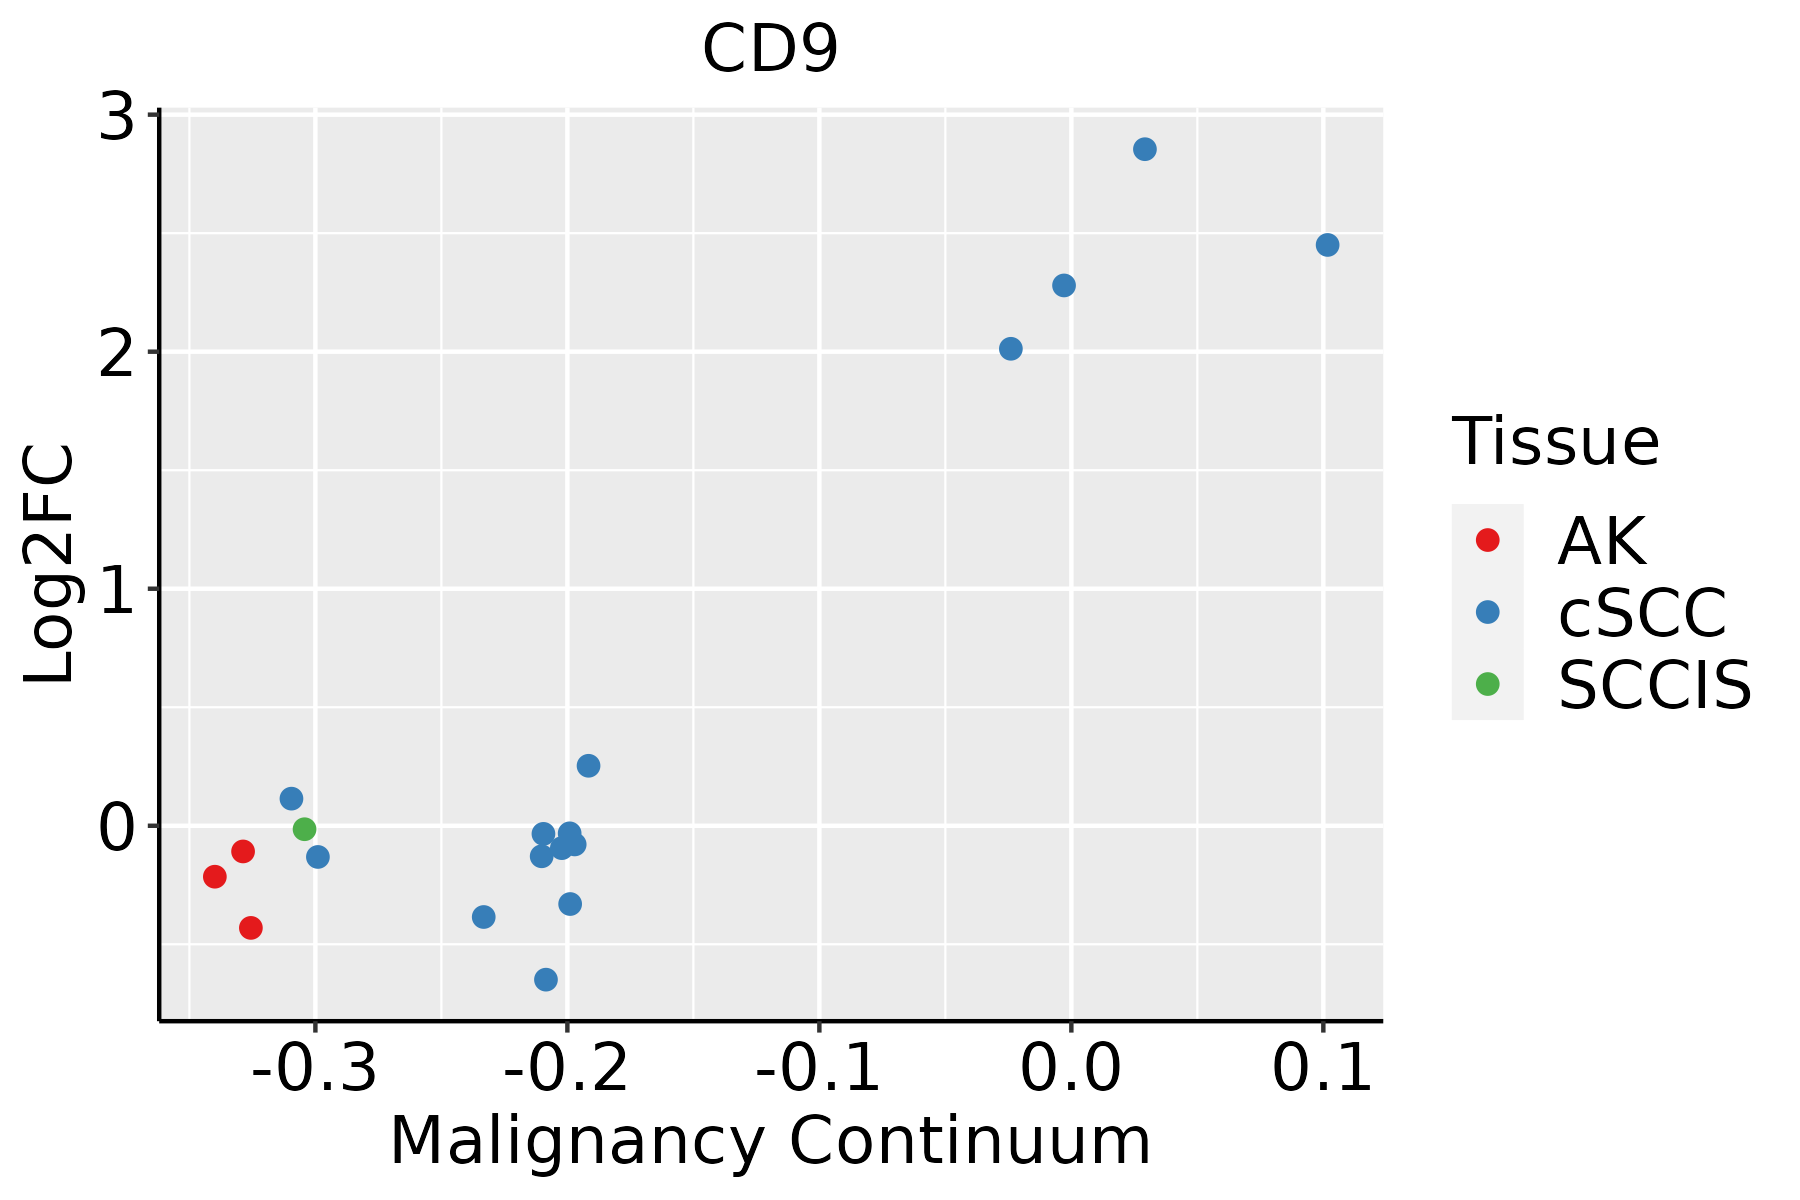 | AK: Actinic keratosis |
| cSCC: Cutaneous squamous cell carcinoma |
| SCCIS:squamous cell carcinoma in situ |
| Thyroid | 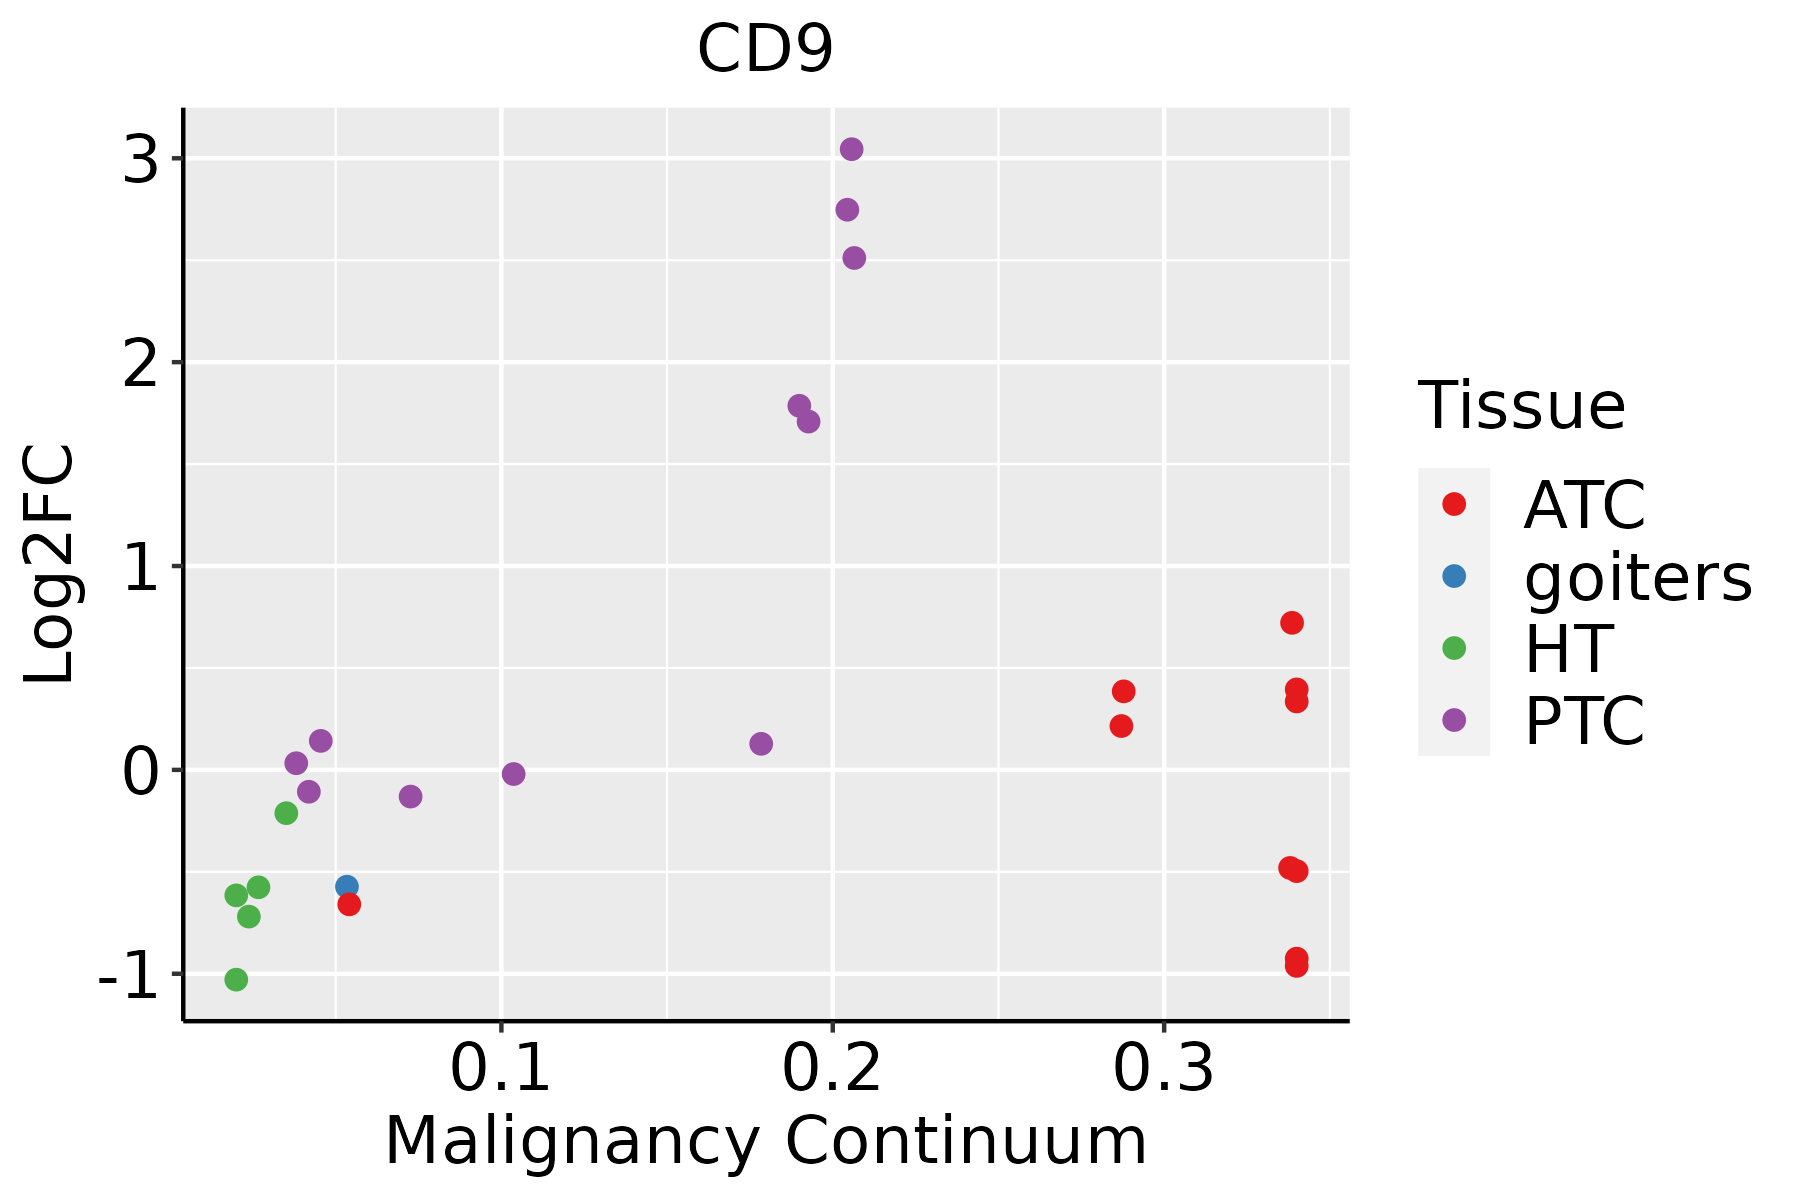 | ATC: Anaplastic thyroid cancer |
| HT: Hashimoto's thyroiditis |
| PTC: Papillary thyroid cancer |
| GO ID | Tissue | Disease Stage | Description | Gene Ratio | Bg Ratio | pvalue | p.adjust | Count |
| GO:00975297 | Breast | Precancer | myeloid leukocyte migration | 34/1080 | 220/18723 | 1.42e-07 | 7.82e-06 | 34 |
| GO:00509006 | Breast | Precancer | leukocyte migration | 47/1080 | 369/18723 | 2.82e-07 | 1.39e-05 | 47 |
| GO:00341099 | Breast | Precancer | homotypic cell-cell adhesion | 18/1080 | 90/18723 | 3.15e-06 | 1.03e-04 | 18 |
| GO:00975307 | Breast | Precancer | granulocyte migration | 24/1080 | 148/18723 | 4.04e-06 | 1.26e-04 | 24 |
| GO:00420609 | Breast | Precancer | wound healing | 48/1080 | 422/18723 | 5.48e-06 | 1.63e-04 | 48 |
| GO:19902665 | Breast | Precancer | neutrophil migration | 20/1080 | 122/18723 | 2.13e-05 | 4.99e-04 | 20 |
| GO:00026856 | Breast | Precancer | regulation of leukocyte migration | 27/1080 | 210/18723 | 7.93e-05 | 1.54e-03 | 27 |
| GO:00508789 | Breast | Precancer | regulation of body fluid levels | 40/1080 | 379/18723 | 1.68e-04 | 2.77e-03 | 40 |
| GO:00310995 | Breast | Precancer | regeneration | 25/1080 | 198/18723 | 1.91e-04 | 3.06e-03 | 25 |
| GO:00224079 | Breast | Precancer | regulation of cell-cell adhesion | 45/1080 | 448/18723 | 2.12e-04 | 3.30e-03 | 45 |
| GO:19055173 | Breast | Precancer | macrophage migration | 11/1080 | 55/18723 | 2.57e-04 | 3.83e-03 | 11 |
| GO:00420633 | Breast | Precancer | gliogenesis | 33/1080 | 301/18723 | 3.06e-04 | 4.40e-03 | 33 |
| GO:0035036 | Breast | Precancer | sperm-egg recognition | 10/1080 | 48/18723 | 3.43e-04 | 4.81e-03 | 10 |
| GO:00705278 | Breast | Precancer | platelet aggregation | 12/1080 | 67/18723 | 4.02e-04 | 5.43e-03 | 12 |
| GO:00716744 | Breast | Precancer | mononuclear cell migration | 24/1080 | 196/18723 | 4.03e-04 | 5.44e-03 | 24 |
| GO:0009988 | Breast | Precancer | cell-cell recognition | 12/1080 | 68/18723 | 4.63e-04 | 6.12e-03 | 12 |
| GO:00026877 | Breast | Precancer | positive regulation of leukocyte migration | 18/1080 | 135/18723 | 7.60e-04 | 9.04e-03 | 18 |
| GO:00068986 | Breast | Precancer | receptor-mediated endocytosis | 27/1080 | 244/18723 | 9.01e-04 | 1.03e-02 | 27 |
| GO:00100013 | Breast | Precancer | glial cell differentiation | 25/1080 | 225/18723 | 1.29e-03 | 1.37e-02 | 25 |
| GO:00316235 | Breast | Precancer | receptor internalization | 15/1080 | 113/18723 | 2.11e-03 | 2.00e-02 | 15 |
| Hugo Symbol | Variant Class | Variant Classification | dbSNP RS | HGVSc | HGVSp | HGVSp Short | SWISSPROT | BIOTYPE | SIFT | PolyPhen | Tumor Sample Barcode | Tissue | Histology | Sex | Age | Stage | Therapy Types | Drugs | Outcome |
| CD9 | SNV | Missense_Mutation | novel | c.361G>T | p.Val121Phe | p.V121F | P21926 | protein_coding | deleterious(0.01) | possibly_damaging(0.649) | TCGA-A8-A07U-01 | Breast | breast invasive carcinoma | Female | >=65 | III/IV | Chemotherapy | 5-fluorouracil | SD |
| CD9 | SNV | Missense_Mutation | | c.8N>A | p.Val3Asp | p.V3D | P21926 | protein_coding | deleterious(0.04) | possibly_damaging(0.723) | TCGA-AO-A124-01 | Breast | breast invasive carcinoma | Female | <65 | I/II | Chemotherapy | doxorubicin | SD |
| CD9 | SNV | Missense_Mutation | | c.286C>A | p.Leu96Ile | p.L96I | P21926 | protein_coding | deleterious(0.03) | probably_damaging(0.936) | TCGA-EW-A1P8-01 | Breast | breast invasive carcinoma | Female | <65 | III/IV | Chemotherapy | fluorouracil | PD |
| CD9 | insertion | Nonsense_Mutation | novel | c.481_482insCTCACTAACCAGGCTGGTCTTGAACTCCTGGTCTCAAG | p.Gln161ProfsTer3 | p.Q161Pfs*3 | P21926 | protein_coding | | | TCGA-A2-A0CP-01 | Breast | breast invasive carcinoma | Female | <65 | I/II | Chemotherapy | cytoxan | SD |
| CD9 | insertion | Nonsense_Mutation | novel | c.363_364insTCGAGGACCACGTTTGCTTTTTTTCCCTGAATCCA | p.Gln122SerfsTer10 | p.Q122Sfs*10 | P21926 | protein_coding | | | TCGA-A8-A07U-01 | Breast | breast invasive carcinoma | Female | >=65 | III/IV | Chemotherapy | 5-fluorouracil | SD |
| CD9 | SNV | Missense_Mutation | rs146304211 | c.664N>T | p.Arg222Cys | p.R222C | P21926 | protein_coding | deleterious(0) | probably_damaging(0.993) | TCGA-AA-A01R-01 | Colorectum | colon adenocarcinoma | Male | <65 | III/IV | Chemotherapy | 5-fluorouracil | PD |
| CD9 | SNV | Missense_Mutation | rs777932393 | c.679N>G | p.Met227Val | p.M227V | P21926 | protein_coding | tolerated(0.94) | benign(0.001) | TCGA-AY-6197-01 | Colorectum | colon adenocarcinoma | Male | <65 | I/II | Unknown | Unknown | SD |
| CD9 | SNV | Missense_Mutation | | c.142N>C | p.Glu48Gln | p.E48Q | P21926 | protein_coding | tolerated(0.1) | possibly_damaging(0.557) | TCGA-G4-6294-01 | Colorectum | colon adenocarcinoma | Male | >=65 | III/IV | Chemotherapy | fluorouracil | PD |
| CD9 | SNV | Missense_Mutation | novel | c.446N>T | p.Ala149Val | p.A149V | P21926 | protein_coding | tolerated(0.18) | possibly_damaging(0.87) | TCGA-AJ-A3BH-01 | Endometrium | uterine corpus endometrioid carcinoma | Female | Unknown | I/II | Unknown | Unknown | SD |
| CD9 | SNV | Missense_Mutation | | c.199N>A | p.Gly67Ser | p.G67S | P21926 | protein_coding | deleterious(0.01) | probably_damaging(0.999) | TCGA-AP-A0LG-01 | Endometrium | uterine corpus endometrioid carcinoma | Female | <65 | I/II | Unknown | Unknown | SD |
| Entrez ID | Symbol | Category | Interaction Types | Drug Claim Name | Drug Name | PMIDs |
| 928 | CD9 | DRUGGABLE GENOME, EXTERNAL SIDE OF PLASMA MEMBRANE | | PROPIONIBACTERIUM ACNES | | 15902693 |
| 928 | CD9 | DRUGGABLE GENOME, EXTERNAL SIDE OF PLASMA MEMBRANE | | EOTAXIN | | 10704064 |
| 928 | CD9 | DRUGGABLE GENOME, EXTERNAL SIDE OF PLASMA MEMBRANE | | TYROSINE KINASE INHIBITOR | | 7592610 |
| 928 | CD9 | DRUGGABLE GENOME, EXTERNAL SIDE OF PLASMA MEMBRANE | | ANDROGENS | | 16128989 |
| 928 | CD9 | DRUGGABLE GENOME, EXTERNAL SIDE OF PLASMA MEMBRANE | | INTERLEUKIN-16 | | 16144798 |
| 928 | CD9 | DRUGGABLE GENOME, EXTERNAL SIDE OF PLASMA MEMBRANE | | IL-5 | | 10704064 |
| 928 | CD9 | DRUGGABLE GENOME, EXTERNAL SIDE OF PLASMA MEMBRANE | | STEROID HORMONE | | 17126340 |
| 928 | CD9 | DRUGGABLE GENOME, EXTERNAL SIDE OF PLASMA MEMBRANE | | LIF | | 11950938 |
| 928 | CD9 | DRUGGABLE GENOME, EXTERNAL SIDE OF PLASMA MEMBRANE | | HERBIMYCIN A | | 7592610 |


