
|
|||||
|
 | |
| |
| |
| |
| |
| |
|
Gene: CD8B |
Gene summary for CD8B |
| Gene information | Species | Human | Gene symbol | CD8B | Gene ID | 926 |
| Gene name | CD8b molecule | |
| Gene Alias | CD8B1 | |
| Cytomap | 2p11.2 | |
| Gene Type | protein-coding | GO ID | GO:0001775 | UniProtAcc | P10966 |
Top |
Malignant transformation analysis |
| Identification of the aberrant gene expression in precancerous and cancerous lesions by comparing the gene expression of stem-like cells in diseased tissues with normal stem cells |
| Entrez ID | Symbol | Replicates | Species | Organ | Tissue | Adj P-value | Log2FC | Malignancy |
| 926 | CD8B | LZE6T | Human | Esophagus | ESCC | 2.92e-09 | 7.14e-01 | 0.0845 |
| 926 | CD8B | P2T-E | Human | Esophagus | ESCC | 3.82e-02 | 1.12e-01 | 0.1177 |
| 926 | CD8B | P16T-E | Human | Esophagus | ESCC | 2.10e-05 | 1.90e-01 | 0.1153 |
| 926 | CD8B | P27T-E | Human | Esophagus | ESCC | 2.50e-02 | 1.14e-01 | 0.1055 |
| 926 | CD8B | P56T-E | Human | Esophagus | ESCC | 2.02e-05 | 6.67e-01 | 0.1613 |
| 926 | CD8B | P65T-E | Human | Esophagus | ESCC | 1.25e-06 | 1.70e-01 | 0.0978 |
| 926 | CD8B | P75T-E | Human | Esophagus | ESCC | 2.63e-06 | 1.88e-01 | 0.1125 |
| 926 | CD8B | P76T-E | Human | Esophagus | ESCC | 1.53e-13 | 3.23e-01 | 0.1207 |
| 926 | CD8B | S014 | Human | Liver | HCC | 2.01e-37 | 1.82e+00 | 0.2254 |
| 926 | CD8B | S015 | Human | Liver | HCC | 1.43e-24 | 2.48e+00 | 0.2375 |
| 926 | CD8B | S016 | Human | Liver | HCC | 7.44e-58 | 2.34e+00 | 0.2243 |
| 926 | CD8B | C38 | Human | Oral cavity | OSCC | 1.36e-03 | 7.75e-01 | 0.172 |
| 926 | CD8B | C43 | Human | Oral cavity | OSCC | 4.83e-17 | 3.42e-01 | 0.1704 |
| 926 | CD8B | C46 | Human | Oral cavity | OSCC | 1.38e-35 | 8.31e-01 | 0.1673 |
| 926 | CD8B | LN46 | Human | Oral cavity | OSCC | 1.59e-30 | 8.79e-01 | 0.1666 |
| Page: 1 |
| Tissue | Expression Dynamics | Abbreviation |
| Esophagus |  | ESCC: Esophageal squamous cell carcinoma |
| HGIN: High-grade intraepithelial neoplasias | ||
| LGIN: Low-grade intraepithelial neoplasias | ||
| Liver |  | HCC: Hepatocellular carcinoma |
| NAFLD: Non-alcoholic fatty liver disease | ||
| Oral Cavity | 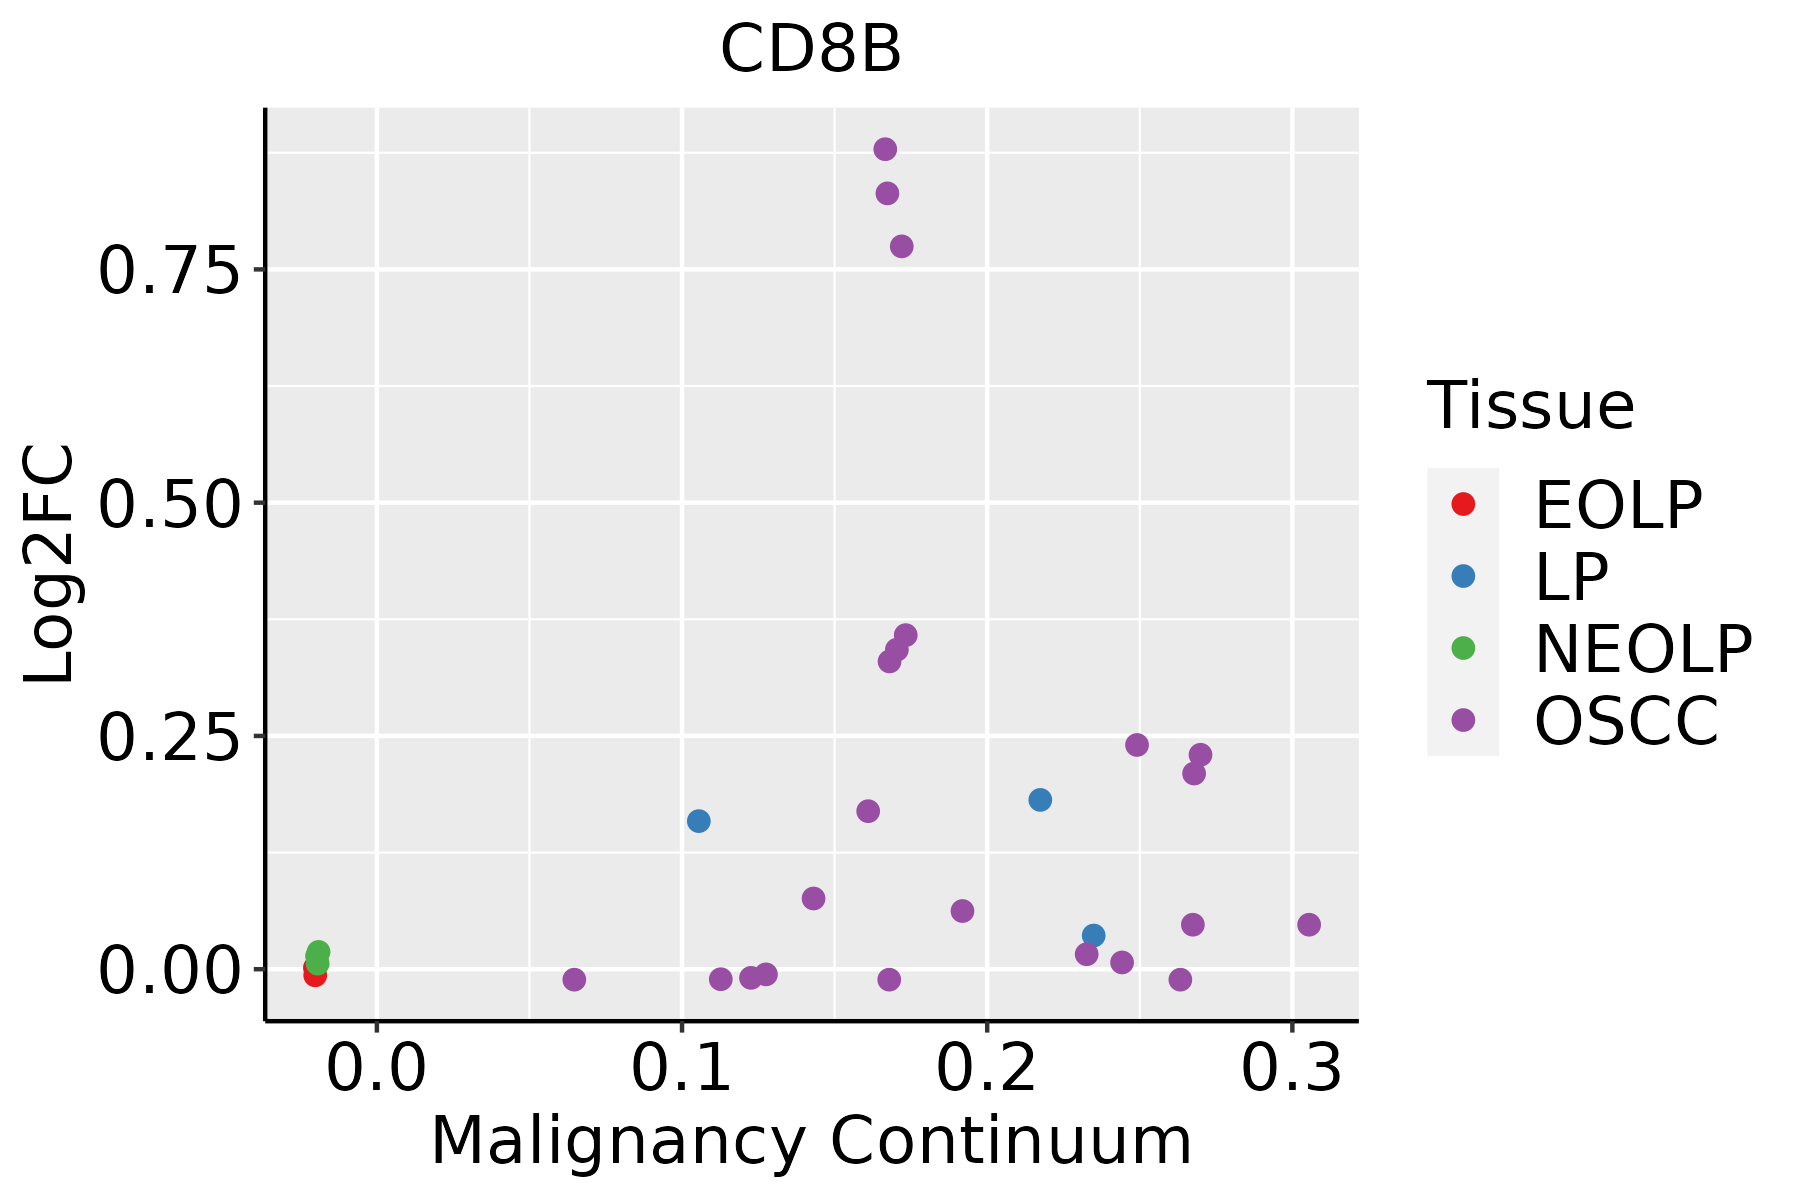 | EOLP: Erosive Oral lichen planus |
| LP: leukoplakia | ||
| NEOLP: Non-erosive oral lichen planus | ||
| OSCC: Oral squamous cell carcinoma |
| ∗log2FC in expression of this searched gene in stem-like cells from each diseased tissue sample relative to stem-like cells in normal samples in each tissue plotted against the malignancy continuum. Samples are colored based on if they are from different disease stage. |
Top |
Malignant transformation related pathway analysis |
| Find out the enriched GO biological processes and KEGG pathways involved in transition from healthy to precancer to cancer |
| Tissue | Disease Stage | Enriched GO biological Processes |
| Colorectum | AD |  |
| Colorectum | SER |  |
| Colorectum | MSS |  |
| Colorectum | MSI-H |  |
| Colorectum | FAP |  |
| ∗Top 15 enriched GO BP terms are showed in the bar plot of each disease state in each tissue. Each row represents a significant GO biological process which is colored according to the -log10(p.adjust). |
| Page: 1 2 3 4 5 6 7 8 9 |
| GO ID | Tissue | Disease Stage | Description | Gene Ratio | Bg Ratio | pvalue | p.adjust | Count |
| GO:004211018 | Esophagus | ESCC | T cell activation | 256/8552 | 487/18723 | 1.18e-03 | 5.87e-03 | 256 |
| GO:004211016 | Oral cavity | OSCC | T cell activation | 245/7305 | 487/18723 | 2.00e-07 | 3.22e-06 | 245 |
| Page: 1 |
| Pathway ID | Tissue | Disease Stage | Description | Gene Ratio | Bg Ratio | pvalue | p.adjust | qvalue | Count |
| hsa0513526 | Esophagus | ESCC | Yersinia infection | 100/4205 | 137/8465 | 1.80e-08 | 1.59e-07 | 8.12e-08 | 100 |
| hsa0461230 | Esophagus | ESCC | Antigen processing and presentation | 51/4205 | 78/8465 | 3.57e-03 | 9.34e-03 | 4.78e-03 | 51 |
| hsa046607 | Esophagus | ESCC | T cell receptor signaling pathway | 63/4205 | 104/8465 | 1.60e-02 | 3.60e-02 | 1.84e-02 | 63 |
| hsa05135111 | Esophagus | ESCC | Yersinia infection | 100/4205 | 137/8465 | 1.80e-08 | 1.59e-07 | 8.12e-08 | 100 |
| hsa04612114 | Esophagus | ESCC | Antigen processing and presentation | 51/4205 | 78/8465 | 3.57e-03 | 9.34e-03 | 4.78e-03 | 51 |
| hsa0466013 | Esophagus | ESCC | T cell receptor signaling pathway | 63/4205 | 104/8465 | 1.60e-02 | 3.60e-02 | 1.84e-02 | 63 |
| hsa0513542 | Liver | HCC | Yersinia infection | 92/4020 | 137/8465 | 2.25e-06 | 2.19e-05 | 1.22e-05 | 92 |
| hsa0513552 | Liver | HCC | Yersinia infection | 92/4020 | 137/8465 | 2.25e-06 | 2.19e-05 | 1.22e-05 | 92 |
| hsa0513520 | Oral cavity | OSCC | Yersinia infection | 94/3704 | 137/8465 | 2.85e-09 | 3.08e-08 | 1.57e-08 | 94 |
| hsa046606 | Oral cavity | OSCC | T cell receptor signaling pathway | 67/3704 | 104/8465 | 1.57e-05 | 6.75e-05 | 3.44e-05 | 67 |
| hsa05135110 | Oral cavity | OSCC | Yersinia infection | 94/3704 | 137/8465 | 2.85e-09 | 3.08e-08 | 1.57e-08 | 94 |
| hsa0466012 | Oral cavity | OSCC | T cell receptor signaling pathway | 67/3704 | 104/8465 | 1.57e-05 | 6.75e-05 | 3.44e-05 | 67 |
| Page: 1 |
Top |
Cell-cell communication analysis |
| Identification of potential cell-cell interactions between two cell types and their ligand-receptor pairs for different disease states |
| Ligand | Receptor | LRpair | Pathway | Tissue | Disease Stage |
| HLA-A | CD8B | HLA-A_CD8B | MHC-I | Breast | ADJ |
| HLA-B | CD8B | HLA-B_CD8B | MHC-I | Breast | ADJ |
| HLA-E | CD8B | HLA-E_CD8B | MHC-I | Breast | ADJ |
| HLA-F | CD8B | HLA-F_CD8B | MHC-I | Breast | ADJ |
| HLA-A | CD8B | HLA-A_CD8B | MHC-I | Breast | DCIS |
| HLA-B | CD8B | HLA-B_CD8B | MHC-I | Breast | DCIS |
| HLA-C | CD8B | HLA-C_CD8B | MHC-I | Breast | DCIS |
| HLA-E | CD8B | HLA-E_CD8B | MHC-I | Breast | DCIS |
| HLA-F | CD8B | HLA-F_CD8B | MHC-I | Breast | DCIS |
| HLA-A | CD8B | HLA-A_CD8B | MHC-I | Breast | Healthy |
| HLA-B | CD8B | HLA-B_CD8B | MHC-I | Breast | Healthy |
| HLA-C | CD8B | HLA-C_CD8B | MHC-I | Breast | Healthy |
| HLA-E | CD8B | HLA-E_CD8B | MHC-I | Breast | Healthy |
| HLA-F | CD8B | HLA-F_CD8B | MHC-I | Breast | Healthy |
| HLA-A | CD8B | HLA-A_CD8B | MHC-I | Breast | IDC |
| HLA-B | CD8B | HLA-B_CD8B | MHC-I | Breast | IDC |
| HLA-C | CD8B | HLA-C_CD8B | MHC-I | Breast | IDC |
| HLA-E | CD8B | HLA-E_CD8B | MHC-I | Breast | IDC |
| HLA-F | CD8B | HLA-F_CD8B | MHC-I | Breast | IDC |
| HLA-A | CD8B | HLA-A_CD8B | MHC-I | Breast | Precancer |
| Page: 1 |
Top |
Single-cell gene regulatory network inference analysis |
| Find out the significant the regulons (TFs) and the target genes of each regulon across cell types for different disease states |
| TF | Cell Type | Tissue | Disease Stage | Target Gene | RSS | Regulon Activity |
| ∗The dot plots of a searched regulon are shown for all cell subpopulations in each disease state of each tissue based on the regulon specific score inferred using pySCENIC and by calculating the average expression. |
| Page: 1 |
Top |
Somatic mutation of malignant transformation related genes |
| Annotation of somatic variants for genes involved in malignant transformation |
| Hugo Symbol | Variant Class | Variant Classification | dbSNP RS | HGVSc | HGVSp | HGVSp Short | SWISSPROT | BIOTYPE | SIFT | PolyPhen | Tumor Sample Barcode | Tissue | Histology | Sex | Age | Stage | Therapy Types | Drugs | Outcome |
| CD8B | SNV | Missense_Mutation | rs775751696 | c.244N>A | p.Gly82Ser | p.G82S | P10966 | protein_coding | tolerated(0.15) | possibly_damaging(0.591) | TCGA-B6-A400-01 | Breast | breast invasive carcinoma | Female | <65 | III/IV | Unknown | Unknown | SD |
| CD8B | SNV | Missense_Mutation | novel | c.596N>A | p.Arg199Lys | p.R199K | P10966 | protein_coding | tolerated(0.21) | benign(0.048) | TCGA-EA-A3HU-01 | Cervix | cervical & endocervical cancer | Female | <65 | I/II | Unknown | Unknown | SD |
| CD8B | SNV | Missense_Mutation | novel | c.667N>A | p.His223Asn | p.H223N | P10966 | protein_coding | deleterious_low_confidence(0) | benign(0.003) | TCGA-MU-A8JM-01 | Cervix | cervical & endocervical cancer | Female | <65 | I/II | Unknown | Unknown | SD |
| CD8B | SNV | Missense_Mutation | rs753422558 | c.124N>A | p.Glu42Lys | p.E42K | P10966 | protein_coding | tolerated(0.14) | benign(0.036) | TCGA-ZJ-AAXU-01 | Cervix | cervical & endocervical cancer | Female | <65 | I/II | Unknown | Unknown | SD |
| CD8B | SNV | Missense_Mutation | c.728N>T | p.Thr243Ile | p.T243I | P10966 | protein_coding | deleterious_low_confidence(0) | benign(0.006) | TCGA-A6-6780-01 | Colorectum | colon adenocarcinoma | Male | >=65 | I/II | Unknown | Unknown | SD | |
| CD8B | SNV | Missense_Mutation | novel | c.699G>T | p.Gln233His | p.Q233H | P10966 | protein_coding | tolerated_low_confidence(0.09) | benign(0.028) | TCGA-AA-3984-01 | Colorectum | colon adenocarcinoma | Female | <65 | I/II | Unknown | Unknown | SD |
| CD8B | SNV | Missense_Mutation | rs747895168 | c.280N>T | p.Arg94Trp | p.R94W | P10966 | protein_coding | tolerated(0.07) | probably_damaging(0.922) | TCGA-AA-A010-01 | Colorectum | colon adenocarcinoma | Female | <65 | I/II | Chemotherapy | folinic | CR |
| CD8B | SNV | Missense_Mutation | c.521N>A | p.Gly174Asp | p.G174D | P10966 | protein_coding | deleterious(0.02) | possibly_damaging(0.585) | TCGA-CM-6162-01 | Colorectum | colon adenocarcinoma | Female | <65 | III/IV | Chemotherapy | oxaliplatin | SD | |
| CD8B | insertion | Nonsense_Mutation | novel | c.474_475insTAGCTT | p.Pro158_Arg159insTer | p.P158_R159ins* | P10966 | protein_coding | TCGA-AM-5820-01 | Colorectum | colon adenocarcinoma | Female | <65 | I/II | Unknown | Unknown | SD | ||
| CD8B | SNV | Missense_Mutation | novel | c.644N>T | p.Gly215Val | p.G215V | P10966 | protein_coding | deleterious_low_confidence(0.04) | benign(0) | TCGA-AJ-A5DW-01 | Endometrium | uterine corpus endometrioid carcinoma | Female | <65 | I/II | Unknown | Unknown | SD |
| Page: 1 2 3 |
Top |
Related drugs of malignant transformation related genes |
| Identification of chemicals and drugs interact with genes involved in malignant transfromation |
| (DGIdb 4.0) |
| Entrez ID | Symbol | Category | Interaction Types | Drug Claim Name | Drug Name | PMIDs |
| Page: 1 |

Copyright 2023-Present -The University of Texas Health Science Center at Houston |