
|
|||||
|
 | |
| |
| |
| |
| |
| |
|
Gene: CD83 |
Gene summary for CD83 |
| Gene information | Species | Human | Gene symbol | CD83 | Gene ID | 9308 |
| Gene name | CD83 molecule | |
| Gene Alias | BL11 | |
| Cytomap | 6p23 | |
| Gene Type | protein-coding | GO ID | GO:0001775 | UniProtAcc | Q01151 |
Top |
Malignant transformation analysis |
| Identification of the aberrant gene expression in precancerous and cancerous lesions by comparing the gene expression of stem-like cells in diseased tissues with normal stem cells |
| Entrez ID | Symbol | Replicates | Species | Organ | Tissue | Adj P-value | Log2FC | Malignancy |
| 9308 | CD83 | AEH-subject1 | Human | Endometrium | AEH | 6.38e-14 | 4.13e-01 | -0.3059 |
| 9308 | CD83 | AEH-subject4 | Human | Endometrium | AEH | 2.29e-02 | 3.38e-01 | -0.2657 |
| 9308 | CD83 | EEC-subject1 | Human | Endometrium | EEC | 1.09e-15 | 4.84e-01 | -0.2682 |
| 9308 | CD83 | EEC-subject4 | Human | Endometrium | EEC | 6.60e-09 | 4.44e-01 | -0.2571 |
| 9308 | CD83 | GSM6177620_NYU_UCEC1_lib1_lib1 | Human | Endometrium | EEC | 1.24e-03 | -1.61e-01 | -0.1869 |
| 9308 | CD83 | GSM6177620_NYU_UCEC1_lib2_lib2 | Human | Endometrium | EEC | 2.72e-04 | -1.95e-01 | -0.1875 |
| 9308 | CD83 | GSM6177620_NYU_UCEC1_lib3_lib3 | Human | Endometrium | EEC | 2.08e-03 | -1.64e-01 | -0.1883 |
| 9308 | CD83 | GSM6177622_NYU_UCEC3_lib2_lib2 | Human | Endometrium | EEC | 4.11e-05 | -1.51e-01 | -0.1916 |
| 9308 | CD83 | LZE7T | Human | Esophagus | ESCC | 7.02e-04 | 6.57e-01 | 0.0667 |
| 9308 | CD83 | LZE8T | Human | Esophagus | ESCC | 1.09e-05 | -1.42e-02 | 0.067 |
| 9308 | CD83 | LZE24T | Human | Esophagus | ESCC | 9.61e-04 | 1.78e-01 | 0.0596 |
| 9308 | CD83 | P2T-E | Human | Esophagus | ESCC | 2.73e-39 | 1.16e+00 | 0.1177 |
| 9308 | CD83 | P4T-E | Human | Esophagus | ESCC | 1.24e-06 | 5.62e-01 | 0.1323 |
| 9308 | CD83 | P9T-E | Human | Esophagus | ESCC | 3.68e-06 | 1.42e-02 | 0.1131 |
| 9308 | CD83 | P11T-E | Human | Esophagus | ESCC | 8.25e-14 | 2.00e+00 | 0.1426 |
| 9308 | CD83 | P16T-E | Human | Esophagus | ESCC | 3.15e-13 | 3.68e-01 | 0.1153 |
| 9308 | CD83 | P21T-E | Human | Esophagus | ESCC | 2.41e-08 | 5.69e-01 | 0.1617 |
| 9308 | CD83 | P23T-E | Human | Esophagus | ESCC | 5.44e-12 | 1.67e+00 | 0.108 |
| 9308 | CD83 | P26T-E | Human | Esophagus | ESCC | 1.29e-08 | 3.14e-01 | 0.1276 |
| 9308 | CD83 | P30T-E | Human | Esophagus | ESCC | 2.16e-06 | 1.61e-01 | 0.137 |
| Page: 1 2 3 4 5 |
| Tissue | Expression Dynamics | Abbreviation |
| Endometrium | 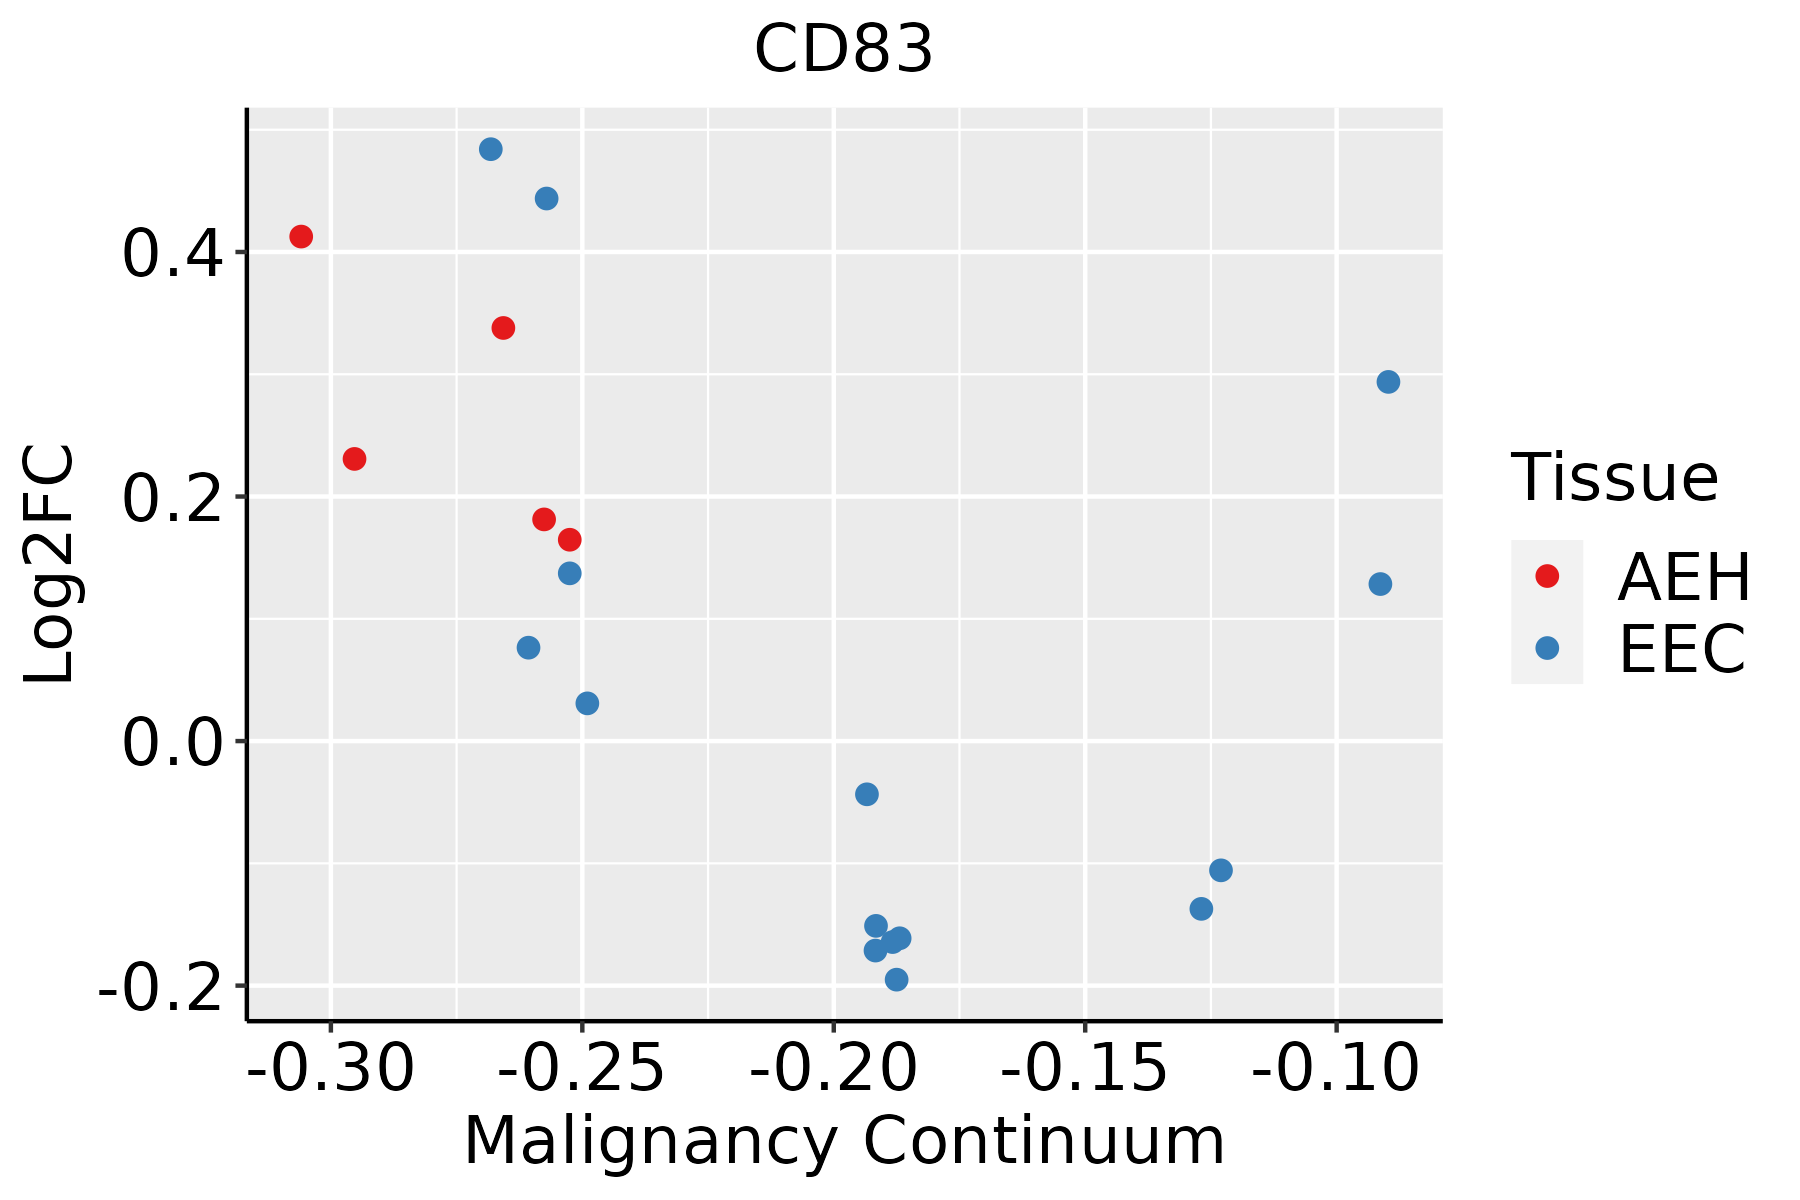 | AEH: Atypical endometrial hyperplasia |
| EEC: Endometrioid Cancer | ||
| Esophagus | 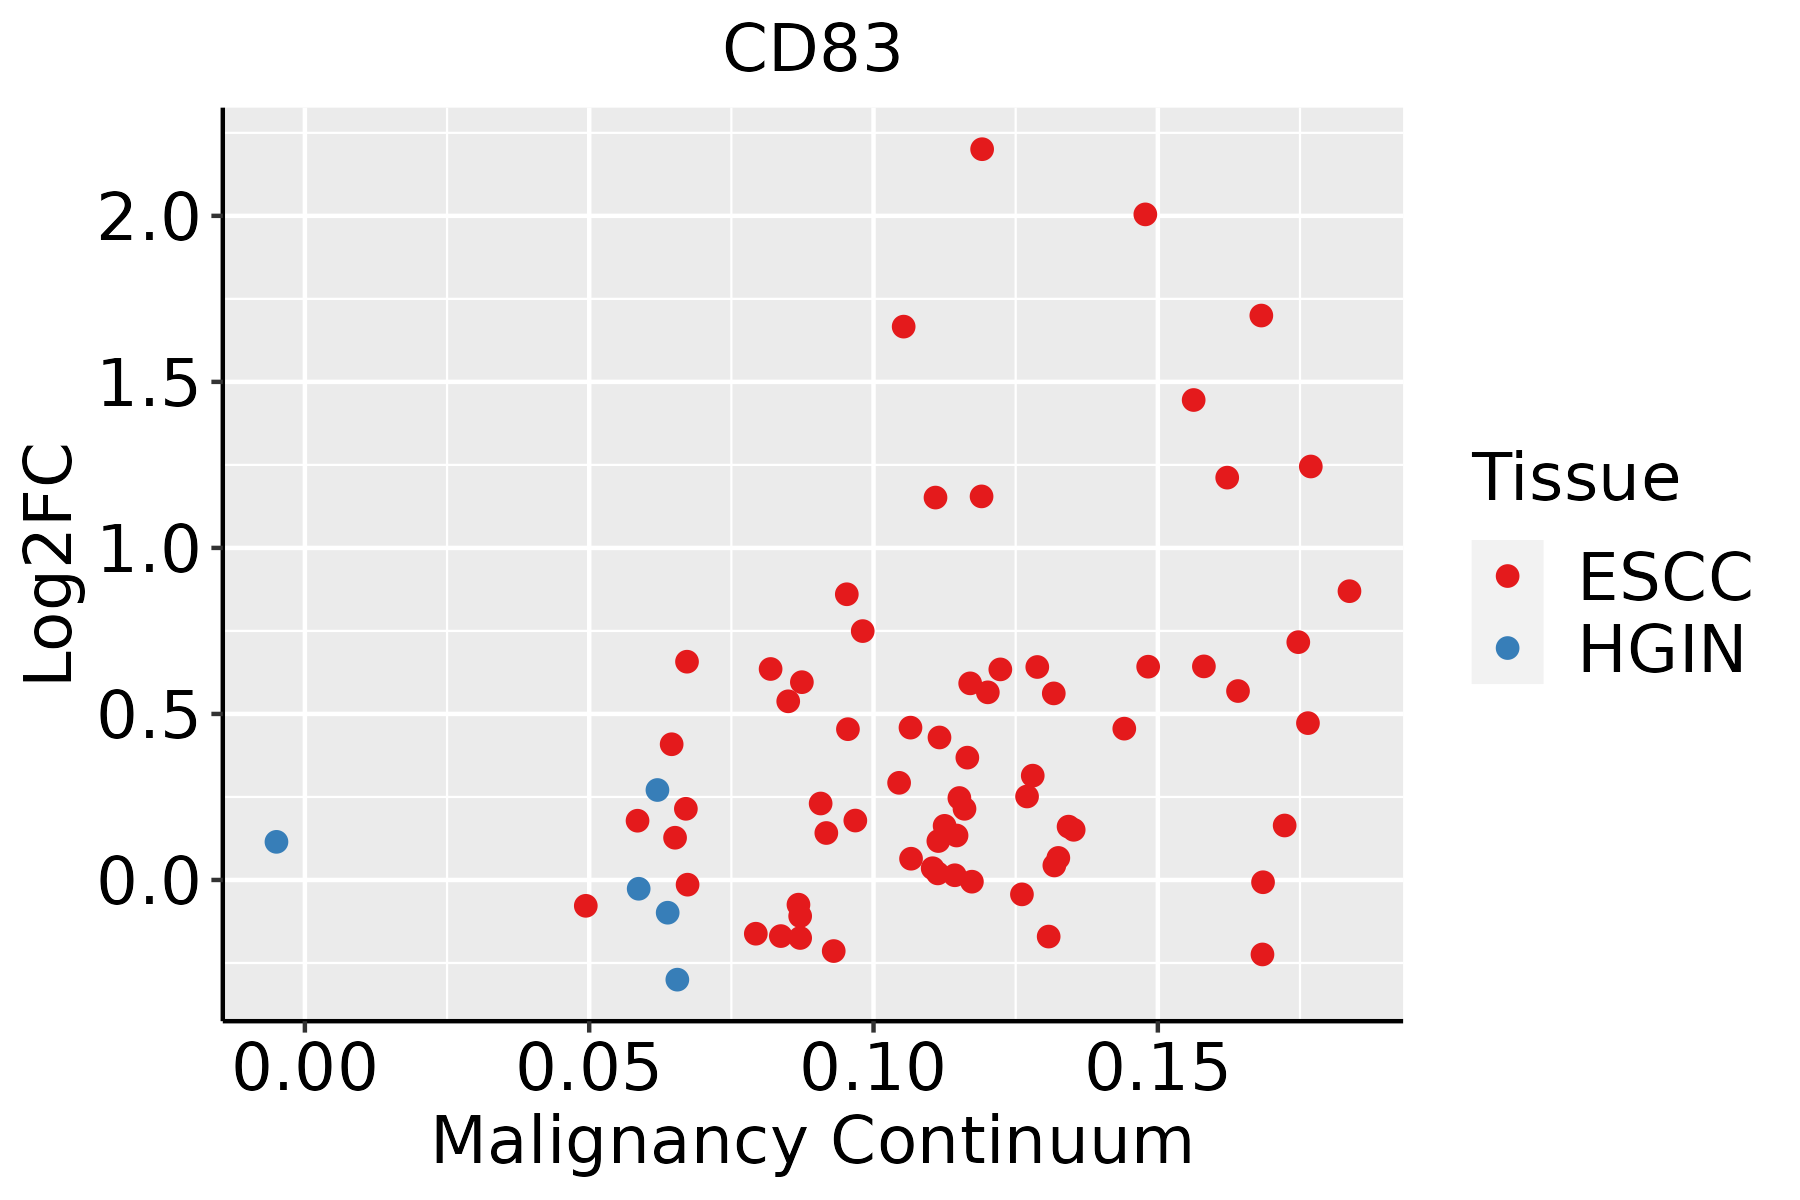 | ESCC: Esophageal squamous cell carcinoma |
| HGIN: High-grade intraepithelial neoplasias | ||
| LGIN: Low-grade intraepithelial neoplasias | ||
| Oral Cavity |  | EOLP: Erosive Oral lichen planus |
| LP: leukoplakia | ||
| NEOLP: Non-erosive oral lichen planus | ||
| OSCC: Oral squamous cell carcinoma | ||
| Prostate |  | BPH: Benign Prostatic Hyperplasia |
| Thyroid | 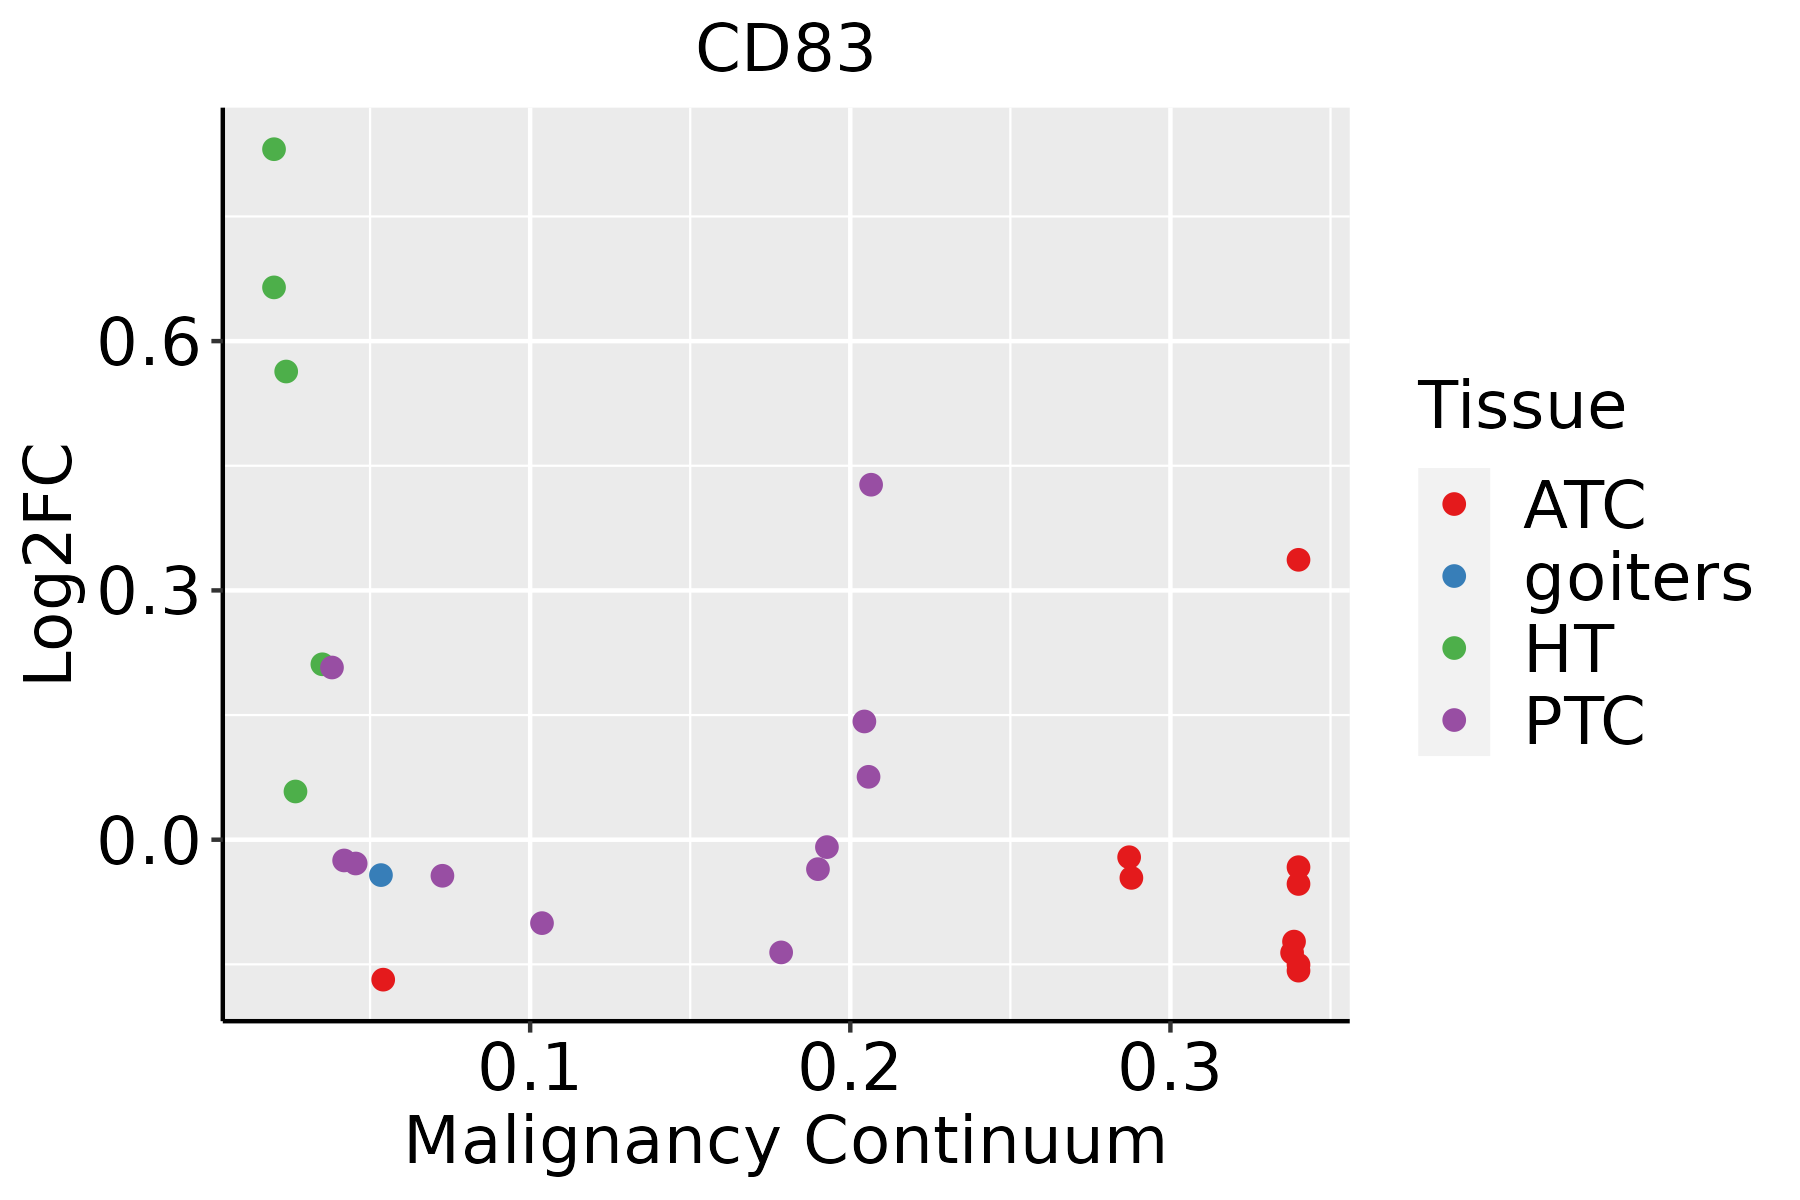 | ATC: Anaplastic thyroid cancer |
| HT: Hashimoto's thyroiditis | ||
| PTC: Papillary thyroid cancer |
| ∗log2FC in expression of this searched gene in stem-like cells from each diseased tissue sample relative to stem-like cells in normal samples in each tissue plotted against the malignancy continuum. Samples are colored based on if they are from different disease stage. |
Top |
Malignant transformation related pathway analysis |
| Find out the enriched GO biological processes and KEGG pathways involved in transition from healthy to precancer to cancer |
| Tissue | Disease Stage | Enriched GO biological Processes |
| Colorectum | AD |  |
| Colorectum | SER |  |
| Colorectum | MSS |  |
| Colorectum | MSI-H |  |
| Colorectum | FAP |  |
| ∗Top 15 enriched GO BP terms are showed in the bar plot of each disease state in each tissue. Each row represents a significant GO biological process which is colored according to the -log10(p.adjust). |
| Page: 1 2 3 4 5 6 7 8 9 |
| GO ID | Tissue | Disease Stage | Description | Gene Ratio | Bg Ratio | pvalue | p.adjust | Count |
| GO:004578516 | Endometrium | AEH | positive regulation of cell adhesion | 96/2100 | 437/18723 | 5.50e-11 | 7.18e-09 | 96 |
| GO:002240714 | Endometrium | AEH | regulation of cell-cell adhesion | 79/2100 | 448/18723 | 2.90e-05 | 5.40e-04 | 79 |
| GO:002240910 | Endometrium | AEH | positive regulation of cell-cell adhesion | 54/2100 | 284/18723 | 6.94e-05 | 1.07e-03 | 54 |
| GO:19030398 | Endometrium | AEH | positive regulation of leukocyte cell-cell adhesion | 46/2100 | 239/18723 | 1.72e-04 | 2.24e-03 | 46 |
| GO:00421109 | Endometrium | AEH | T cell activation | 81/2100 | 487/18723 | 1.78e-04 | 2.30e-03 | 81 |
| GO:190370614 | Endometrium | AEH | regulation of hemopoiesis | 63/2100 | 367/18723 | 3.81e-04 | 4.10e-03 | 63 |
| GO:00508709 | Endometrium | AEH | positive regulation of T cell activation | 41/2100 | 216/18723 | 5.08e-04 | 5.18e-03 | 41 |
| GO:00071599 | Endometrium | AEH | leukocyte cell-cell adhesion | 63/2100 | 371/18723 | 5.11e-04 | 5.21e-03 | 63 |
| GO:00508639 | Endometrium | AEH | regulation of T cell activation | 57/2100 | 329/18723 | 5.58e-04 | 5.59e-03 | 57 |
| GO:19030379 | Endometrium | AEH | regulation of leukocyte cell-cell adhesion | 57/2100 | 336/18723 | 9.42e-04 | 8.57e-03 | 57 |
| GO:00018198 | Endometrium | AEH | positive regulation of cytokine production | 71/2100 | 467/18723 | 4.76e-03 | 3.02e-02 | 71 |
| GO:004578517 | Endometrium | EEC | positive regulation of cell adhesion | 98/2168 | 437/18723 | 6.15e-11 | 8.38e-09 | 98 |
| GO:002240715 | Endometrium | EEC | regulation of cell-cell adhesion | 84/2168 | 448/18723 | 4.98e-06 | 1.24e-04 | 84 |
| GO:002240914 | Endometrium | EEC | positive regulation of cell-cell adhesion | 56/2168 | 284/18723 | 4.36e-05 | 7.15e-04 | 56 |
| GO:004211014 | Endometrium | EEC | T cell activation | 85/2168 | 487/18723 | 6.81e-05 | 1.01e-03 | 85 |
| GO:190370615 | Endometrium | EEC | regulation of hemopoiesis | 67/2168 | 367/18723 | 1.01e-04 | 1.40e-03 | 67 |
| GO:000715914 | Endometrium | EEC | leukocyte cell-cell adhesion | 67/2168 | 371/18723 | 1.41e-04 | 1.82e-03 | 67 |
| GO:190303913 | Endometrium | EEC | positive regulation of leukocyte cell-cell adhesion | 47/2168 | 239/18723 | 1.84e-04 | 2.26e-03 | 47 |
| GO:005086313 | Endometrium | EEC | regulation of T cell activation | 60/2168 | 329/18723 | 2.33e-04 | 2.75e-03 | 60 |
| GO:190303713 | Endometrium | EEC | regulation of leukocyte cell-cell adhesion | 60/2168 | 336/18723 | 4.13e-04 | 4.36e-03 | 60 |
| Page: 1 2 3 4 5 6 7 8 9 10 |
| Pathway ID | Tissue | Disease Stage | Description | Gene Ratio | Bg Ratio | pvalue | p.adjust | qvalue | Count |
| Page: 1 |
Top |
Cell-cell communication analysis |
| Identification of potential cell-cell interactions between two cell types and their ligand-receptor pairs for different disease states |
| Ligand | Receptor | LRpair | Pathway | Tissue | Disease Stage |
| Page: 1 |
Top |
Single-cell gene regulatory network inference analysis |
| Find out the significant the regulons (TFs) and the target genes of each regulon across cell types for different disease states |
| TF | Cell Type | Tissue | Disease Stage | Target Gene | RSS | Regulon Activity |
| ∗The dot plots of a searched regulon are shown for all cell subpopulations in each disease state of each tissue based on the regulon specific score inferred using pySCENIC and by calculating the average expression. |
| Page: 1 |
Top |
Somatic mutation of malignant transformation related genes |
| Annotation of somatic variants for genes involved in malignant transformation |
| Hugo Symbol | Variant Class | Variant Classification | dbSNP RS | HGVSc | HGVSp | HGVSp Short | SWISSPROT | BIOTYPE | SIFT | PolyPhen | Tumor Sample Barcode | Tissue | Histology | Sex | Age | Stage | Therapy Types | Drugs | Outcome |
| CD83 | SNV | Missense_Mutation | c.101C>T | p.Pro34Leu | p.P34L | Q01151 | protein_coding | deleterious(0) | possibly_damaging(0.874) | TCGA-AO-A03R-01 | Breast | breast invasive carcinoma | Female | <65 | I/II | Chemotherapy | doxorubicin | SD | |
| CD83 | SNV | Missense_Mutation | c.251C>T | p.Ala84Val | p.A84V | Q01151 | protein_coding | tolerated(0.52) | benign(0.022) | TCGA-C8-A12Z-01 | Breast | breast invasive carcinoma | Female | <65 | I/II | Chemotherapy | 5-fluorouracil | CR | |
| CD83 | SNV | Missense_Mutation | c.425N>A | p.Arg142Lys | p.R142K | Q01151 | protein_coding | tolerated(0.57) | benign(0.007) | TCGA-D8-A1J8-01 | Breast | breast invasive carcinoma | Female | >=65 | I/II | Hormone Therapy | nolvadex | SD | |
| CD83 | SNV | Missense_Mutation | novel | c.538A>C | p.Met180Leu | p.M180L | Q01151 | protein_coding | tolerated(0.25) | benign(0) | TCGA-AA-A029-01 | Colorectum | colon adenocarcinoma | Male | >=65 | I/II | Unknown | Unknown | SD |
| CD83 | SNV | Missense_Mutation | c.405A>T | p.Glu135Asp | p.E135D | Q01151 | protein_coding | tolerated(0.45) | benign(0.012) | TCGA-DY-A1DG-01 | Colorectum | rectum adenocarcinoma | Male | >=65 | I/II | Unknown | Unknown | PD | |
| CD83 | deletion | Frame_Shift_Del | c.549delN | p.Leu185SerfsTer10 | p.L185Sfs*10 | Q01151 | protein_coding | TCGA-A6-6780-01 | Colorectum | colon adenocarcinoma | Male | >=65 | I/II | Unknown | Unknown | SD | |||
| CD83 | insertion | Frame_Shift_Ins | novel | c.594_595insG | p.Pro199AlafsTer18 | p.P199Afs*18 | Q01151 | protein_coding | TCGA-AA-A02J-01 | Colorectum | colon adenocarcinoma | Female | >=65 | III/IV | Unknown | Unknown | PD | ||
| CD83 | SNV | Missense_Mutation | c.213N>T | p.Gln71His | p.Q71H | Q01151 | protein_coding | tolerated(0.06) | benign(0.009) | TCGA-AX-A06F-01 | Endometrium | uterine corpus endometrioid carcinoma | Female | <65 | III/IV | Chemotherapy | carboplatin | SD | |
| CD83 | SNV | Missense_Mutation | novel | c.473N>C | p.Leu158Pro | p.L158P | Q01151 | protein_coding | deleterious(0) | probably_damaging(0.997) | TCGA-AX-A3FT-01 | Endometrium | uterine corpus endometrioid carcinoma | Female | <65 | I/II | Unknown | Unknown | SD |
| CD83 | SNV | Missense_Mutation | rs542953972 | c.500G>A | p.Arg167Gln | p.R167Q | Q01151 | protein_coding | tolerated(0.08) | benign(0.022) | TCGA-BG-A0MS-01 | Endometrium | uterine corpus endometrioid carcinoma | Female | <65 | III/IV | Chemotherapy | carboplatin | SD |
| Page: 1 2 3 |
Top |
Related drugs of malignant transformation related genes |
| Identification of chemicals and drugs interact with genes involved in malignant transfromation |
| (DGIdb 4.0) |
| Entrez ID | Symbol | Category | Interaction Types | Drug Claim Name | Drug Name | PMIDs |
| 9308 | CD83 | DRUGGABLE GENOME, EXTERNAL SIDE OF PLASMA MEMBRANE | SULFASALAZINE | SULFASALAZINE | 11471196 | |
| 9308 | CD83 | DRUGGABLE GENOME, EXTERNAL SIDE OF PLASMA MEMBRANE | CD40L | 11093145 |
| Page: 1 |

Copyright 2023-Present -The University of Texas Health Science Center at Houston |