
|
|||||
|
 | |
| |
| |
| |
| |
| |
|
Gene: CD79A |
Gene summary for CD79A |
| Gene information | Species | Human | Gene symbol | CD79A | Gene ID | 973 |
| Gene name | CD79a molecule | |
| Gene Alias | IGA | |
| Cytomap | 19q13.2 | |
| Gene Type | protein-coding | GO ID | GO:0001775 | UniProtAcc | P11912 |
Top |
Malignant transformation analysis |
| Identification of the aberrant gene expression in precancerous and cancerous lesions by comparing the gene expression of stem-like cells in diseased tissues with normal stem cells |
| Entrez ID | Symbol | Replicates | Species | Organ | Tissue | Adj P-value | Log2FC | Malignancy |
| 973 | CD79A | C06 | Human | Oral cavity | OSCC | 8.79e-04 | 4.83e-01 | 0.2699 |
| 973 | CD79A | C09 | Human | Oral cavity | OSCC | 6.59e-11 | 3.35e-01 | 0.1431 |
| 973 | CD79A | LN22 | Human | Oral cavity | OSCC | 3.64e-08 | 9.27e-01 | 0.1733 |
| 973 | CD79A | LN46 | Human | Oral cavity | OSCC | 1.29e-11 | 5.24e-01 | 0.1666 |
| 973 | CD79A | LP15 | Human | Oral cavity | LP | 1.57e-03 | 7.25e-01 | 0.2174 |
| 973 | CD79A | Dong_P1 | Human | Prostate | Tumor | 1.11e-05 | 1.32e-01 | 0.035 |
| 973 | CD79A | Dong_P5 | Human | Prostate | Tumor | 2.03e-02 | 6.29e-02 | 0.053 |
| 973 | CD79A | GSM5353216_PA_PB1A_Pool_1_3_S50_L002 | Human | Prostate | Tumor | 3.71e-02 | 5.41e-01 | 0.159 |
| 973 | CD79A | GSM5353218_PA_PB1B_Pool_1_2_S74_L003 | Human | Prostate | Tumor | 3.54e-05 | 6.54e-01 | 0.1479 |
| 973 | CD79A | GSM5353220_PA_PB1B_Pool_3_S51_L002 | Human | Prostate | Tumor | 7.14e-06 | 6.34e-01 | 0.1531 |
| 973 | CD79A | GSM5353221_PA_PB2A_Pool_1_3_S25_L001 | Human | Prostate | Tumor | 4.53e-02 | 2.40e-01 | 0.1633 |
| 973 | CD79A | GSM5353225_PA_PR5196-1_Pool_1_2_3_S53_L002 | Human | Prostate | Tumor | 3.50e-02 | 3.76e-01 | 0.1619 |
| 973 | CD79A | GSM5353226_PA_PR5196-2_Pool_1_2_3_S54_L002 | Human | Prostate | Tumor | 4.40e-03 | 4.49e-01 | 0.159 |
| 973 | CD79A | Adj_PTCwithHT_6 | Human | Thyroid | HT | 1.86e-55 | 1.59e+00 | 0.02 |
| 973 | CD79A | Adj_PTCwithHT_8 | Human | Thyroid | HT | 1.11e-07 | 4.97e-01 | 0.0267 |
| 973 | CD79A | PTCwithHT_6 | Human | Thyroid | HT | 3.17e-19 | 8.75e-01 | 0.02 |
| 973 | CD79A | nodule-WTA | Human | Thyroid | goiters | 1.25e-04 | 2.61e-01 | 0.0534 |
| Page: 1 |
| Tissue | Expression Dynamics | Abbreviation |
| Oral Cavity |  | EOLP: Erosive Oral lichen planus |
| LP: leukoplakia | ||
| NEOLP: Non-erosive oral lichen planus | ||
| OSCC: Oral squamous cell carcinoma | ||
| Prostate | 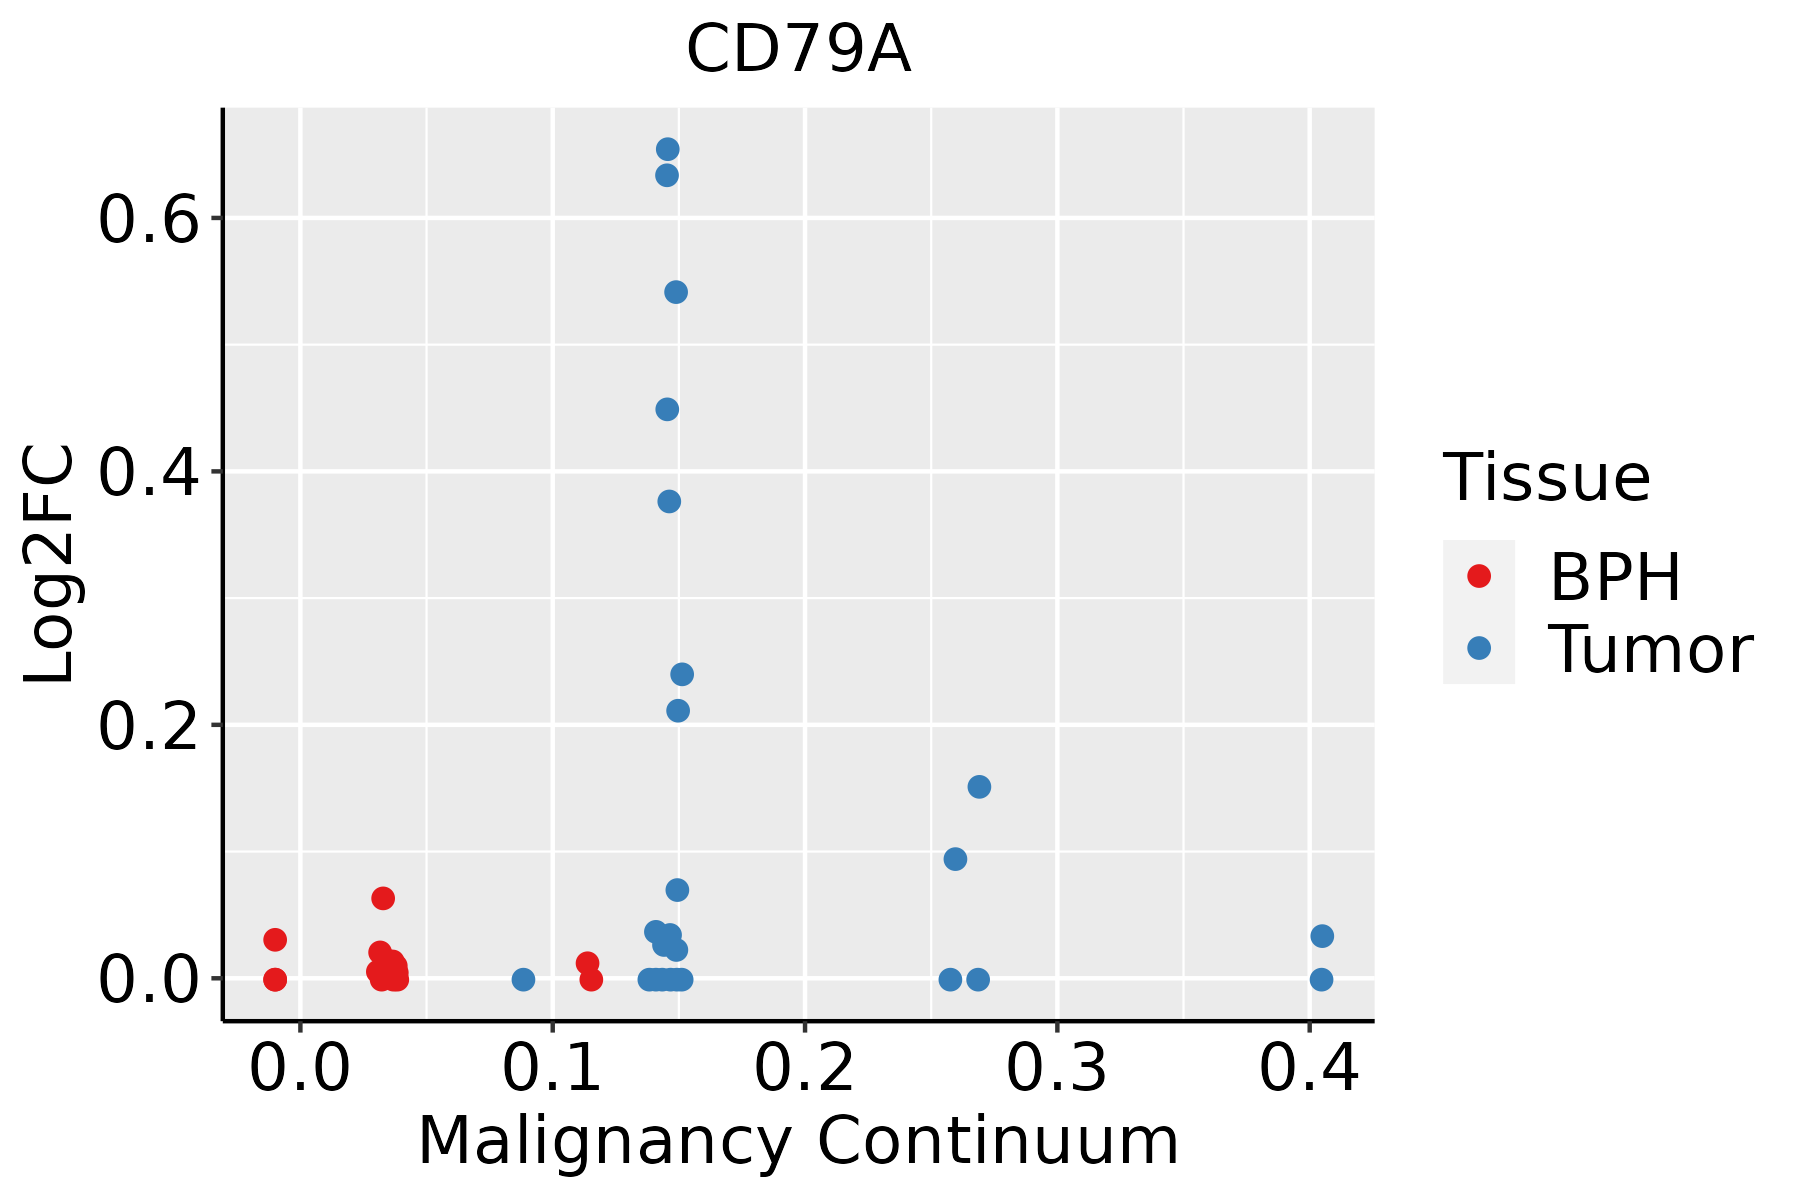 | BPH: Benign Prostatic Hyperplasia |
| Thyroid |  | ATC: Anaplastic thyroid cancer |
| HT: Hashimoto's thyroiditis | ||
| PTC: Papillary thyroid cancer |
| ∗log2FC in expression of this searched gene in stem-like cells from each diseased tissue sample relative to stem-like cells in normal samples in each tissue plotted against the malignancy continuum. Samples are colored based on if they are from different disease stage. |
Top |
Malignant transformation related pathway analysis |
| Find out the enriched GO biological processes and KEGG pathways involved in transition from healthy to precancer to cancer |
| Tissue | Disease Stage | Enriched GO biological Processes |
| Colorectum | AD |  |
| Colorectum | SER |  |
| Colorectum | MSS |  |
| Colorectum | MSI-H |  |
| Colorectum | FAP |  |
| ∗Top 15 enriched GO BP terms are showed in the bar plot of each disease state in each tissue. Each row represents a significant GO biological process which is colored according to the -log10(p.adjust). |
| Page: 1 2 3 4 5 6 7 8 9 |
| GO ID | Tissue | Disease Stage | Description | Gene Ratio | Bg Ratio | pvalue | p.adjust | Count |
| GO:19031316 | Oral cavity | OSCC | mononuclear cell differentiation | 210/7305 | 426/18723 | 8.44e-06 | 9.02e-05 | 210 |
| GO:00300983 | Oral cavity | OSCC | lymphocyte differentiation | 179/7305 | 374/18723 | 2.74e-04 | 1.74e-03 | 179 |
| GO:00027646 | Oral cavity | OSCC | immune response-regulating signaling pathway | 212/7305 | 468/18723 | 2.93e-03 | 1.27e-02 | 212 |
| GO:00706618 | Oral cavity | OSCC | leukocyte proliferation | 145/7305 | 318/18723 | 9.31e-03 | 3.33e-02 | 145 |
| GO:00466517 | Oral cavity | OSCC | lymphocyte proliferation | 131/7305 | 288/18723 | 1.41e-02 | 4.67e-02 | 131 |
| GO:190313113 | Prostate | Tumor | mononuclear cell differentiation | 102/3246 | 426/18723 | 2.87e-04 | 2.32e-03 | 102 |
| GO:003009811 | Prostate | Tumor | lymphocyte differentiation | 87/3246 | 374/18723 | 1.93e-03 | 1.12e-02 | 87 |
| GO:007066110 | Thyroid | HT | leukocyte proliferation | 44/1272 | 318/18723 | 5.29e-06 | 1.64e-04 | 44 |
| GO:19031319 | Thyroid | HT | mononuclear cell differentiation | 54/1272 | 426/18723 | 6.88e-06 | 2.00e-04 | 54 |
| GO:00466519 | Thyroid | HT | lymphocyte proliferation | 40/1272 | 288/18723 | 1.27e-05 | 3.30e-04 | 40 |
| GO:00329438 | Thyroid | HT | mononuclear cell proliferation | 40/1272 | 291/18723 | 1.63e-05 | 3.95e-04 | 40 |
| GO:00300986 | Thyroid | HT | lymphocyte differentiation | 47/1272 | 374/18723 | 3.32e-05 | 7.02e-04 | 47 |
| GO:00022536 | Thyroid | HT | activation of immune response | 47/1272 | 375/18723 | 3.55e-05 | 7.40e-04 | 47 |
| GO:00421133 | Thyroid | HT | B cell activation | 39/1272 | 334/18723 | 6.66e-04 | 7.61e-03 | 39 |
| GO:00027648 | Thyroid | HT | immune response-regulating signaling pathway | 50/1272 | 468/18723 | 9.96e-04 | 1.02e-02 | 50 |
| GO:00508515 | Thyroid | HT | antigen receptor-mediated signaling pathway | 27/1272 | 240/18723 | 6.87e-03 | 4.20e-02 | 27 |
| GO:00024293 | Thyroid | HT | immune response-activating cell surface receptor signaling pathway | 31/1272 | 291/18723 | 8.69e-03 | 4.92e-02 | 31 |
| GO:00027573 | Thyroid | HT | immune response-activating signal transduction | 31/1272 | 291/18723 | 8.69e-03 | 4.92e-02 | 31 |
| Page: 1 |
| Pathway ID | Tissue | Disease Stage | Description | Gene Ratio | Bg Ratio | pvalue | p.adjust | qvalue | Count |
| Page: 1 |
Top |
Cell-cell communication analysis |
| Identification of potential cell-cell interactions between two cell types and their ligand-receptor pairs for different disease states |
| Ligand | Receptor | LRpair | Pathway | Tissue | Disease Stage |
| Page: 1 |
Top |
Single-cell gene regulatory network inference analysis |
| Find out the significant the regulons (TFs) and the target genes of each regulon across cell types for different disease states |
| TF | Cell Type | Tissue | Disease Stage | Target Gene | RSS | Regulon Activity |
| ∗The dot plots of a searched regulon are shown for all cell subpopulations in each disease state of each tissue based on the regulon specific score inferred using pySCENIC and by calculating the average expression. |
| Page: 1 |
Top |
Somatic mutation of malignant transformation related genes |
| Annotation of somatic variants for genes involved in malignant transformation |
| Hugo Symbol | Variant Class | Variant Classification | dbSNP RS | HGVSc | HGVSp | HGVSp Short | SWISSPROT | BIOTYPE | SIFT | PolyPhen | Tumor Sample Barcode | Tissue | Histology | Sex | Age | Stage | Therapy Types | Drugs | Outcome |
| CD79A | SNV | Missense_Mutation | novel | c.423N>T | p.Lys141Asn | p.K141N | P11912 | protein_coding | deleterious(0) | possibly_damaging(0.895) | TCGA-AN-A046-01 | Breast | breast invasive carcinoma | Female | >=65 | I/II | Unknown | Unknown | SD |
| CD79A | SNV | Missense_Mutation | novel | c.442N>A | p.Glu148Lys | p.E148K | P11912 | protein_coding | deleterious(0) | possibly_damaging(0.846) | TCGA-C8-A8HP-01 | Breast | breast invasive carcinoma | Female | <65 | III/IV | Chemotherapy | 5-fluorouracil | CR |
| CD79A | SNV | Missense_Mutation | c.45N>G | p.Ile15Met | p.I15M | P11912 | protein_coding | tolerated(0.17) | benign(0.233) | TCGA-DG-A2KK-01 | Cervix | cervical & endocervical cancer | Female | <65 | III/IV | Chemotherapy | cisplatin | SD | |
| CD79A | SNV | Missense_Mutation | rs146480366 | c.13C>T | p.Pro5Ser | p.P5S | P11912 | protein_coding | tolerated_low_confidence(0.19) | benign(0) | TCGA-A5-A0G2-01 | Endometrium | uterine corpus endometrioid carcinoma | Female | <65 | III/IV | Unknown | Unknown | SD |
| CD79A | SNV | Missense_Mutation | rs782657641 | c.202C>T | p.Arg68Cys | p.R68C | P11912 | protein_coding | deleterious(0.04) | possibly_damaging(0.825) | TCGA-AX-A1CE-01 | Endometrium | uterine corpus endometrioid carcinoma | Female | <65 | I/II | Unspecific | Paclitaxel | SD |
| CD79A | SNV | Missense_Mutation | rs782657641 | c.202N>T | p.Arg68Cys | p.R68C | P11912 | protein_coding | deleterious(0.04) | possibly_damaging(0.825) | TCGA-AX-A3FT-01 | Endometrium | uterine corpus endometrioid carcinoma | Female | <65 | I/II | Unknown | Unknown | SD |
| CD79A | SNV | Missense_Mutation | novel | c.206T>C | p.Val69Ala | p.V69A | P11912 | protein_coding | tolerated(0.21) | benign(0.192) | TCGA-B5-A3FC-01 | Endometrium | uterine corpus endometrioid carcinoma | Female | <65 | I/II | Unknown | Unknown | SD |
| CD79A | SNV | Missense_Mutation | novel | c.548A>G | p.Glu183Gly | p.E183G | P11912 | protein_coding | deleterious(0.04) | benign(0.323) | TCGA-B5-A3FC-01 | Endometrium | uterine corpus endometrioid carcinoma | Female | <65 | I/II | Unknown | Unknown | SD |
| CD79A | SNV | Missense_Mutation | c.240N>A | p.Phe80Leu | p.F80L | P11912 | protein_coding | tolerated(0.53) | benign(0.001) | TCGA-D1-A17Q-01 | Endometrium | uterine corpus endometrioid carcinoma | Female | <65 | I/II | Unknown | Unknown | SD | |
| CD79A | SNV | Missense_Mutation | novel | c.672N>T | p.Glu224Asp | p.E224D | P11912 | protein_coding | deleterious(0) | probably_damaging(0.991) | TCGA-E6-A1M0-01 | Endometrium | uterine corpus endometrioid carcinoma | Female | <65 | III/IV | Chemotherapy | carboplatin | SD |
| Page: 1 2 3 |
Top |
Related drugs of malignant transformation related genes |
| Identification of chemicals and drugs interact with genes involved in malignant transfromation |
| (DGIdb 4.0) |
| Entrez ID | Symbol | Category | Interaction Types | Drug Claim Name | Drug Name | PMIDs |
| Page: 1 |

Copyright 2023-Present -The University of Texas Health Science Center at Houston |