| Tissue | Expression Dynamics | Abbreviation |
| Esophagus | 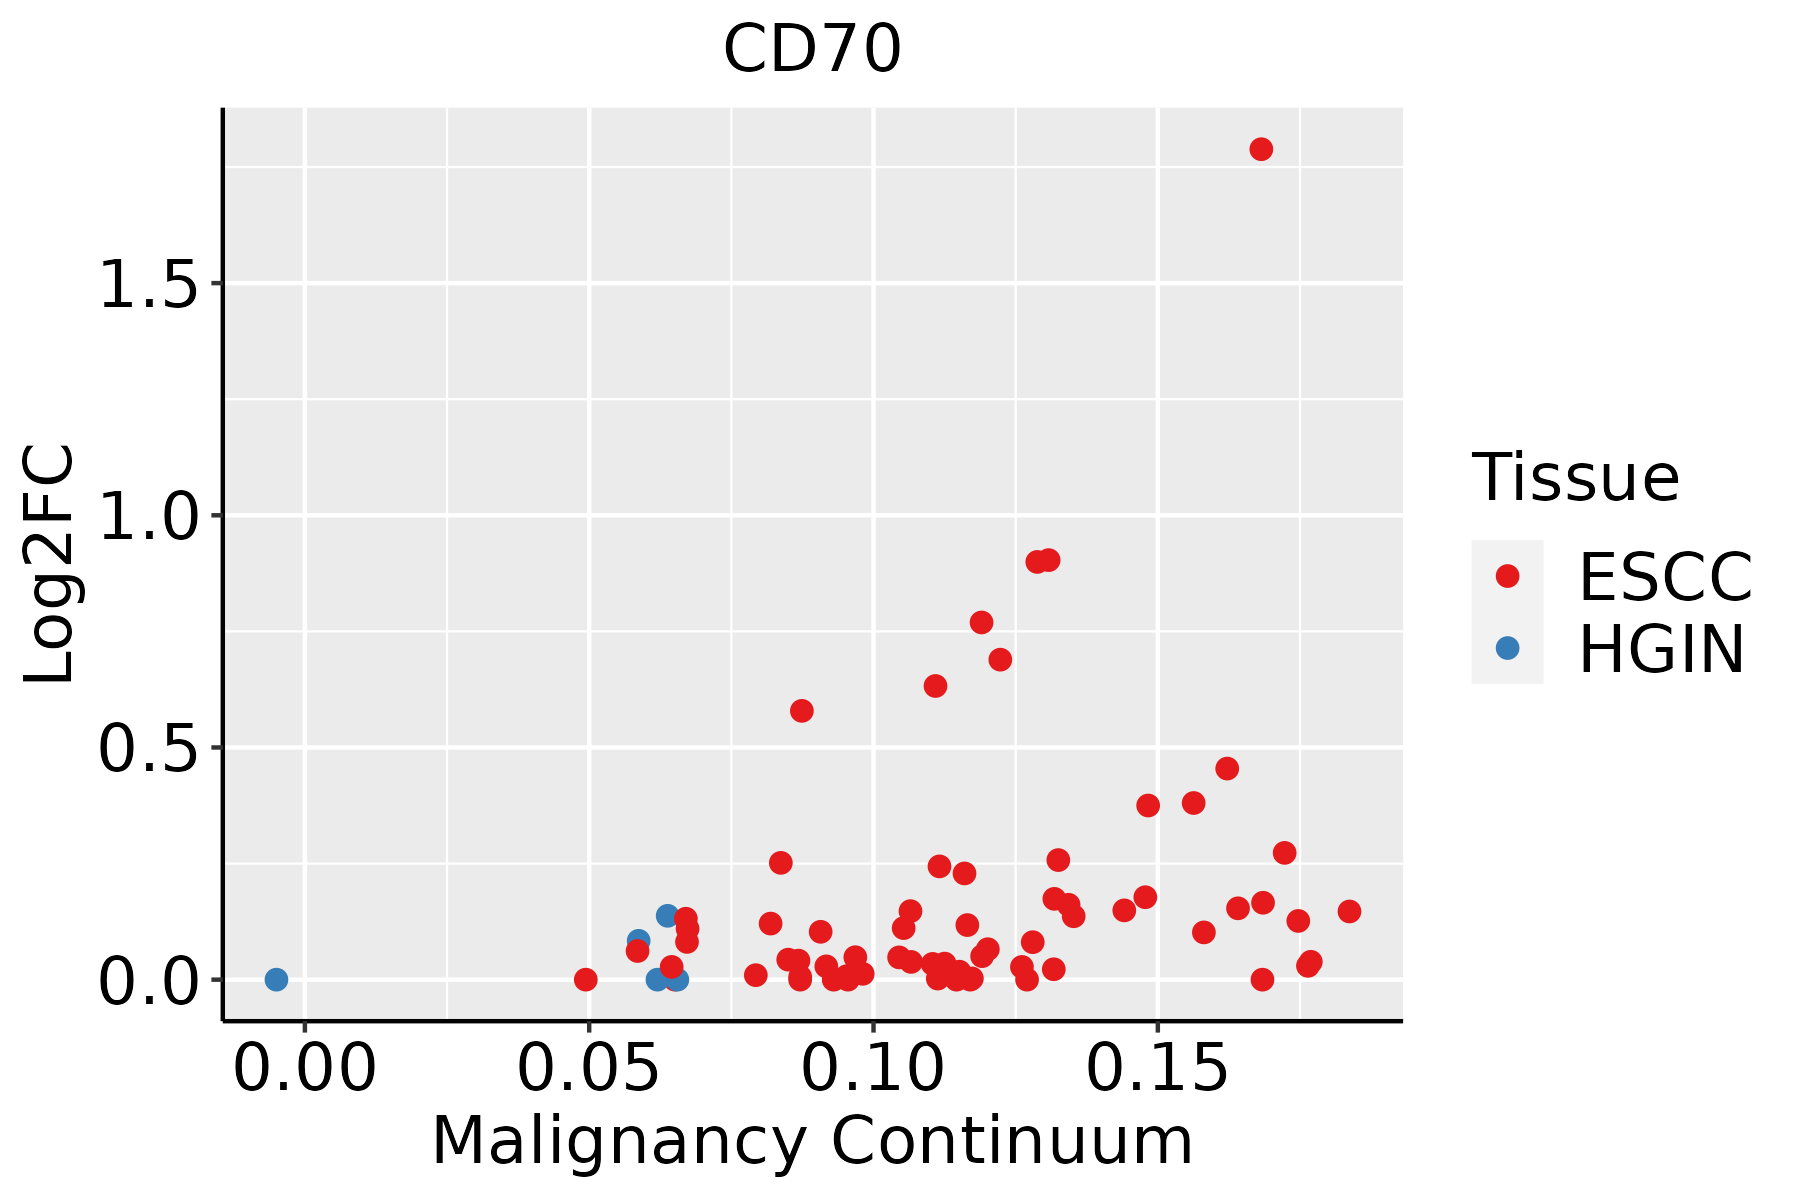 | ESCC: Esophageal squamous cell carcinoma |
| HGIN: High-grade intraepithelial neoplasias |
| LGIN: Low-grade intraepithelial neoplasias |
| Liver |  | HCC: Hepatocellular carcinoma |
| NAFLD: Non-alcoholic fatty liver disease |
| Oral Cavity |  | EOLP: Erosive Oral lichen planus |
| LP: leukoplakia |
| NEOLP: Non-erosive oral lichen planus |
| OSCC: Oral squamous cell carcinoma |
| Thyroid | 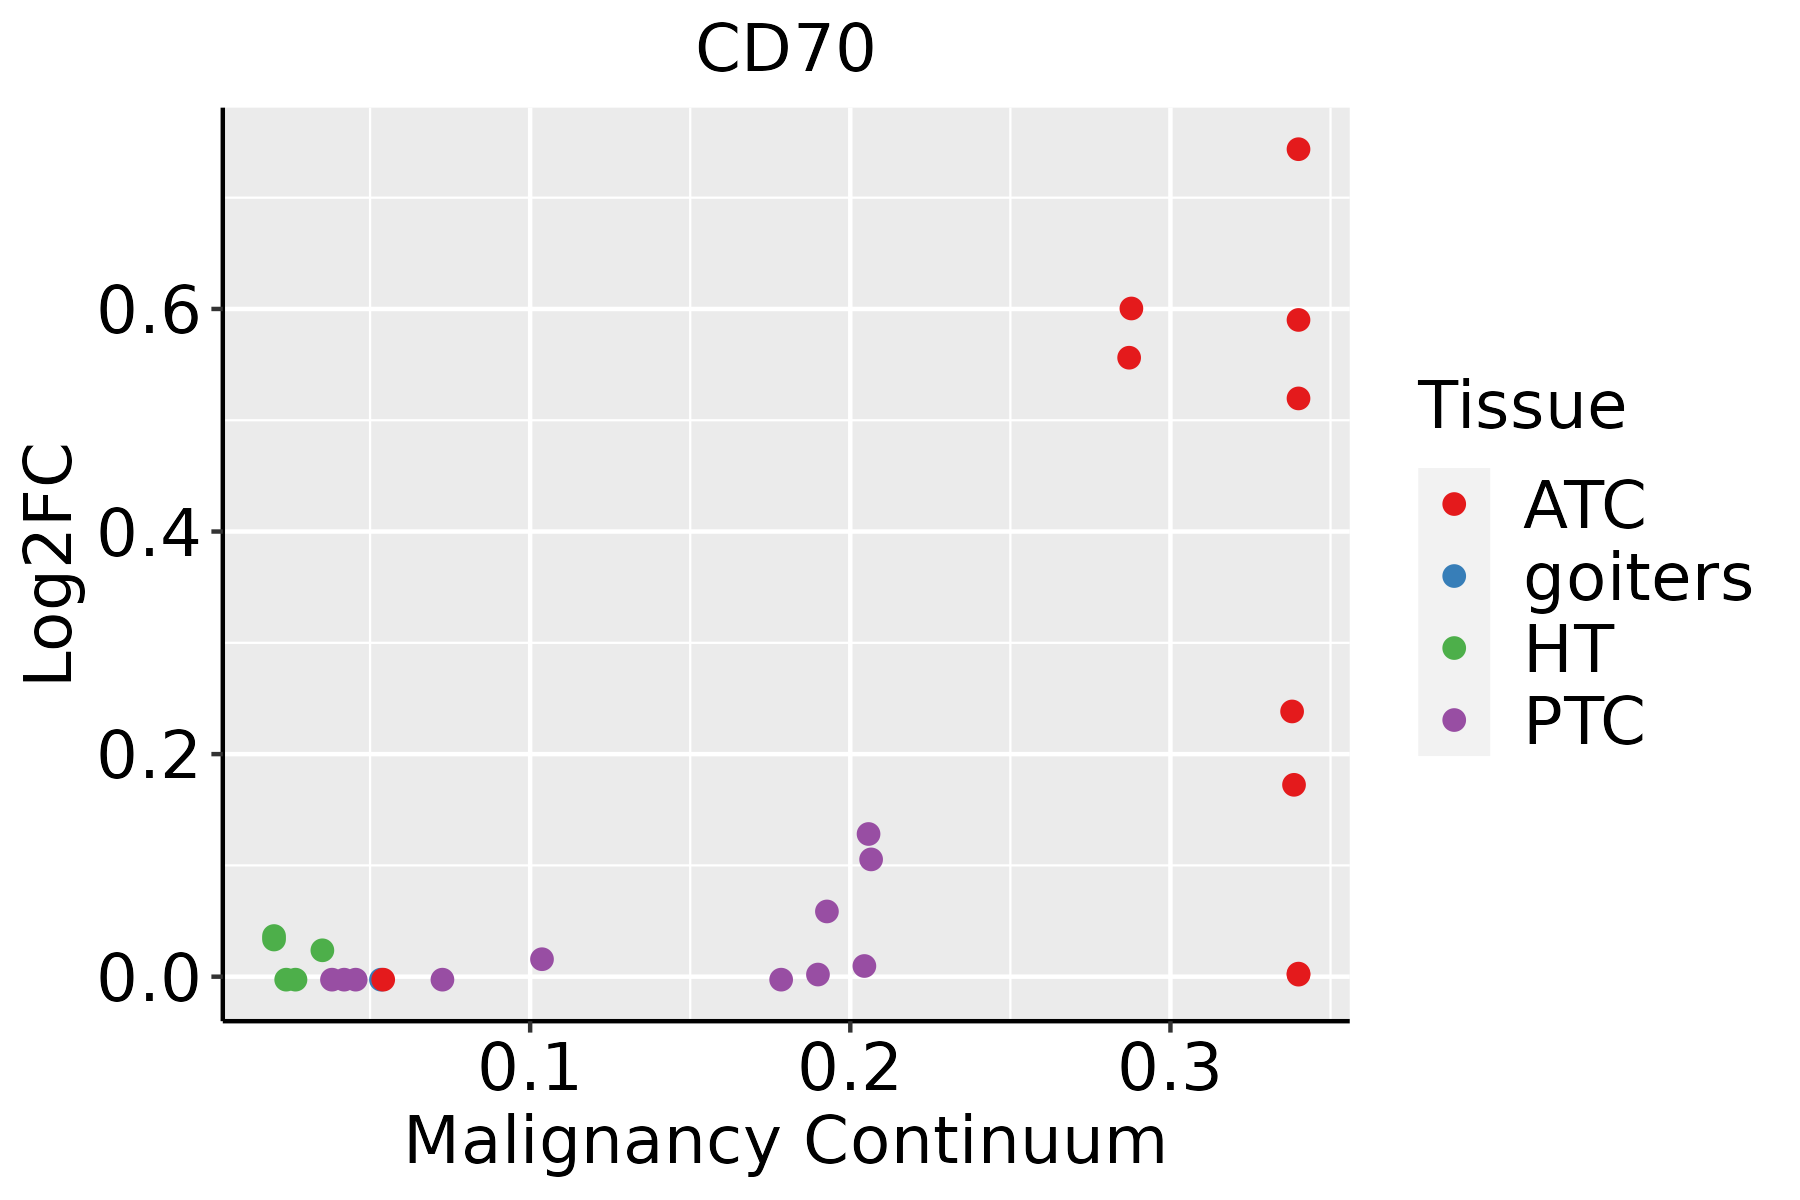 | ATC: Anaplastic thyroid cancer |
| HT: Hashimoto's thyroiditis |
| PTC: Papillary thyroid cancer |
| GO ID | Tissue | Disease Stage | Description | Gene Ratio | Bg Ratio | pvalue | p.adjust | Count |
| GO:0097191111 | Esophagus | ESCC | extrinsic apoptotic signaling pathway | 159/8552 | 219/18723 | 4.12e-16 | 2.94e-14 | 159 |
| GO:004578527 | Esophagus | ESCC | positive regulation of cell adhesion | 255/8552 | 437/18723 | 5.07e-08 | 9.11e-07 | 255 |
| GO:003320914 | Esophagus | ESCC | tumor necrosis factor-mediated signaling pathway | 67/8552 | 99/18723 | 7.87e-06 | 7.72e-05 | 67 |
| GO:003461220 | Esophagus | ESCC | response to tumor necrosis factor | 149/8552 | 253/18723 | 1.47e-05 | 1.33e-04 | 149 |
| GO:007135620 | Esophagus | ESCC | cellular response to tumor necrosis factor | 132/8552 | 229/18723 | 1.69e-04 | 1.11e-03 | 132 |
| GO:002240720 | Esophagus | ESCC | regulation of cell-cell adhesion | 239/8552 | 448/18723 | 5.88e-04 | 3.19e-03 | 239 |
| GO:004211018 | Esophagus | ESCC | T cell activation | 256/8552 | 487/18723 | 1.18e-03 | 5.87e-03 | 256 |
| GO:002240919 | Esophagus | ESCC | positive regulation of cell-cell adhesion | 155/8552 | 284/18723 | 1.50e-03 | 7.06e-03 | 155 |
| GO:005087015 | Esophagus | ESCC | positive regulation of T cell activation | 117/8552 | 216/18723 | 7.23e-03 | 2.62e-02 | 117 |
| GO:190303916 | Esophagus | ESCC | positive regulation of leukocyte cell-cell adhesion | 128/8552 | 239/18723 | 8.40e-03 | 2.96e-02 | 128 |
| GO:000715918 | Esophagus | ESCC | leukocyte cell-cell adhesion | 192/8552 | 371/18723 | 1.03e-02 | 3.51e-02 | 192 |
| GO:190303717 | Esophagus | ESCC | regulation of leukocyte cell-cell adhesion | 174/8552 | 336/18723 | 1.36e-02 | 4.43e-02 | 174 |
| GO:009719122 | Liver | HCC | extrinsic apoptotic signaling pathway | 143/7958 | 219/18723 | 6.99e-12 | 2.97e-10 | 143 |
| GO:003461211 | Liver | HCC | response to tumor necrosis factor | 132/7958 | 253/18723 | 1.14e-03 | 6.48e-03 | 132 |
| GO:004578512 | Liver | HCC | positive regulation of cell adhesion | 215/7958 | 437/18723 | 2.53e-03 | 1.22e-02 | 215 |
| GO:007135611 | Liver | HCC | cellular response to tumor necrosis factor | 115/7958 | 229/18723 | 1.08e-02 | 3.99e-02 | 115 |
| GO:009719120 | Oral cavity | OSCC | extrinsic apoptotic signaling pathway | 142/7305 | 219/18723 | 7.34e-15 | 4.55e-13 | 142 |
| GO:003461218 | Oral cavity | OSCC | response to tumor necrosis factor | 143/7305 | 253/18723 | 1.09e-08 | 2.23e-07 | 143 |
| GO:004578520 | Oral cavity | OSCC | positive regulation of cell adhesion | 225/7305 | 437/18723 | 6.06e-08 | 1.09e-06 | 225 |
| GO:007135618 | Oral cavity | OSCC | cellular response to tumor necrosis factor | 128/7305 | 229/18723 | 1.49e-07 | 2.49e-06 | 128 |
| Hugo Symbol | Variant Class | Variant Classification | dbSNP RS | HGVSc | HGVSp | HGVSp Short | SWISSPROT | BIOTYPE | SIFT | PolyPhen | Tumor Sample Barcode | Tissue | Histology | Sex | Age | Stage | Therapy Types | Drugs | Outcome |
| CD70 | SNV | Missense_Mutation | | c.377N>A | p.Thr126Asn | p.T126N | P32970 | protein_coding | deleterious_low_confidence(0.01) | possibly_damaging(0.462) | TCGA-A2-A04R-01 | Breast | breast invasive carcinoma | Female | <65 | I/II | Chemotherapy | taxol | SD |
| CD70 | SNV | Missense_Mutation | rs548095306 | c.388N>A | p.Val130Met | p.V130M | P32970 | protein_coding | deleterious_low_confidence(0) | probably_damaging(0.954) | TCGA-AA-3845-01 | Colorectum | colon adenocarcinoma | Female | >=65 | I/II | Unknown | Unknown | PD |
| CD70 | SNV | Missense_Mutation | | c.32N>A | p.Arg11Gln | p.R11Q | P32970 | protein_coding | tolerated_low_confidence(0.49) | benign(0.441) | TCGA-AA-3848-01 | Colorectum | colon adenocarcinoma | Female | >=65 | III/IV | Unknown | Unknown | PD |
| CD70 | SNV | Missense_Mutation | novel | c.62N>T | p.Ala21Val | p.A21V | P32970 | protein_coding | tolerated_low_confidence(0.67) | benign(0.006) | TCGA-A5-A1OF-01 | Endometrium | uterine corpus endometrioid carcinoma | Female | <65 | I/II | Unknown | Unknown | SD |
| CD70 | SNV | Missense_Mutation | novel | c.275A>G | p.Asp92Gly | p.D92G | P32970 | protein_coding | deleterious_low_confidence(0.01) | possibly_damaging(0.816) | TCGA-AP-A056-01 | Endometrium | uterine corpus endometrioid carcinoma | Female | <65 | I/II | Unknown | Unknown | SD |
| CD70 | SNV | Missense_Mutation | rs141989071 | c.290N>A | p.Arg97His | p.R97H | P32970 | protein_coding | tolerated_low_confidence(0.06) | benign(0.068) | TCGA-AP-A059-01 | Endometrium | uterine corpus endometrioid carcinoma | Female | >=65 | I/II | Unknown | Unknown | SD |
| CD70 | SNV | Missense_Mutation | novel | c.365N>T | p.Arg122Met | p.R122M | P32970 | protein_coding | tolerated_low_confidence(0.13) | possibly_damaging(0.572) | TCGA-AP-A1DO-01 | Endometrium | uterine corpus endometrioid carcinoma | Female | <65 | I/II | Unknown | Unknown | SD |
| CD70 | SNV | Missense_Mutation | novel | c.416N>T | p.Ser139Ile | p.S139I | P32970 | protein_coding | deleterious_low_confidence(0.01) | possibly_damaging(0.684) | TCGA-AP-A1DV-01 | Endometrium | uterine corpus endometrioid carcinoma | Female | <65 | I/II | Unknown | Unknown | SD |
| CD70 | SNV | Missense_Mutation | novel | c.401C>T | p.Ser134Phe | p.S134F | P32970 | protein_coding | deleterious_low_confidence(0.02) | benign(0.063) | TCGA-B5-A3FC-01 | Endometrium | uterine corpus endometrioid carcinoma | Female | <65 | I/II | Unknown | Unknown | SD |
| CD70 | SNV | Missense_Mutation | rs750046562 | c.289C>T | p.Arg97Cys | p.R97C | P32970 | protein_coding | deleterious_low_confidence(0.03) | probably_damaging(0.958) | TCGA-D1-A176-01 | Endometrium | uterine corpus endometrioid carcinoma | Female | >=65 | I/II | Unknown | Unknown | SD |
| Entrez ID | Symbol | Category | Interaction Types | Drug Claim Name | Drug Name | PMIDs |
| 970 | CD70 | CLINICALLY ACTIONABLE, DRUGGABLE GENOME | | AMG 172 | | |
| 970 | CD70 | CLINICALLY ACTIONABLE, DRUGGABLE GENOME | | SGN-70 | | |
| 970 | CD70 | CLINICALLY ACTIONABLE, DRUGGABLE GENOME | | 4SCAR19 and 4SCAR70 | | |
| 970 | CD70 | CLINICALLY ACTIONABLE, DRUGGABLE GENOME | | MDX-1411 | MDX-1411 | |
| 970 | CD70 | CLINICALLY ACTIONABLE, DRUGGABLE GENOME | | MDX-1411 | MDX-1411 | |
| 970 | CD70 | CLINICALLY ACTIONABLE, DRUGGABLE GENOME | | MDX-1203 | | |
| 970 | CD70 | CLINICALLY ACTIONABLE, DRUGGABLE GENOME | | SGN-CD70A | | |
| 970 | CD70 | CLINICALLY ACTIONABLE, DRUGGABLE GENOME | | SGN-75 | VORSETUZUMAB MAFODOTIN | |
| 970 | CD70 | CLINICALLY ACTIONABLE, DRUGGABLE GENOME | | MDX-1203 | | |
| 970 | CD70 | CLINICALLY ACTIONABLE, DRUGGABLE GENOME | | Anti-hCD70 CAR transduced PBL | | |


