
|
|||||
|
 | |
| |
| |
| |
| |
| |
|
Gene: CD69 |
Gene summary for CD69 |
| Gene information | Species | Human | Gene symbol | CD69 | Gene ID | 969 |
| Gene name | CD69 molecule | |
| Gene Alias | AIM | |
| Cytomap | 12p13.31 | |
| Gene Type | protein-coding | GO ID | GO:0005575 | UniProtAcc | Q07108 |
Top |
Malignant transformation analysis |
| Identification of the aberrant gene expression in precancerous and cancerous lesions by comparing the gene expression of stem-like cells in diseased tissues with normal stem cells |
| Entrez ID | Symbol | Replicates | Species | Organ | Tissue | Adj P-value | Log2FC | Malignancy |
| 969 | CD69 | CA_HPV_1 | Human | Cervix | CC | 1.25e-05 | -1.63e-01 | 0.0264 |
| 969 | CD69 | CA_HPV_3 | Human | Cervix | CC | 1.24e-02 | -2.48e-01 | 0.0414 |
| 969 | CD69 | HSIL_HPV_1 | Human | Cervix | HSIL_HPV | 1.00e-07 | -5.91e-01 | 0.0116 |
| 969 | CD69 | HSIL_HPV_2 | Human | Cervix | HSIL_HPV | 1.14e-20 | -7.61e-01 | 0.0208 |
| 969 | CD69 | N_HPV_2 | Human | Cervix | N_HPV | 3.55e-19 | -5.06e-02 | -0.0131 |
| 969 | CD69 | CCI_1 | Human | Cervix | CC | 1.23e-03 | -8.09e-01 | 0.528 |
| 969 | CD69 | CCI_2 | Human | Cervix | CC | 3.50e-03 | -8.09e-01 | 0.5249 |
| 969 | CD69 | CCI_3 | Human | Cervix | CC | 5.04e-04 | -7.94e-01 | 0.516 |
| 969 | CD69 | CCII_1 | Human | Cervix | CC | 2.82e-08 | -8.09e-01 | 0.3249 |
| 969 | CD69 | Tumor | Human | Cervix | CC | 1.05e-26 | -8.09e-01 | 0.1241 |
| 969 | CD69 | sample1 | Human | Cervix | CC | 1.27e-06 | -8.09e-01 | 0.0959 |
| 969 | CD69 | sample3 | Human | Cervix | CC | 2.10e-22 | -8.00e-01 | 0.1387 |
| 969 | CD69 | H2 | Human | Cervix | HSIL_HPV | 2.34e-19 | -7.40e-01 | 0.0632 |
| 969 | CD69 | T1 | Human | Cervix | CC | 8.70e-14 | -7.97e-01 | 0.0918 |
| 969 | CD69 | T3 | Human | Cervix | CC | 1.78e-23 | -8.03e-01 | 0.1389 |
| 969 | CD69 | LZE11D | Human | Esophagus | HGIN | 1.69e-02 | 3.75e-01 | -0.005 |
| 969 | CD69 | LZE4T | Human | Esophagus | ESCC | 9.16e-11 | 1.30e+00 | 0.0811 |
| 969 | CD69 | LZE7T | Human | Esophagus | ESCC | 5.83e-04 | 6.33e-01 | 0.0667 |
| 969 | CD69 | LZE6T | Human | Esophagus | ESCC | 3.66e-23 | 2.88e+00 | 0.0845 |
| 969 | CD69 | P16T-E | Human | Esophagus | ESCC | 4.29e-03 | 2.57e-01 | 0.1153 |
| Page: 1 2 |
| Tissue | Expression Dynamics | Abbreviation |
| Cervix |  | CC: Cervix cancer |
| HSIL_HPV: HPV-infected high-grade squamous intraepithelial lesions | ||
| N_HPV: HPV-infected normal cervix | ||
| Esophagus | 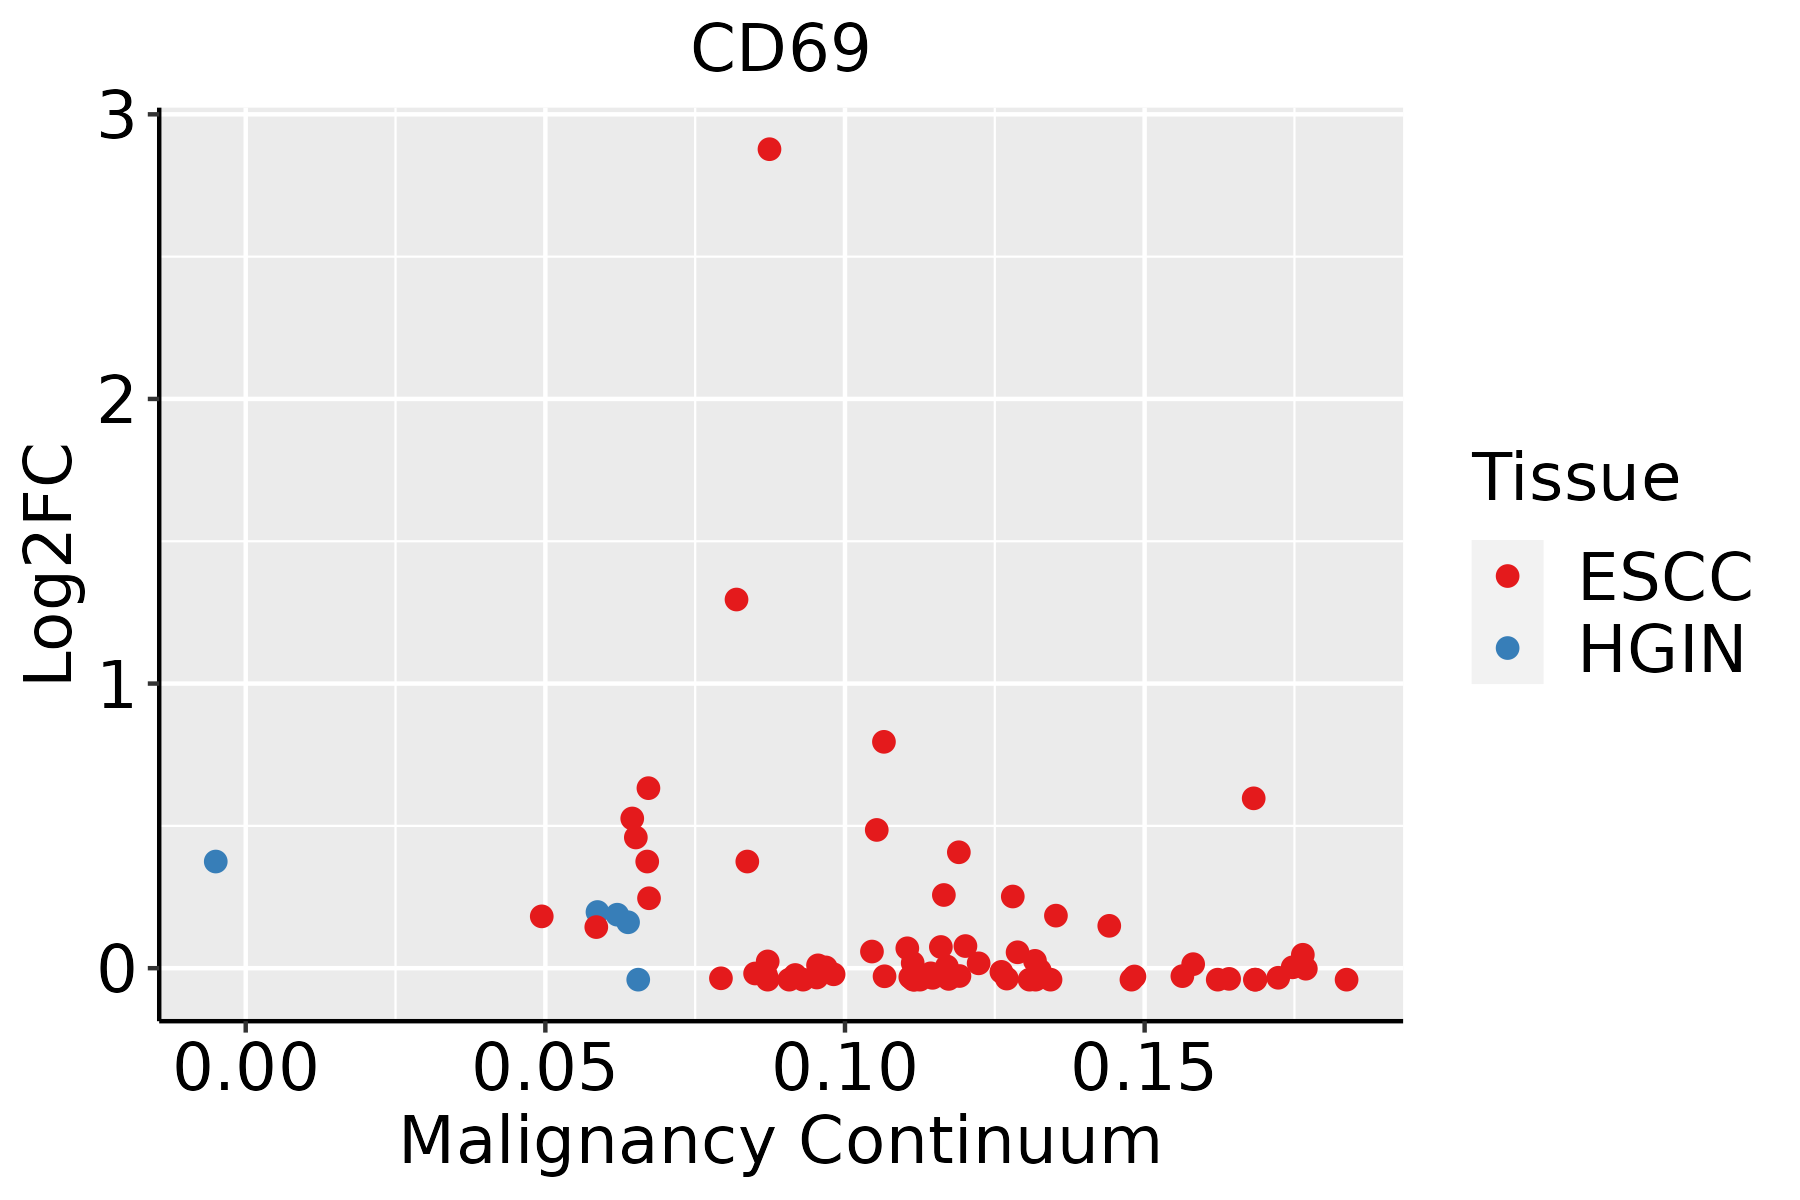 | ESCC: Esophageal squamous cell carcinoma |
| HGIN: High-grade intraepithelial neoplasias | ||
| LGIN: Low-grade intraepithelial neoplasias | ||
| Oral Cavity | 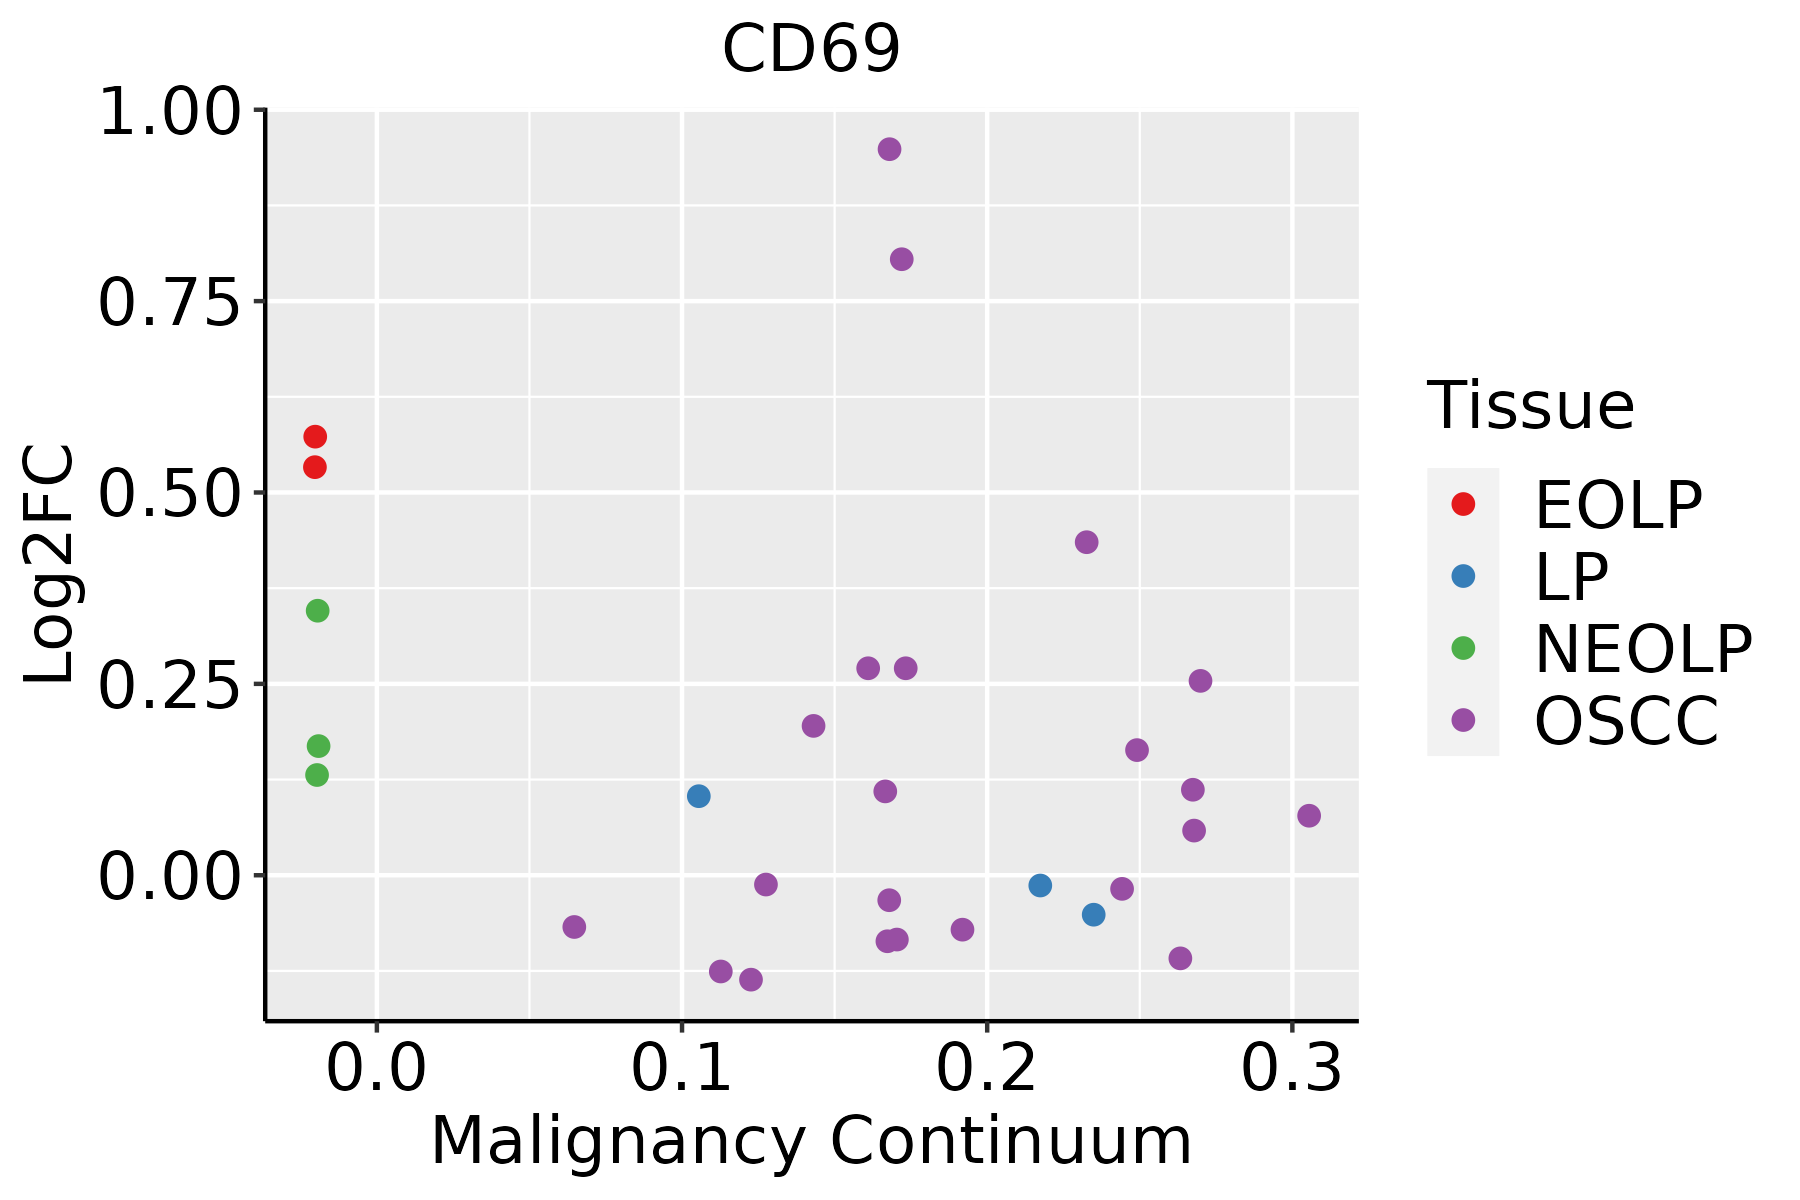 | EOLP: Erosive Oral lichen planus |
| LP: leukoplakia | ||
| NEOLP: Non-erosive oral lichen planus | ||
| OSCC: Oral squamous cell carcinoma | ||
| Prostate | 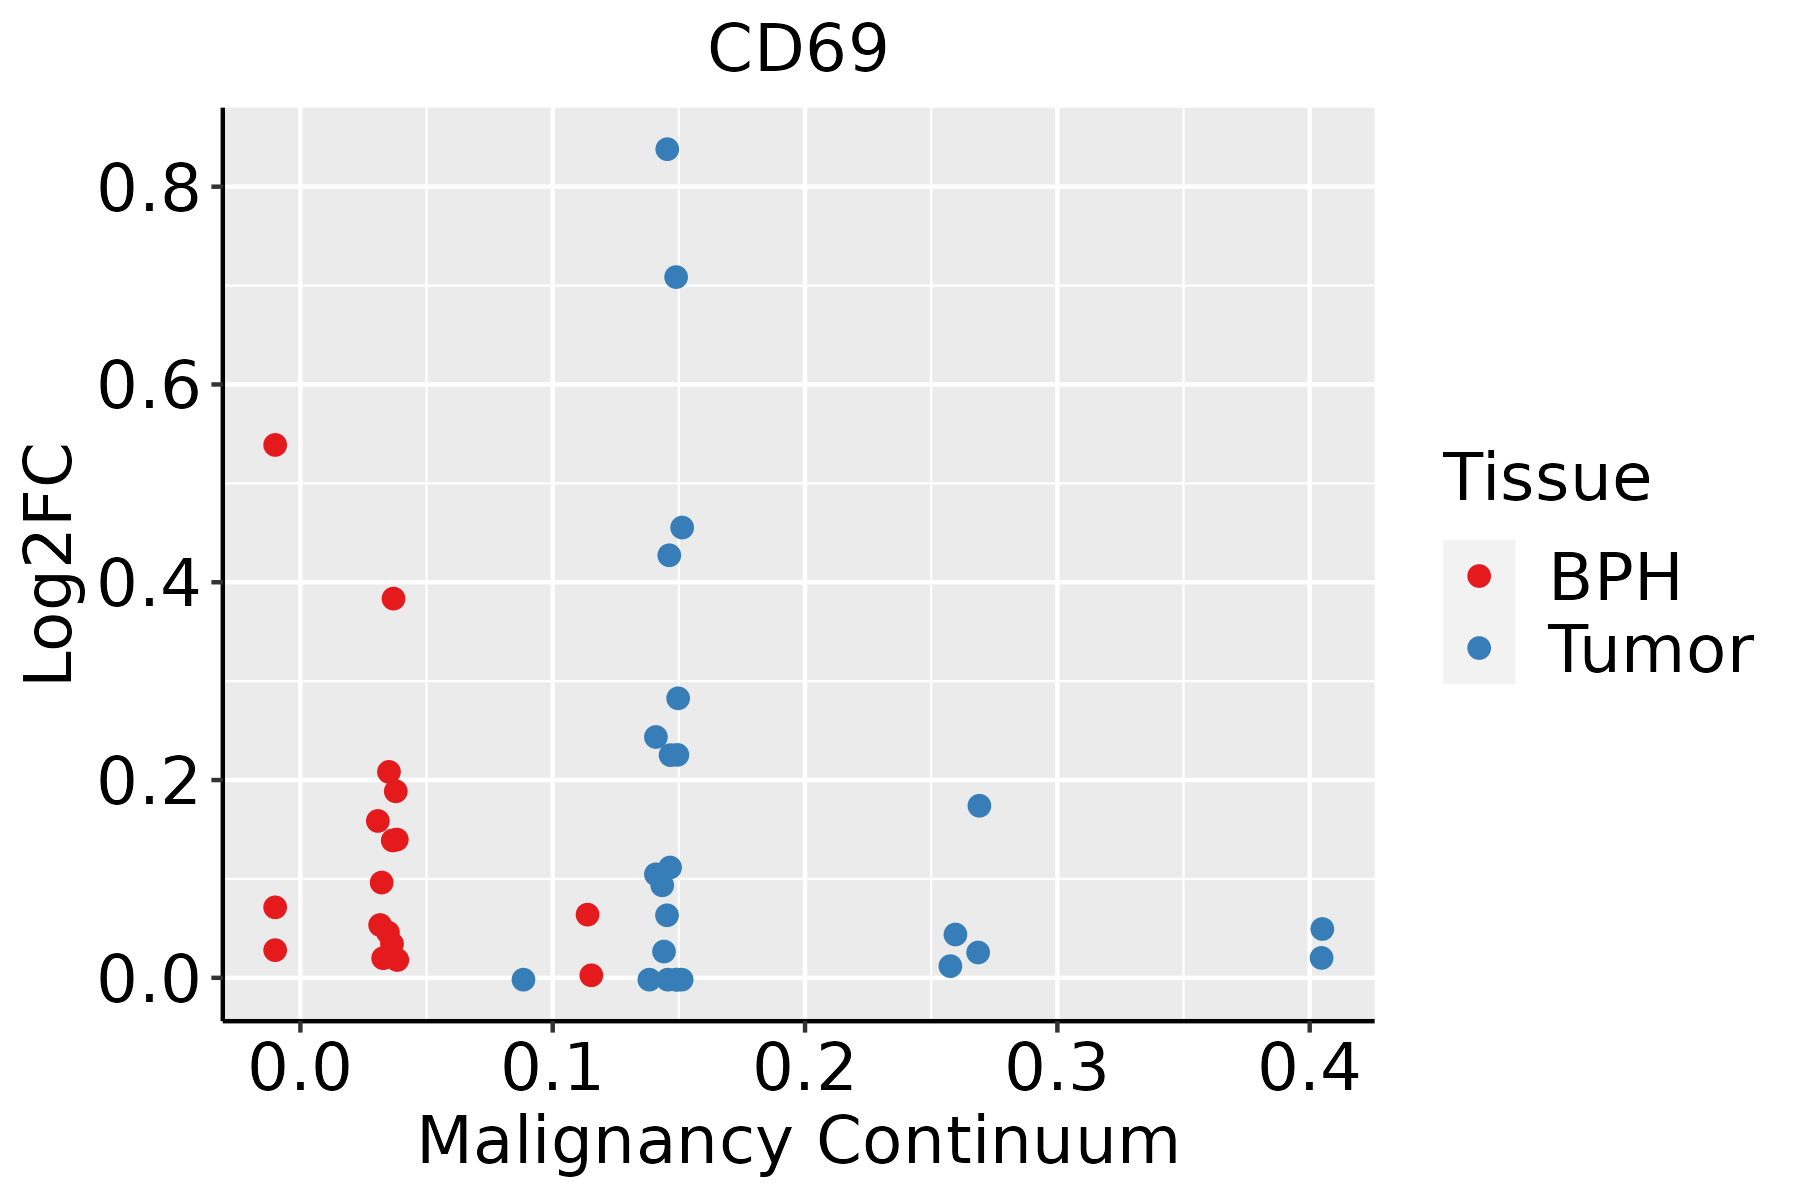 | BPH: Benign Prostatic Hyperplasia |
| ∗log2FC in expression of this searched gene in stem-like cells from each diseased tissue sample relative to stem-like cells in normal samples in each tissue plotted against the malignancy continuum. Samples are colored based on if they are from different disease stage. |
Top |
Malignant transformation related pathway analysis |
| Find out the enriched GO biological processes and KEGG pathways involved in transition from healthy to precancer to cancer |
| Tissue | Disease Stage | Enriched GO biological Processes |
| Colorectum | AD |  |
| Colorectum | SER |  |
| Colorectum | MSS |  |
| Colorectum | MSI-H |  |
| Colorectum | FAP |  |
| ∗Top 15 enriched GO BP terms are showed in the bar plot of each disease state in each tissue. Each row represents a significant GO biological process which is colored according to the -log10(p.adjust). |
| Page: 1 2 3 4 5 6 7 8 9 |
| GO ID | Tissue | Disease Stage | Description | Gene Ratio | Bg Ratio | pvalue | p.adjust | Count |
| Page: 1 |
| Pathway ID | Tissue | Disease Stage | Description | Gene Ratio | Bg Ratio | pvalue | p.adjust | qvalue | Count |
| Page: 1 |
Top |
Cell-cell communication analysis |
| Identification of potential cell-cell interactions between two cell types and their ligand-receptor pairs for different disease states |
| Ligand | Receptor | LRpair | Pathway | Tissue | Disease Stage |
| CD69 | KLRB1 | CLEC2C_KLRB1 | CLEC | Breast | ADJ |
| CD69 | KLRB1 | CLEC2C_KLRB1 | CLEC | Breast | DCIS |
| CD69 | KLRB1 | CLEC2C_KLRB1 | CLEC | Breast | Healthy |
| CD69 | KLRB1 | CLEC2C_KLRB1 | CLEC | Breast | IDC |
| CD69 | KLRB1 | CLEC2C_KLRB1 | CLEC | Breast | Precancer |
| CD69 | KLRB1 | CLEC2C_KLRB1 | CLEC | Cervix | ADJ |
| CD69 | KLRB1 | CLEC2C_KLRB1 | CLEC | Cervix | CC |
| CD69 | KLRB1 | CLEC2C_KLRB1 | CLEC | Cervix | Healthy |
| CD69 | KLRB1 | CLEC2C_KLRB1 | CLEC | Cervix | Precancer |
| CD69 | KLRB1 | CLEC2C_KLRB1 | CLEC | CRC | MSI-H |
| CD69 | KLRB1 | CLEC2C_KLRB1 | CLEC | Endometrium | ADJ |
| CD69 | KLRB1 | CLEC2C_KLRB1 | CLEC | Endometrium | AEH |
| CD69 | KLRB1 | CLEC2C_KLRB1 | CLEC | Endometrium | EEC |
| CD69 | KLRB1 | CLEC2C_KLRB1 | CLEC | Endometrium | Healthy |
| CD69 | KLRB1 | CLEC2C_KLRB1 | CLEC | Esophagus | ADJ |
| CD69 | KLRB1 | CLEC2C_KLRB1 | CLEC | GC | ADJ |
| CD69 | KLRB1 | CLEC2C_KLRB1 | CLEC | GC | GC |
| CD69 | KLRB1 | CLEC2C_KLRB1 | CLEC | GC | Healthy |
| CD69 | KLRB1 | CLEC2C_KLRB1 | CLEC | GC | Precancer |
| CD69 | KLRB1 | CLEC2C_KLRB1 | CLEC | HNSCC | ADJ |
| Page: 1 2 3 |
Top |
Single-cell gene regulatory network inference analysis |
| Find out the significant the regulons (TFs) and the target genes of each regulon across cell types for different disease states |
| TF | Cell Type | Tissue | Disease Stage | Target Gene | RSS | Regulon Activity |
| ∗The dot plots of a searched regulon are shown for all cell subpopulations in each disease state of each tissue based on the regulon specific score inferred using pySCENIC and by calculating the average expression. |
| Page: 1 |
Top |
Somatic mutation of malignant transformation related genes |
| Annotation of somatic variants for genes involved in malignant transformation |
| Hugo Symbol | Variant Class | Variant Classification | dbSNP RS | HGVSc | HGVSp | HGVSp Short | SWISSPROT | BIOTYPE | SIFT | PolyPhen | Tumor Sample Barcode | Tissue | Histology | Sex | Age | Stage | Therapy Types | Drugs | Outcome |
| CD69 | SNV | Missense_Mutation | c.248N>G | p.Ser83Cys | p.S83C | Q07108 | protein_coding | deleterious(0.02) | probably_damaging(0.97) | TCGA-A8-A092-01 | Breast | breast invasive carcinoma | Female | <65 | III/IV | Chemotherapy | paclitaxel | CR | |
| CD69 | SNV | Missense_Mutation | c.130N>C | p.Ala44Pro | p.A44P | Q07108 | protein_coding | deleterious(0.01) | probably_damaging(0.996) | TCGA-AA-3968-01 | Colorectum | colon adenocarcinoma | Female | <65 | I/II | Unknown | Unknown | SD | |
| CD69 | SNV | Missense_Mutation | novel | c.394N>A | p.Leu132Ile | p.L132I | Q07108 | protein_coding | deleterious(0.05) | probably_damaging(0.998) | TCGA-AA-3977-01 | Colorectum | colon adenocarcinoma | Male | >=65 | I/II | Unknown | Unknown | SD |
| CD69 | SNV | Missense_Mutation | novel | c.404N>G | p.Tyr135Cys | p.Y135C | Q07108 | protein_coding | deleterious(0.02) | probably_damaging(0.993) | TCGA-AZ-4315-01 | Colorectum | colon adenocarcinoma | Male | <65 | I/II | Unknown | Unknown | SD |
| CD69 | SNV | Missense_Mutation | c.97N>A | p.His33Asn | p.H33N | Q07108 | protein_coding | tolerated(0.11) | benign(0.031) | TCGA-AG-3892-01 | Colorectum | rectum adenocarcinoma | Female | <65 | I/II | Unknown | Unknown | SD | |
| CD69 | SNV | Missense_Mutation | c.220N>A | p.Phe74Ile | p.F74I | Q07108 | protein_coding | tolerated(0.39) | benign(0.01) | TCGA-F5-6814-01 | Colorectum | rectum adenocarcinoma | Male | <65 | I/II | Unknown | Unknown | SD | |
| CD69 | insertion | Frame_Shift_Ins | novel | c.533_534insA | p.Asn178LysfsTer10 | p.N178Kfs*10 | Q07108 | protein_coding | TCGA-EI-6507-01 | Colorectum | rectum adenocarcinoma | Male | <65 | I/II | Unknown | Unknown | SD | ||
| CD69 | SNV | Missense_Mutation | novel | c.197A>G | p.Tyr66Cys | p.Y66C | Q07108 | protein_coding | deleterious(0.02) | probably_damaging(0.997) | TCGA-A5-A0G2-01 | Endometrium | uterine corpus endometrioid carcinoma | Female | <65 | III/IV | Unknown | Unknown | SD |
| CD69 | SNV | Missense_Mutation | novel | c.115G>A | p.Val39Ile | p.V39I | Q07108 | protein_coding | tolerated(0.15) | possibly_damaging(0.825) | TCGA-A5-A0VP-01 | Endometrium | uterine corpus endometrioid carcinoma | Female | >=65 | I/II | Unknown | Unknown | SD |
| CD69 | SNV | Missense_Mutation | novel | c.561G>T | p.Glu187Asp | p.E187D | Q07108 | protein_coding | tolerated(0.49) | benign(0.001) | TCGA-A5-A1OF-01 | Endometrium | uterine corpus endometrioid carcinoma | Female | <65 | I/II | Unknown | Unknown | SD |
| Page: 1 2 3 |
Top |
Related drugs of malignant transformation related genes |
| Identification of chemicals and drugs interact with genes involved in malignant transfromation |
| (DGIdb 4.0) |
| Entrez ID | Symbol | Category | Interaction Types | Drug Claim Name | Drug Name | PMIDs |
| 969 | CD69 | EXTERNAL SIDE OF PLASMA MEMBRANE, DRUGGABLE GENOME | ANTITUMOR ANTIBIOTICS | 11811939 | ||
| 969 | CD69 | EXTERNAL SIDE OF PLASMA MEMBRANE, DRUGGABLE GENOME | tocilizumab | TOCILIZUMAB | 27339827 |
| Page: 1 |

Copyright 2023-Present -The University of Texas Health Science Center at Houston |