
|
|||||
|
 | |
| |
| |
| |
| |
| |
|
Gene: CD68 |
Gene summary for CD68 |
| Gene information | Species | Human | Gene symbol | CD68 | Gene ID | 968 |
| Gene name | CD68 molecule | |
| Gene Alias | GP110 | |
| Cytomap | 17p13.1 | |
| Gene Type | protein-coding | GO ID | GO:0002237 | UniProtAcc | P34810 |
Top |
Malignant transformation analysis |
| Identification of the aberrant gene expression in precancerous and cancerous lesions by comparing the gene expression of stem-like cells in diseased tissues with normal stem cells |
| Entrez ID | Symbol | Replicates | Species | Organ | Tissue | Adj P-value | Log2FC | Malignancy |
| 968 | CD68 | LZE4T | Human | Esophagus | ESCC | 8.22e-34 | 1.02e+00 | 0.0811 |
| 968 | CD68 | LZE7T | Human | Esophagus | ESCC | 3.01e-10 | 4.55e-01 | 0.0667 |
| 968 | CD68 | LZE8T | Human | Esophagus | ESCC | 9.77e-06 | 2.90e-01 | 0.067 |
| 968 | CD68 | LZE20T | Human | Esophagus | ESCC | 4.10e-17 | 8.84e-01 | 0.0662 |
| 968 | CD68 | LZE21D1 | Human | Esophagus | HGIN | 4.41e-04 | 4.19e-01 | 0.0632 |
| 968 | CD68 | LZE24T | Human | Esophagus | ESCC | 5.74e-23 | 9.08e-01 | 0.0596 |
| 968 | CD68 | LZE21T | Human | Esophagus | ESCC | 1.37e-06 | 4.63e-01 | 0.0655 |
| 968 | CD68 | LZE6T | Human | Esophagus | ESCC | 1.68e-22 | 9.75e-01 | 0.0845 |
| 968 | CD68 | P1T-E | Human | Esophagus | ESCC | 2.65e-12 | 1.23e+00 | 0.0875 |
| 968 | CD68 | P4T-E | Human | Esophagus | ESCC | 7.21e-12 | 5.17e-01 | 0.1323 |
| 968 | CD68 | P5T-E | Human | Esophagus | ESCC | 3.22e-10 | 3.05e-01 | 0.1327 |
| 968 | CD68 | P8T-E | Human | Esophagus | ESCC | 2.03e-07 | 1.90e-01 | 0.0889 |
| 968 | CD68 | P9T-E | Human | Esophagus | ESCC | 6.37e-40 | 9.40e-01 | 0.1131 |
| 968 | CD68 | P10T-E | Human | Esophagus | ESCC | 2.64e-02 | 6.11e-02 | 0.116 |
| 968 | CD68 | P11T-E | Human | Esophagus | ESCC | 4.42e-38 | 2.41e+00 | 0.1426 |
| 968 | CD68 | P15T-E | Human | Esophagus | ESCC | 4.72e-09 | 2.51e-01 | 0.1149 |
| 968 | CD68 | P17T-E | Human | Esophagus | ESCC | 8.18e-22 | 8.98e-01 | 0.1278 |
| 968 | CD68 | P19T-E | Human | Esophagus | ESCC | 4.64e-06 | 8.50e-01 | 0.1662 |
| 968 | CD68 | P20T-E | Human | Esophagus | ESCC | 1.39e-16 | 4.72e-01 | 0.1124 |
| 968 | CD68 | P21T-E | Human | Esophagus | ESCC | 8.87e-30 | 8.14e-01 | 0.1617 |
| Page: 1 2 3 4 5 6 |
| Tissue | Expression Dynamics | Abbreviation |
| Esophagus | 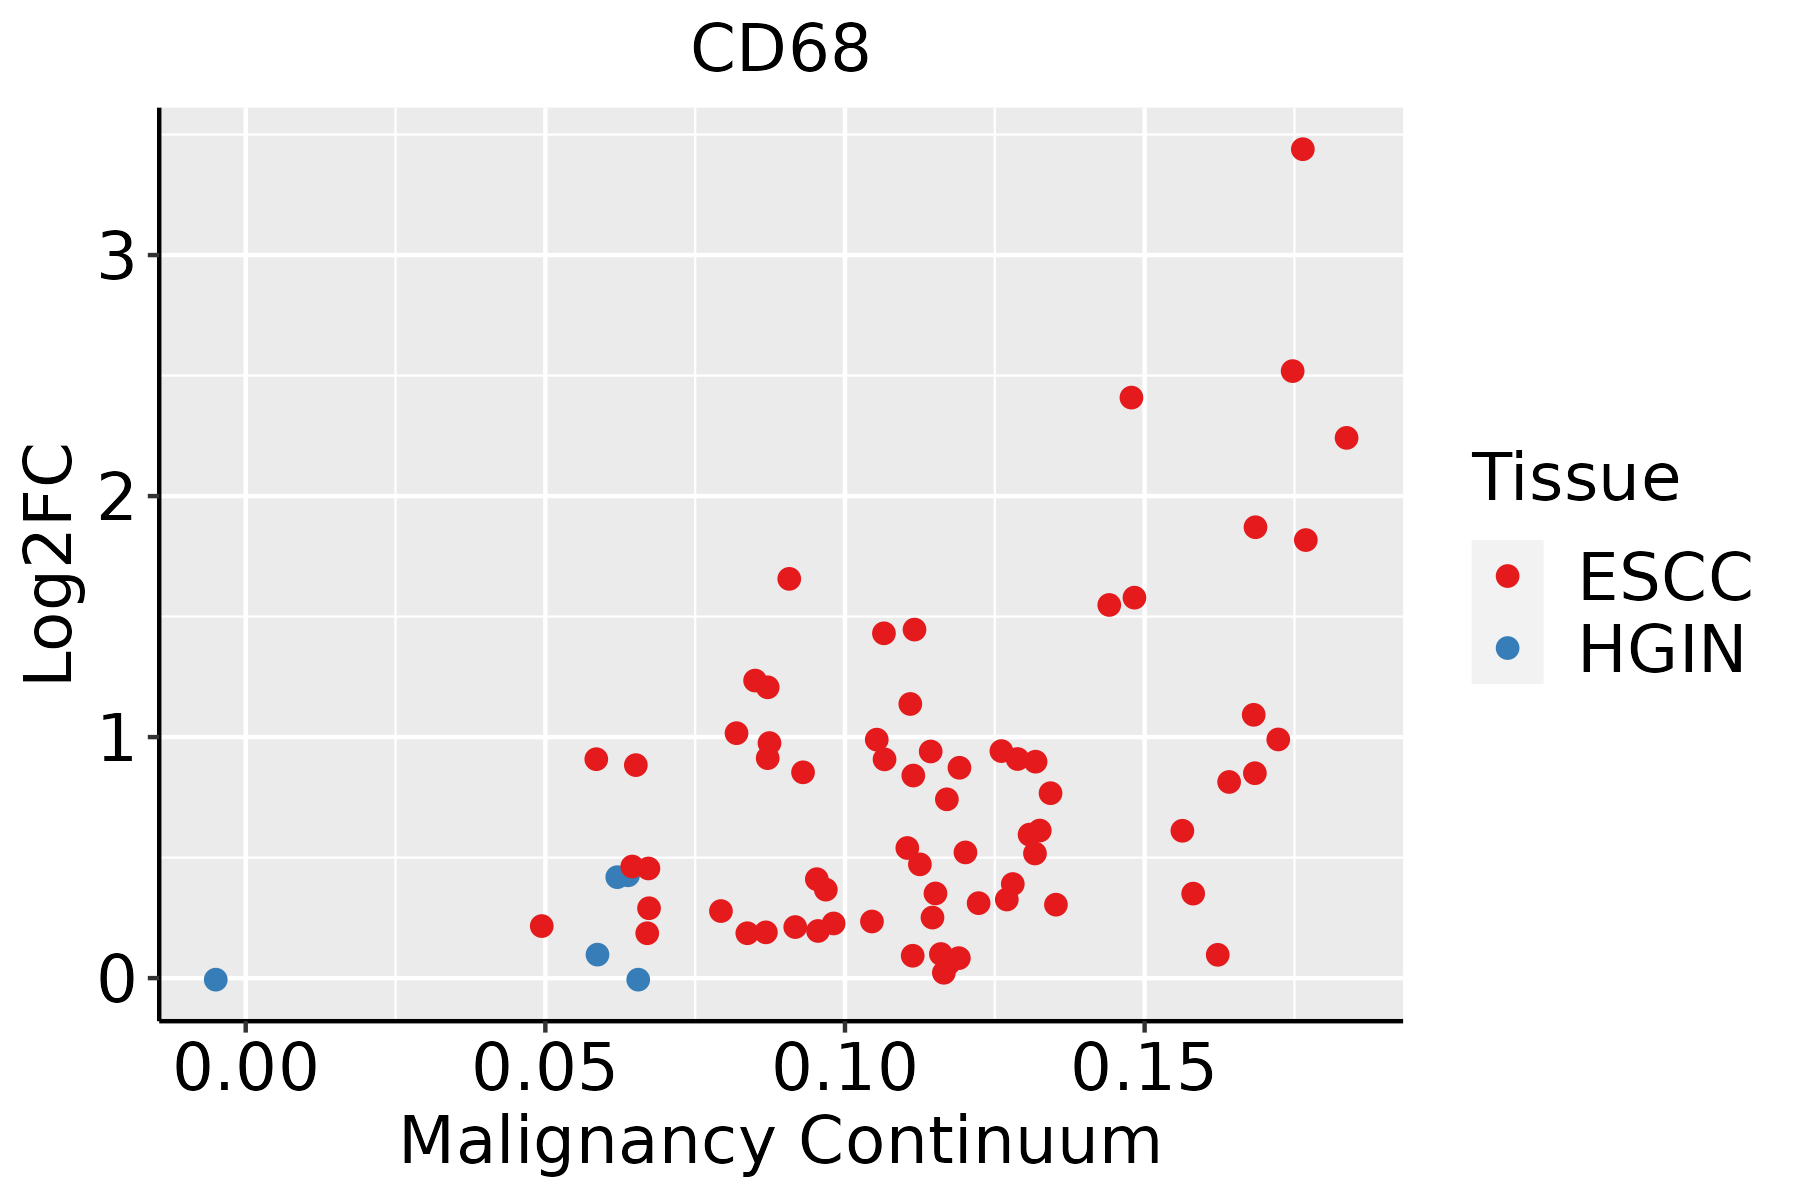 | ESCC: Esophageal squamous cell carcinoma |
| HGIN: High-grade intraepithelial neoplasias | ||
| LGIN: Low-grade intraepithelial neoplasias | ||
| GC | 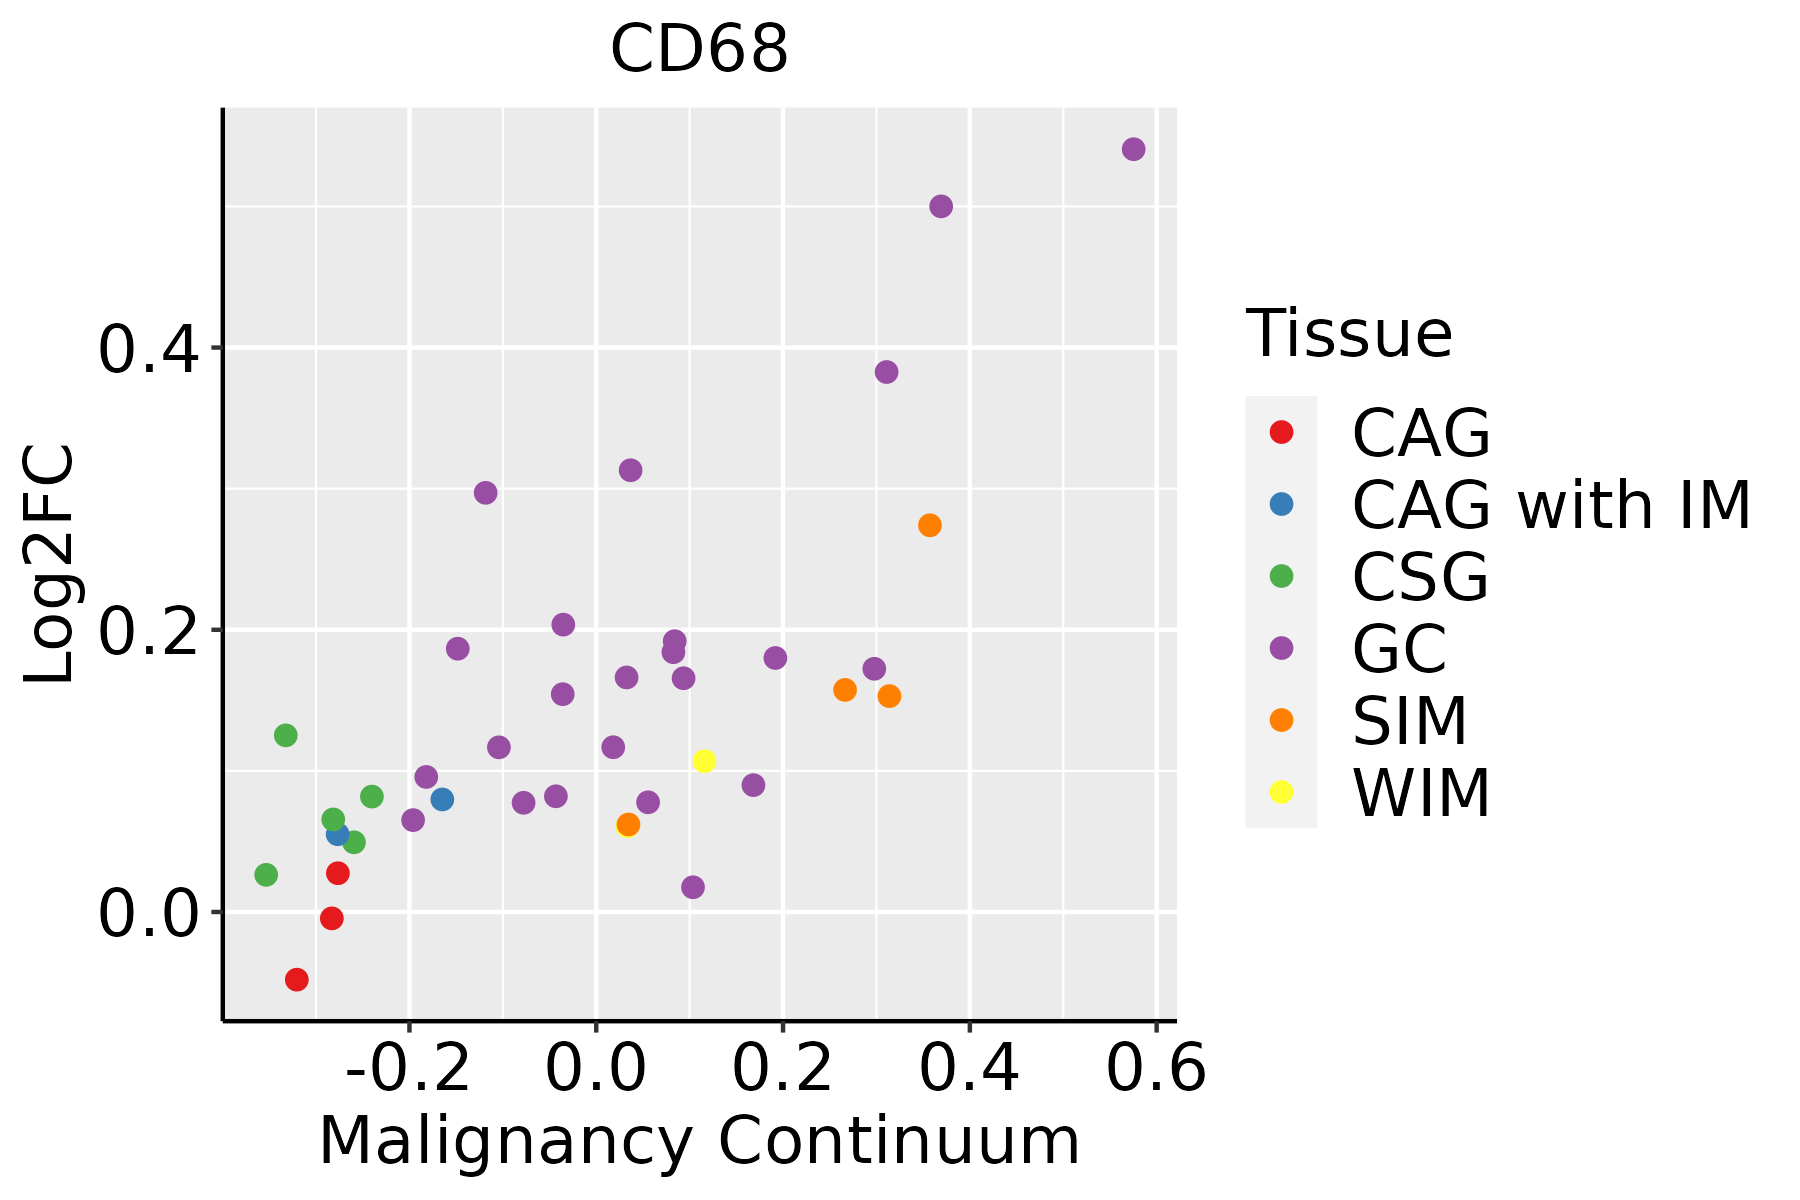 | CAG: Chronic atrophic gastritis |
| CAG with IM: Chronic atrophic gastritis with intestinal metaplasia | ||
| CSG: Chronic superficial gastritis | ||
| GC: Gastric cancer | ||
| SIM: Severe intestinal metaplasia | ||
| WIM: Wild intestinal metaplasia | ||
| Liver |  | HCC: Hepatocellular carcinoma |
| NAFLD: Non-alcoholic fatty liver disease | ||
| Oral Cavity | 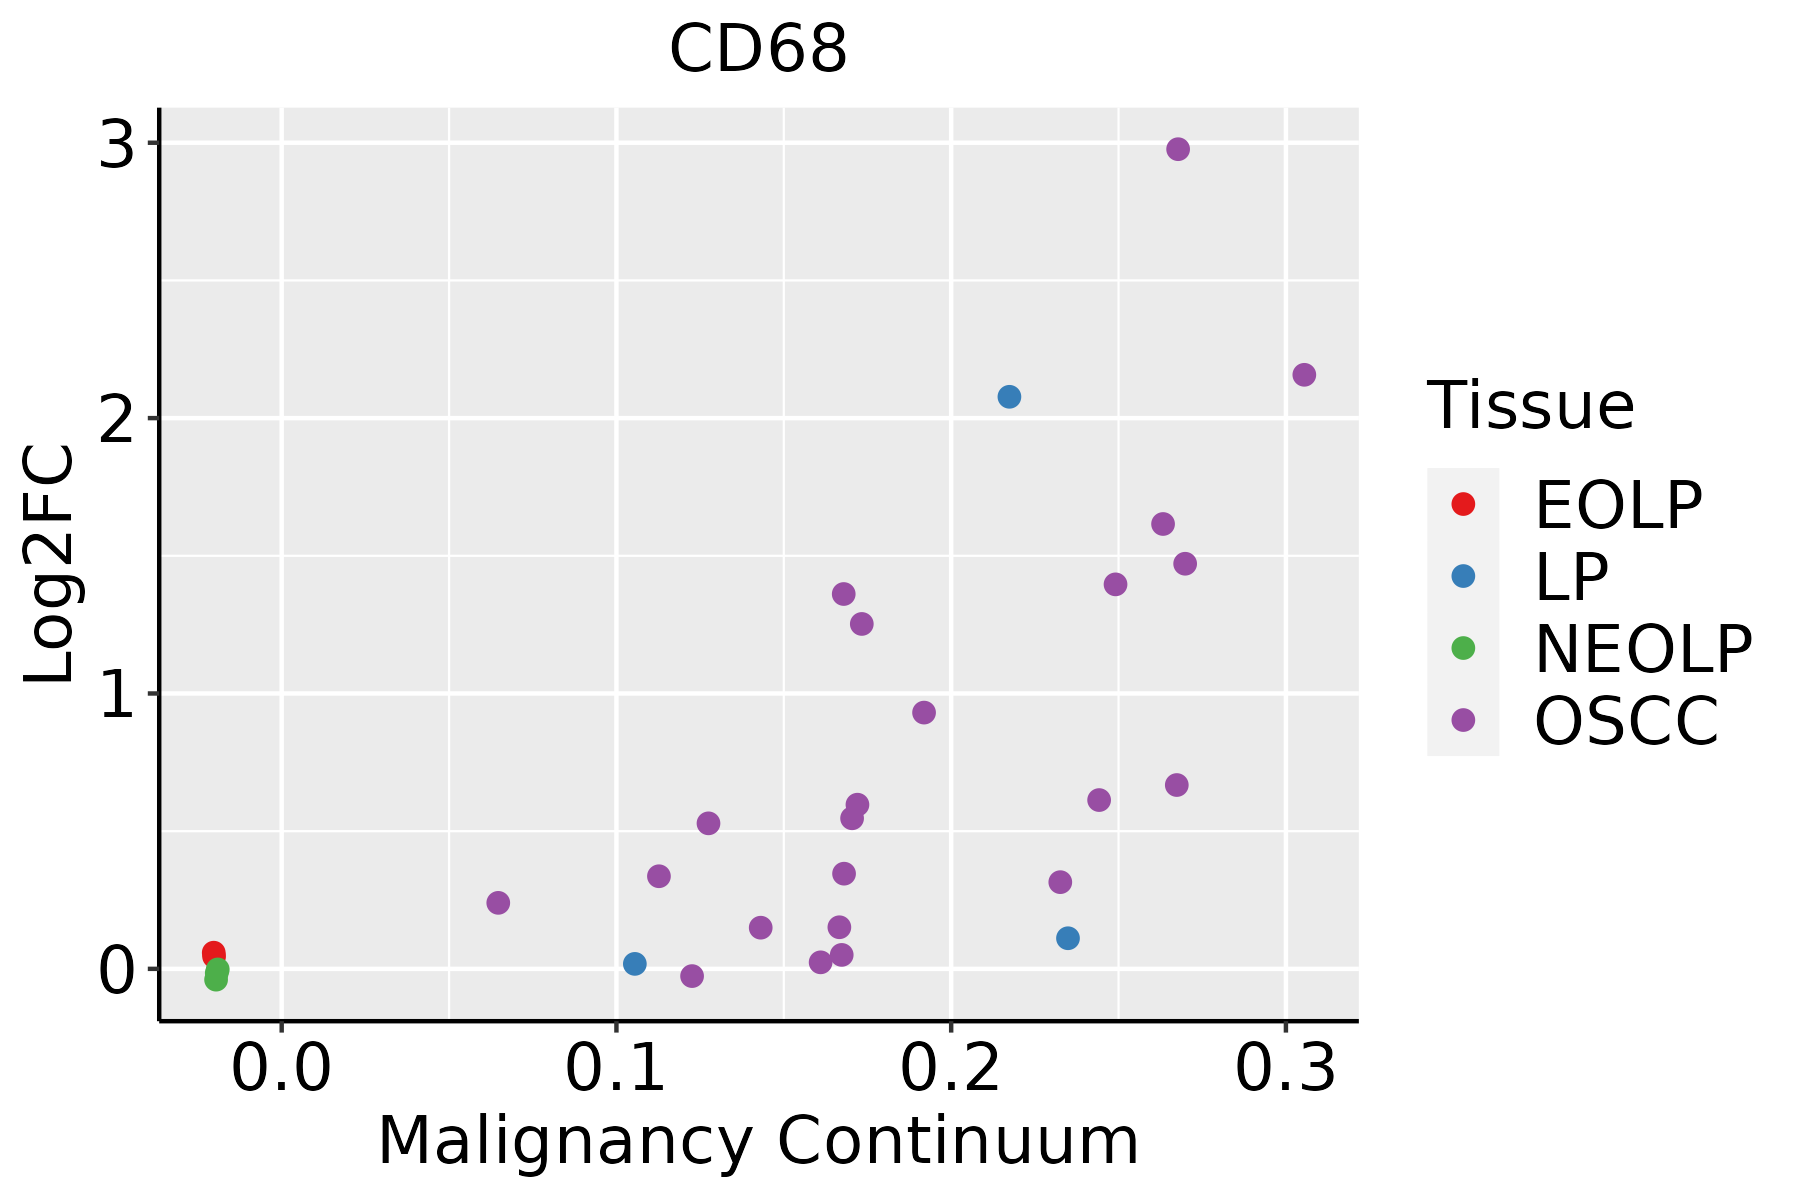 | EOLP: Erosive Oral lichen planus |
| LP: leukoplakia | ||
| NEOLP: Non-erosive oral lichen planus | ||
| OSCC: Oral squamous cell carcinoma | ||
| Thyroid | 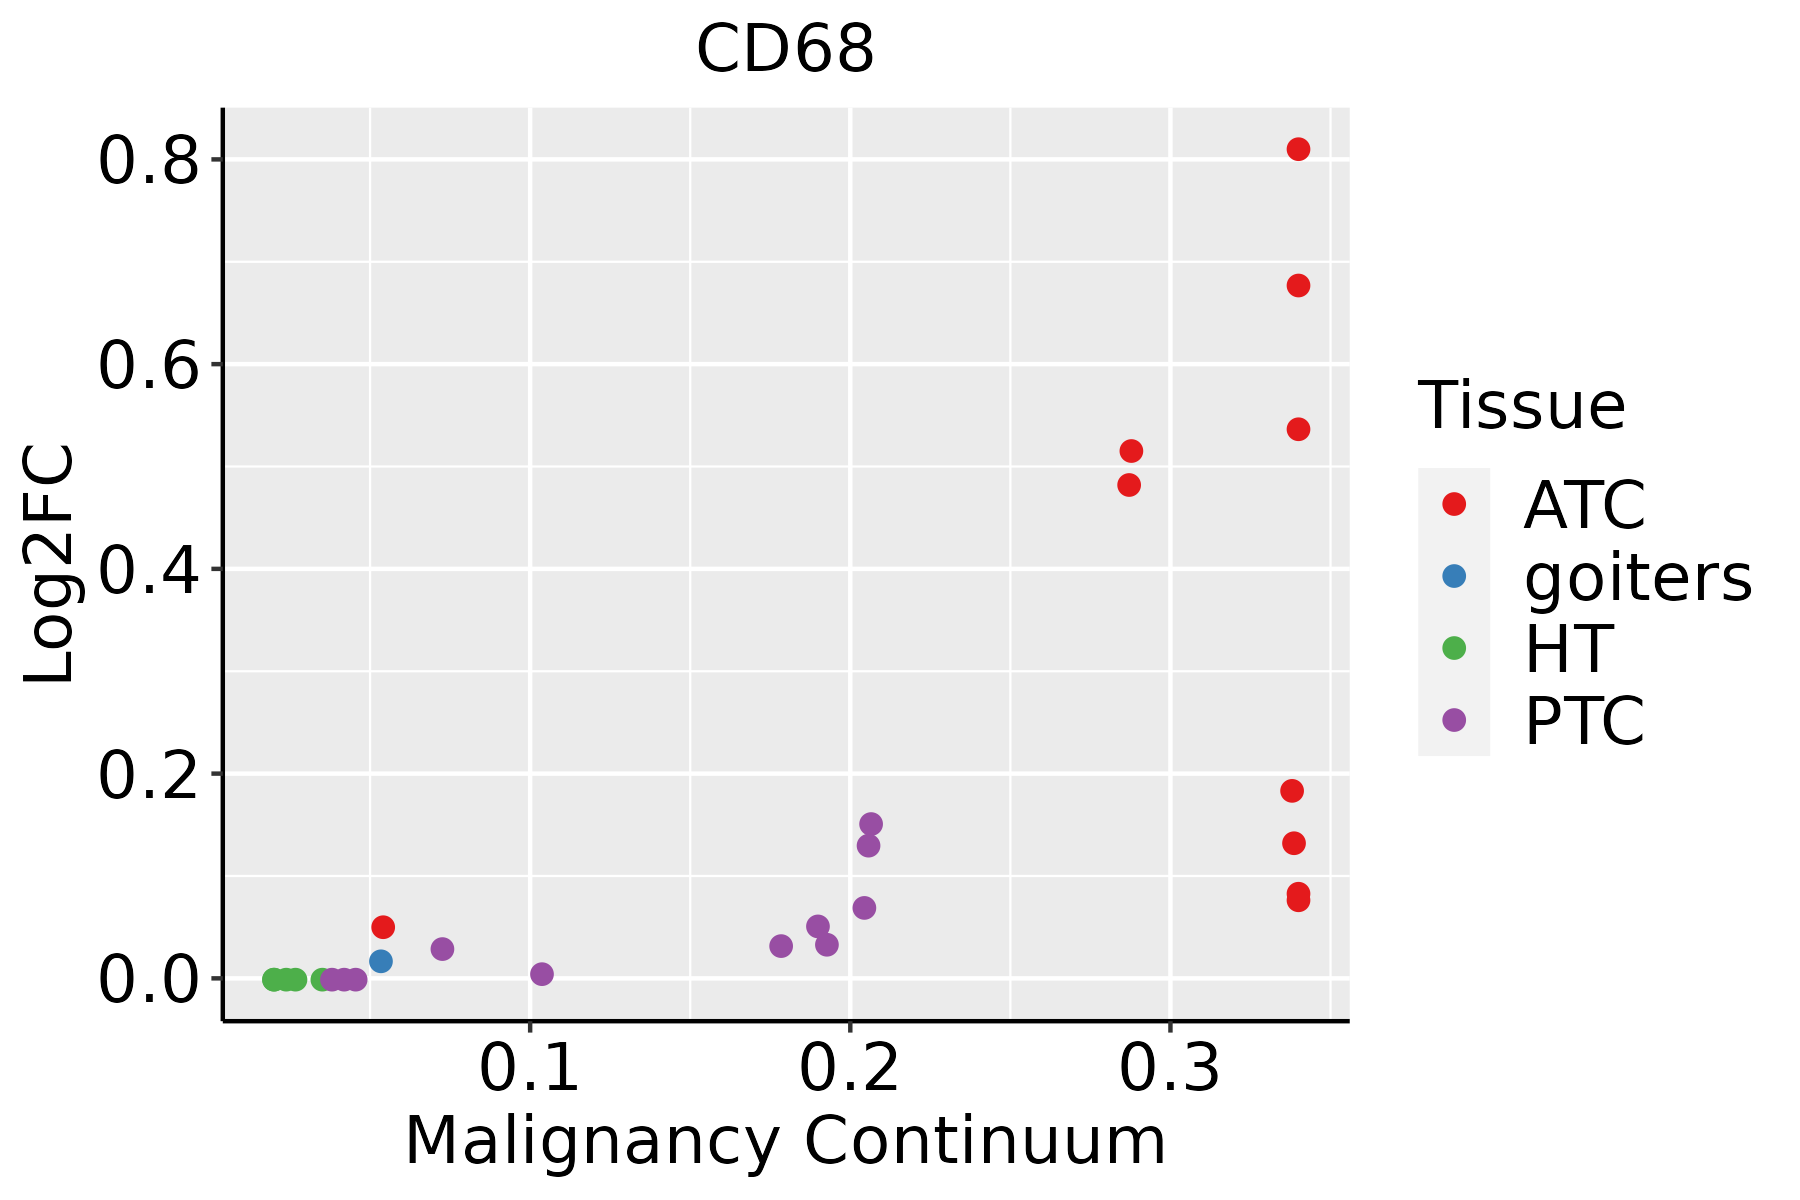 | ATC: Anaplastic thyroid cancer |
| HT: Hashimoto's thyroiditis | ||
| PTC: Papillary thyroid cancer |
| ∗log2FC in expression of this searched gene in stem-like cells from each diseased tissue sample relative to stem-like cells in normal samples in each tissue plotted against the malignancy continuum. Samples are colored based on if they are from different disease stage. |
Top |
Malignant transformation related pathway analysis |
| Find out the enriched GO biological processes and KEGG pathways involved in transition from healthy to precancer to cancer |
| Tissue | Disease Stage | Enriched GO biological Processes |
| Colorectum | AD |  |
| Colorectum | SER |  |
| Colorectum | MSS |  |
| Colorectum | MSI-H |  |
| Colorectum | FAP |  |
| ∗Top 15 enriched GO BP terms are showed in the bar plot of each disease state in each tissue. Each row represents a significant GO biological process which is colored according to the -log10(p.adjust). |
| Page: 1 2 3 4 5 6 7 8 9 |
| GO ID | Tissue | Disease Stage | Description | Gene Ratio | Bg Ratio | pvalue | p.adjust | Count |
| GO:007259420 | Esophagus | HGIN | establishment of protein localization to organelle | 120/2587 | 422/18723 | 1.73e-15 | 4.00e-13 | 120 |
| GO:007149626 | Esophagus | HGIN | cellular response to external stimulus | 71/2587 | 320/18723 | 2.77e-05 | 7.19e-04 | 71 |
| GO:003166820 | Esophagus | HGIN | cellular response to extracellular stimulus | 56/2587 | 246/18723 | 9.05e-05 | 1.97e-03 | 56 |
| GO:003166920 | Esophagus | HGIN | cellular response to nutrient levels | 47/2587 | 215/18723 | 8.20e-04 | 1.07e-02 | 47 |
| GO:003166726 | Esophagus | HGIN | response to nutrient levels | 89/2587 | 474/18723 | 1.41e-03 | 1.64e-02 | 89 |
| GO:0072594110 | Esophagus | ESCC | establishment of protein localization to organelle | 311/8552 | 422/18723 | 3.02e-32 | 2.13e-29 | 311 |
| GO:0071496111 | Esophagus | ESCC | cellular response to external stimulus | 215/8552 | 320/18723 | 4.29e-15 | 2.43e-13 | 215 |
| GO:0031668111 | Esophagus | ESCC | cellular response to extracellular stimulus | 168/8552 | 246/18723 | 4.93e-13 | 2.23e-11 | 168 |
| GO:0031669110 | Esophagus | ESCC | cellular response to nutrient levels | 148/8552 | 215/18723 | 4.58e-12 | 1.76e-10 | 148 |
| GO:0031667111 | Esophagus | ESCC | response to nutrient levels | 289/8552 | 474/18723 | 9.25e-12 | 3.47e-10 | 289 |
| GO:000756820 | Esophagus | ESCC | aging | 201/8552 | 339/18723 | 2.64e-07 | 3.94e-06 | 201 |
| GO:003249619 | Esophagus | ESCC | response to lipopolysaccharide | 191/8552 | 343/18723 | 1.11e-04 | 7.73e-04 | 191 |
| GO:001988225 | Esophagus | ESCC | antigen processing and presentation | 67/8552 | 106/18723 | 2.03e-04 | 1.28e-03 | 67 |
| GO:000268316 | Esophagus | ESCC | negative regulation of immune system process | 231/8552 | 434/18723 | 8.48e-04 | 4.36e-03 | 231 |
| GO:000223719 | Esophagus | ESCC | response to molecule of bacterial origin | 194/8552 | 363/18723 | 1.64e-03 | 7.61e-03 | 194 |
| GO:007122215 | Esophagus | ESCC | cellular response to lipopolysaccharide | 113/8552 | 209/18723 | 8.79e-03 | 3.10e-02 | 113 |
| GO:007121617 | Esophagus | ESCC | cellular response to biotic stimulus | 131/8552 | 246/18723 | 9.85e-03 | 3.39e-02 | 131 |
| GO:007259422 | Liver | HCC | establishment of protein localization to organelle | 299/7958 | 422/18723 | 1.06e-32 | 6.10e-30 | 299 |
| GO:003166722 | Liver | HCC | response to nutrient levels | 276/7958 | 474/18723 | 2.30e-12 | 1.08e-10 | 276 |
| GO:007149622 | Liver | HCC | cellular response to external stimulus | 191/7958 | 320/18723 | 3.40e-10 | 1.13e-08 | 191 |
| Page: 1 2 3 4 5 6 |
| Pathway ID | Tissue | Disease Stage | Description | Gene Ratio | Bg Ratio | pvalue | p.adjust | qvalue | Count |
| hsa041426 | Esophagus | HGIN | Lysosome | 33/1383 | 132/8465 | 6.65e-03 | 4.37e-02 | 3.47e-02 | 33 |
| hsa0414213 | Esophagus | HGIN | Lysosome | 33/1383 | 132/8465 | 6.65e-03 | 4.37e-02 | 3.47e-02 | 33 |
| hsa0414222 | Esophagus | ESCC | Lysosome | 102/4205 | 132/8465 | 5.11e-11 | 7.13e-10 | 3.65e-10 | 102 |
| hsa0414232 | Esophagus | ESCC | Lysosome | 102/4205 | 132/8465 | 5.11e-11 | 7.13e-10 | 3.65e-10 | 102 |
| hsa041422 | Liver | HCC | Lysosome | 100/4020 | 132/8465 | 2.32e-11 | 4.31e-10 | 2.40e-10 | 100 |
| hsa041423 | Liver | HCC | Lysosome | 100/4020 | 132/8465 | 2.32e-11 | 4.31e-10 | 2.40e-10 | 100 |
| hsa041425 | Oral cavity | OSCC | Lysosome | 87/3704 | 132/8465 | 1.97e-07 | 1.35e-06 | 6.86e-07 | 87 |
| hsa0414212 | Oral cavity | OSCC | Lysosome | 87/3704 | 132/8465 | 1.97e-07 | 1.35e-06 | 6.86e-07 | 87 |
| hsa0414221 | Oral cavity | LP | Lysosome | 67/2418 | 132/8465 | 5.13e-08 | 7.77e-07 | 5.01e-07 | 67 |
| hsa0414231 | Oral cavity | LP | Lysosome | 67/2418 | 132/8465 | 5.13e-08 | 7.77e-07 | 5.01e-07 | 67 |
| Page: 1 |
Top |
Cell-cell communication analysis |
| Identification of potential cell-cell interactions between two cell types and their ligand-receptor pairs for different disease states |
| Ligand | Receptor | LRpair | Pathway | Tissue | Disease Stage |
| Page: 1 |
Top |
Single-cell gene regulatory network inference analysis |
| Find out the significant the regulons (TFs) and the target genes of each regulon across cell types for different disease states |
| TF | Cell Type | Tissue | Disease Stage | Target Gene | RSS | Regulon Activity |
| ∗The dot plots of a searched regulon are shown for all cell subpopulations in each disease state of each tissue based on the regulon specific score inferred using pySCENIC and by calculating the average expression. |
| Page: 1 |
Top |
Somatic mutation of malignant transformation related genes |
| Annotation of somatic variants for genes involved in malignant transformation |
| Hugo Symbol | Variant Class | Variant Classification | dbSNP RS | HGVSc | HGVSp | HGVSp Short | SWISSPROT | BIOTYPE | SIFT | PolyPhen | Tumor Sample Barcode | Tissue | Histology | Sex | Age | Stage | Therapy Types | Drugs | Outcome |
| CD68 | SNV | Missense_Mutation | rs771826335 | c.76N>T | p.His26Tyr | p.H26Y | P34810 | protein_coding | deleterious(0) | possibly_damaging(0.723) | TCGA-AC-A23H-01 | Breast | breast invasive carcinoma | Female | >=65 | I/II | Unknown | Unknown | PD |
| CD68 | SNV | Missense_Mutation | c.751N>G | p.His251Asp | p.H251D | P34810 | protein_coding | tolerated(0.13) | benign(0.011) | TCGA-BH-A18N-01 | Breast | breast invasive carcinoma | Female | >=65 | I/II | Unknown | Unknown | SD | |
| CD68 | SNV | Missense_Mutation | novel | c.130N>A | p.Glu44Lys | p.E44K | P34810 | protein_coding | tolerated(0.11) | benign(0.043) | TCGA-PE-A5DE-01 | Breast | breast invasive carcinoma | Female | <65 | I/II | Chemotherapy | taxotere | CR |
| CD68 | deletion | In_Frame_Del | c.86_88delNNN | p.Ala30del | p.A30del | P34810 | protein_coding | TCGA-A8-A06X-01 | Breast | breast invasive carcinoma | Female | >=65 | I/II | Unknown | Unknown | SD | |||
| CD68 | insertion | Frame_Shift_Ins | novel | c.291_292insTTCTC | p.Thr98PhefsTer101 | p.T98Ffs*101 | P34810 | protein_coding | TCGA-AN-A0FX-01 | Breast | breast invasive carcinoma | Female | <65 | I/II | Unknown | Unknown | SD | ||
| CD68 | insertion | In_Frame_Ins | novel | c.292_293insTTCTACATCATGAAAAAGAATTAC | p.Thr98delinsIleLeuHisHisGluLysGluLeuPro | p.T98delinsILHHEKELP | P34810 | protein_coding | TCGA-AN-A0FX-01 | Breast | breast invasive carcinoma | Female | <65 | I/II | Unknown | Unknown | SD | ||
| CD68 | SNV | Missense_Mutation | rs374658534 | c.118N>T | p.Pro40Ser | p.P40S | P34810 | protein_coding | deleterious(0.05) | possibly_damaging(0.69) | TCGA-A5-A0G2-01 | Endometrium | uterine corpus endometrioid carcinoma | Female | <65 | III/IV | Unknown | Unknown | SD |
| CD68 | SNV | Missense_Mutation | rs531445203 | c.224N>T | p.Thr75Met | p.T75M | P34810 | protein_coding | tolerated(0.05) | benign(0.027) | TCGA-AP-A059-01 | Endometrium | uterine corpus endometrioid carcinoma | Female | >=65 | I/II | Unknown | Unknown | SD |
| CD68 | SNV | Missense_Mutation | novel | c.14N>C | p.Val5Ala | p.V5A | P34810 | protein_coding | tolerated_low_confidence(0.05) | benign(0.177) | TCGA-AP-A1DK-01 | Endometrium | uterine corpus endometrioid carcinoma | Female | <65 | I/II | Unknown | Unknown | SD |
| CD68 | SNV | Missense_Mutation | novel | c.475N>T | p.Asp159Tyr | p.D159Y | P34810 | protein_coding | tolerated(0.07) | probably_damaging(0.946) | TCGA-AP-A1DV-01 | Endometrium | uterine corpus endometrioid carcinoma | Female | <65 | I/II | Unknown | Unknown | SD |
| Page: 1 2 3 |
Top |
Related drugs of malignant transformation related genes |
| Identification of chemicals and drugs interact with genes involved in malignant transfromation |
| (DGIdb 4.0) |
| Entrez ID | Symbol | Category | Interaction Types | Drug Claim Name | Drug Name | PMIDs |
| Page: 1 |

Copyright 2023-Present -The University of Texas Health Science Center at Houston |