Schematic overview of the cellular and molecular mechanisms involved in the cancer progression, including the proposed cellular and molecular mechanisms in cancer cells trajectory. AT1: alveolar type 1 cells; AT2: alveolar type 2 cells; AAH: atypical adenomatous hyperplasia; AIS: adenocarcinoma in situ; MIA: minimally invasive adenocarcinoma; IA: invasive adenocarcinoma; EMT: epithelial-mesenchymal transition

Home

Download

Statistics

Help

Contact

Center for Computational Systems Medicine
leaf

Gene summary

leaf

Malignant transformation analysis

leaf

Malignant transformation related pathway analysis

leaf

Cell-cell communication analysis

leaf

Single-cell gene regulatory network inference analysis

leaf

Somatic mutation of malignant transformation related genes

leaf

Related drugs of malignant transformation related genes

Gene: CD59

Gene summary for CD59

check button Gene summary.

Gene informationSpeciesHuman
Gene symbol

CD59

Gene ID

966

Gene nameCD59 molecule (CD59 blood group)
Gene Alias16.3A5
Cytomap11p13
Gene Typeprotein-coding
GO ID

GO:0001905

UniProtAcc

P13987


Top

Malignant transformation analysis

check button Identification of the aberrant gene expression in precancerous and cancerous lesions by comparing the gene expression of stem-like cells in diseased tissues with normal stem cells
check button Malignant transformation involving gene list.
Entrez IDSymbolReplicatesSpeciesOrganTissueAdj P-valueLog2FCMalignancy
966CD59GSM4909282HumanBreastIDC8.31e-18-5.53e-01-0.0288
966CD59GSM4909285HumanBreastIDC6.10e-31-6.20e-010.21
966CD59GSM4909286HumanBreastIDC3.21e-15-2.54e-010.1081
966CD59GSM4909290HumanBreastIDC2.10e-33-9.31e-010.2096
966CD59GSM4909291HumanBreastIDC2.86e-21-7.66e-010.1753
966CD59GSM4909293HumanBreastIDC3.51e-44-9.30e-010.1581
966CD59GSM4909294HumanBreastIDC1.29e-48-9.54e-010.2022
966CD59GSM4909296HumanBreastIDC5.38e-54-1.03e+000.1524
966CD59GSM4909297HumanBreastIDC2.54e-37-7.38e-010.1517
966CD59GSM4909298HumanBreastIDC1.04e-20-4.64e-010.1551
966CD59GSM4909301HumanBreastIDC9.50e-48-9.74e-010.1577
966CD59GSM4909302HumanBreastIDC5.17e-04-3.44e-010.1545
966CD59GSM4909304HumanBreastIDC1.86e-20-4.51e-010.1636
966CD59GSM4909306HumanBreastIDC6.76e-14-3.88e-010.1564
966CD59GSM4909308HumanBreastIDC1.72e-13-1.99e-010.158
966CD59GSM4909311HumanBreastIDC4.00e-56-8.71e-010.1534
966CD59GSM4909312HumanBreastIDC1.19e-33-7.38e-010.1552
966CD59GSM4909313HumanBreastIDC2.56e-03-1.98e-010.0391
966CD59GSM4909315HumanBreastIDC8.11e-36-8.50e-010.21
966CD59GSM4909316HumanBreastIDC9.94e-12-8.21e-010.21
Page: 1 2 3 4 5 6 7 8 9 10 11 12 13 14 15 16 17 

check button Transcriptomic changes along malignancy continuum.
TissueExpression DynamicsAbbreviation
BreastThe image shows the transcriptomic changes along malignancy continuum.log2FC in expression of this searched gene in stem-like cells from each diseased tissue sample relative to stem-like cells in normal samples in each tissue plotted against the malignancy continuum. Samples are colored based on if they are from different disease stage.
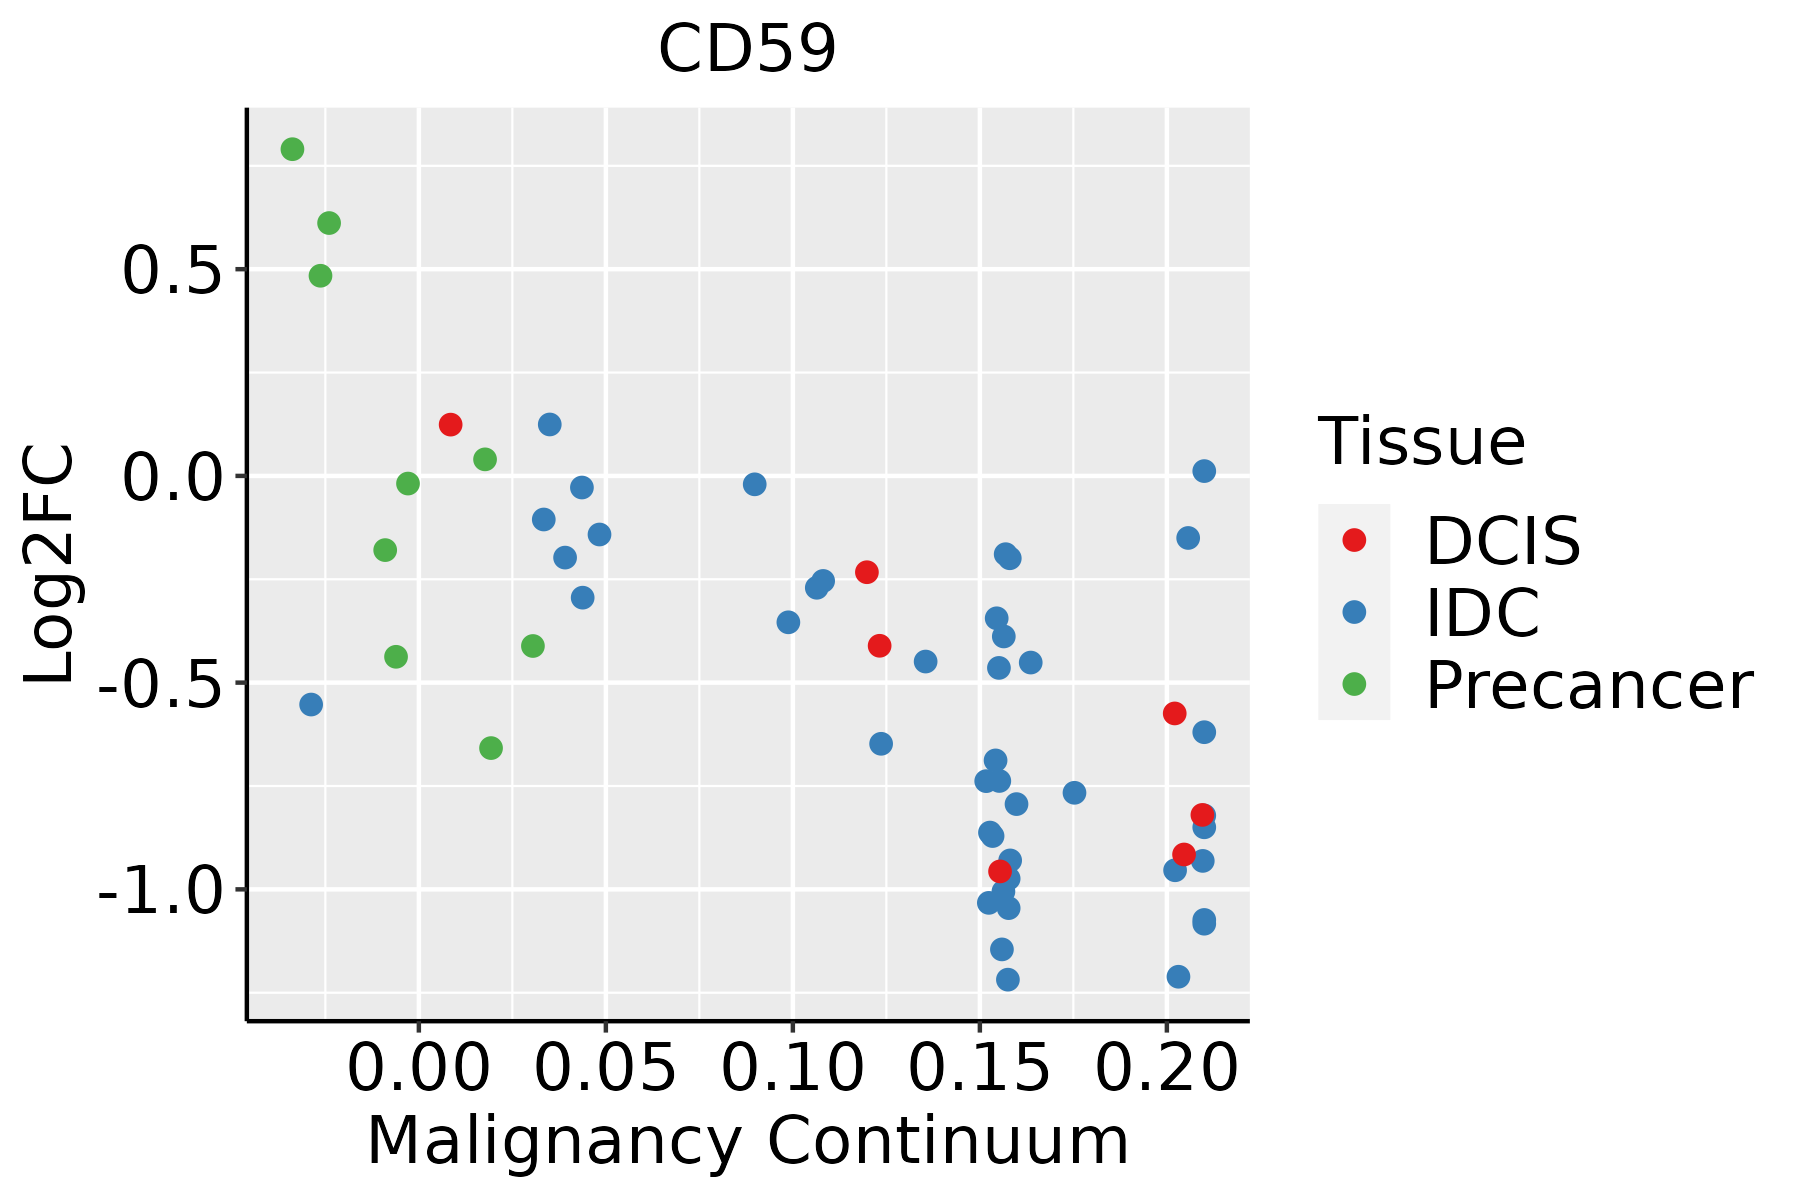
IDC: Invasive ductal carcinoma
DCIS: Ductal carcinoma in situ
Precancer(BRCA1-mut): Precancerous lesion from BRCA1 mutation carriers
CervixThe image shows the transcriptomic changes along malignancy continuum.log2FC in expression of this searched gene in stem-like cells from each diseased tissue sample relative to stem-like cells in normal samples in each tissue plotted against the malignancy continuum. Samples are colored based on if they are from different disease stage.CC: Cervix cancer
HSIL_HPV: HPV-infected high-grade squamous intraepithelial lesions
N_HPV: HPV-infected normal cervix
Colorectum (GSE201348)The image shows the transcriptomic changes along malignancy continuum.log2FC in expression of this searched gene in stem-like cells from each diseased tissue sample relative to stem-like cells in normal samples in each tissue plotted against the malignancy continuum. Samples are colored based on if they are from different disease stage.FAP: Familial adenomatous polyposis
CRC: Colorectal cancer
Colorectum (HTA11)The image shows the transcriptomic changes along malignancy continuum.log2FC in expression of this searched gene in stem-like cells from each diseased tissue sample relative to stem-like cells in normal samples in each tissue plotted against the malignancy continuum. Samples are colored based on if they are from different disease stage.AD: Adenomas
SER: Sessile serrated lesions
MSI-H: Microsatellite-high colorectal cancer
MSS: Microsatellite stable colorectal cancer
EndometriumThe image shows the transcriptomic changes along malignancy continuum.log2FC in expression of this searched gene in stem-like cells from each diseased tissue sample relative to stem-like cells in normal samples in each tissue plotted against the malignancy continuum. Samples are colored based on if they are from different disease stage.
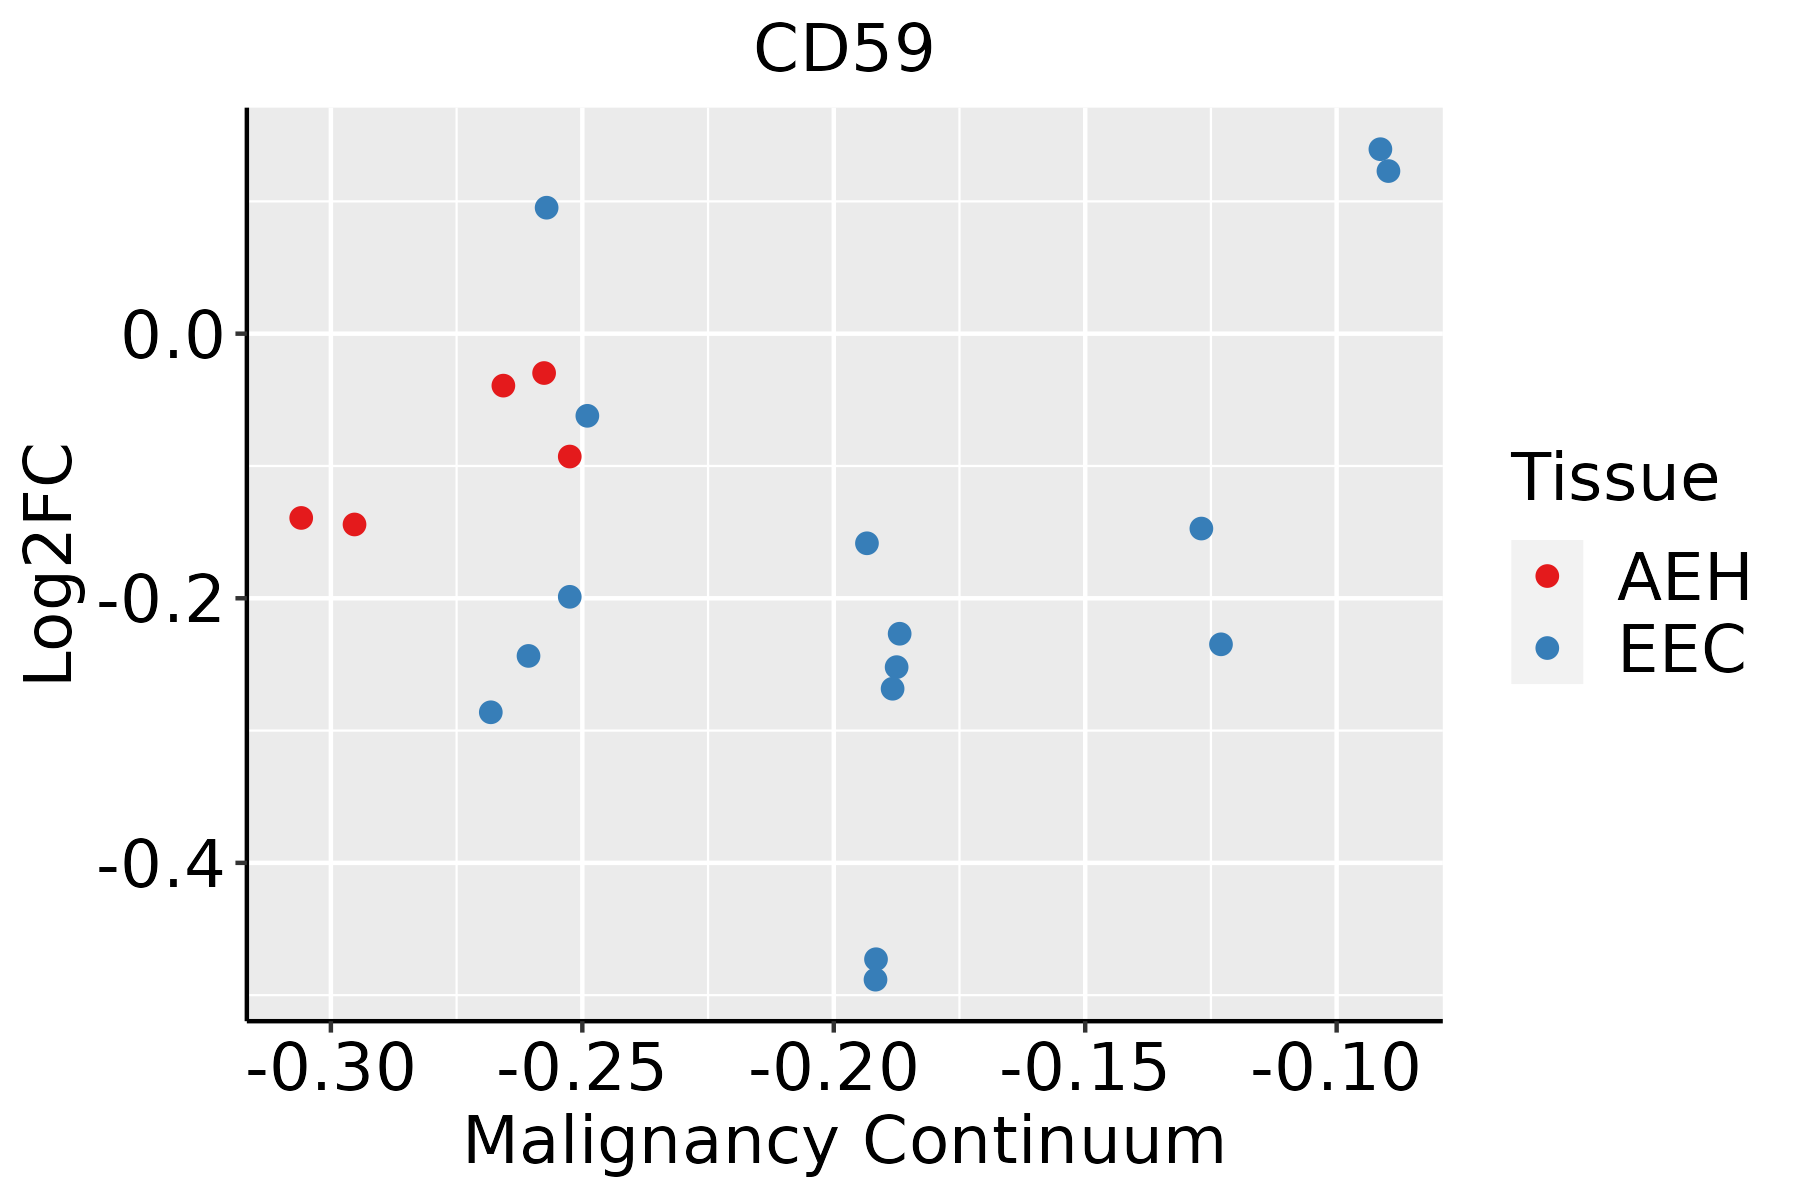
AEH: Atypical endometrial hyperplasia
EEC: Endometrioid Cancer
EsophagusThe image shows the transcriptomic changes along malignancy continuum.log2FC in expression of this searched gene in stem-like cells from each diseased tissue sample relative to stem-like cells in normal samples in each tissue plotted against the malignancy continuum. Samples are colored based on if they are from different disease stage.
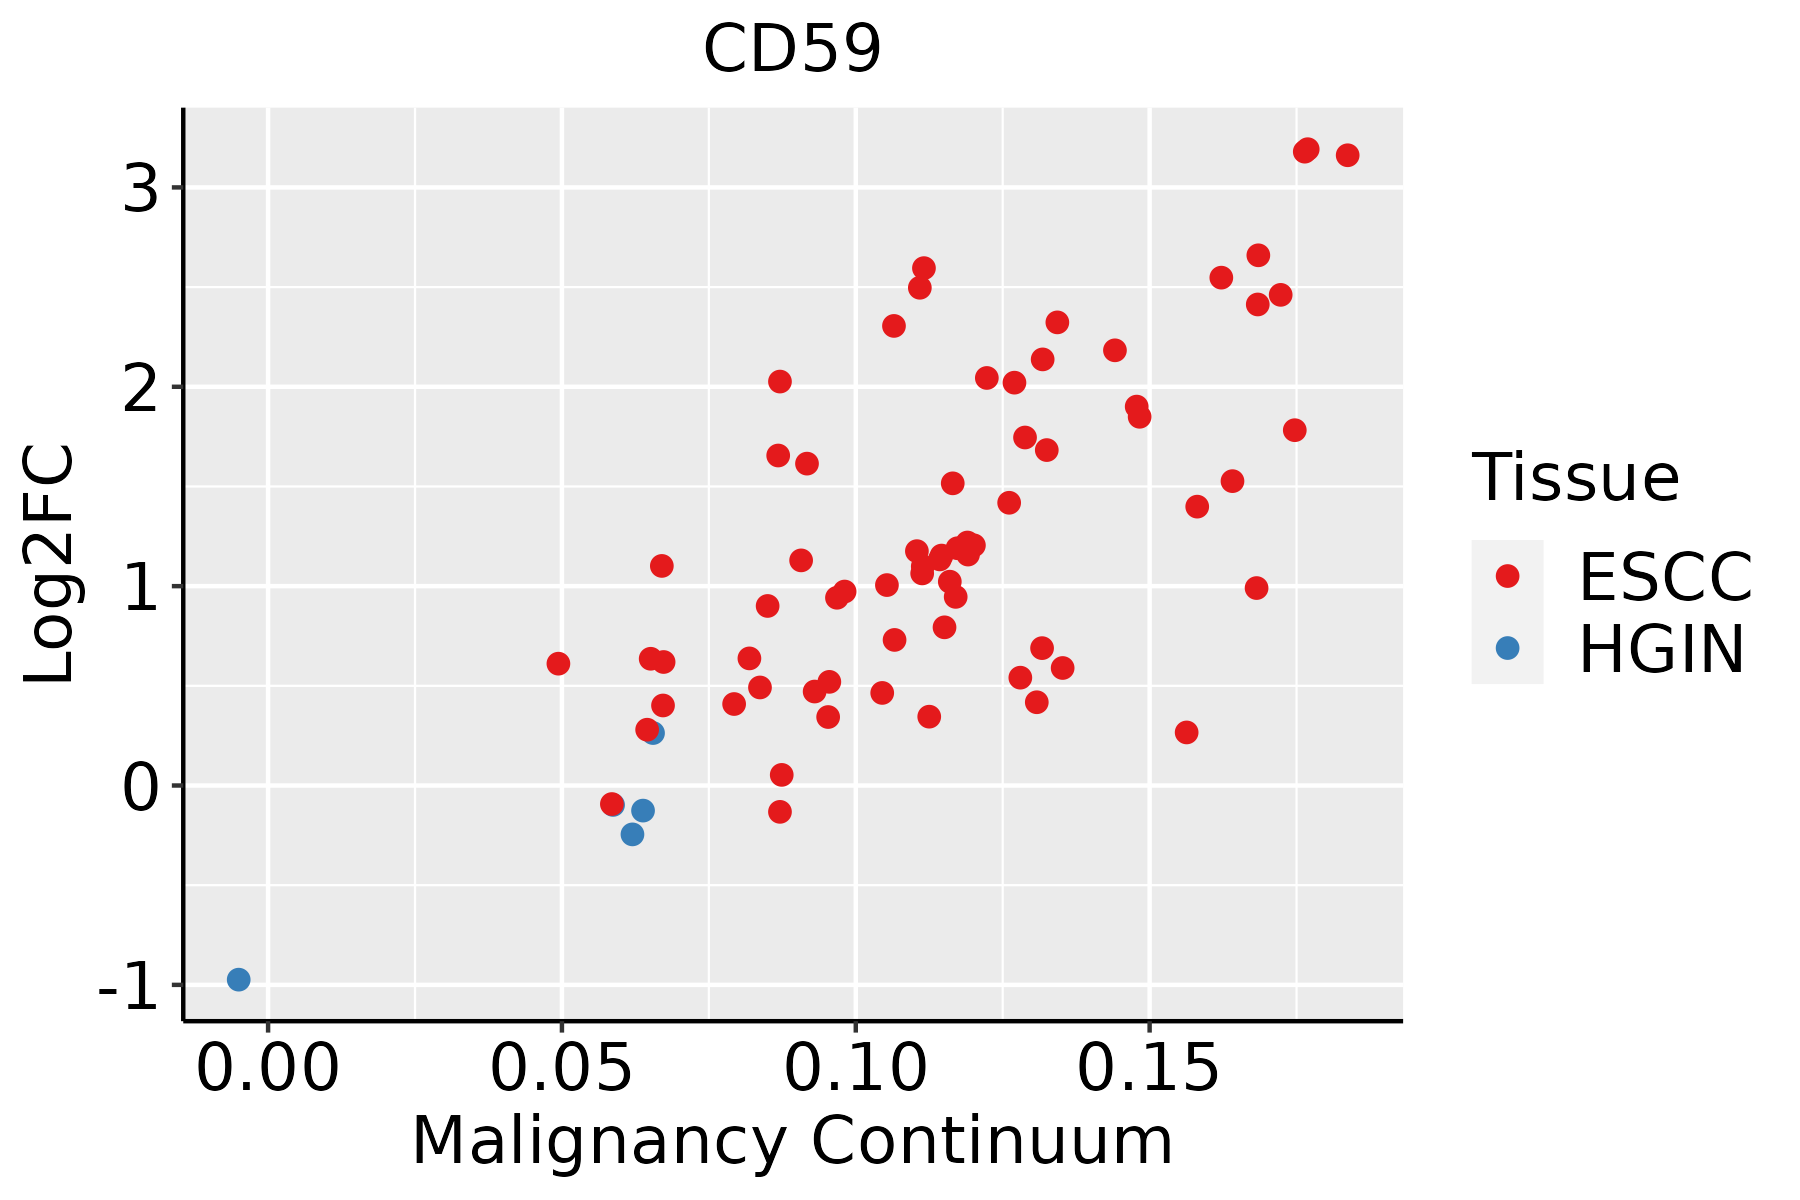
ESCC: Esophageal squamous cell carcinoma
HGIN: High-grade intraepithelial neoplasias
LGIN: Low-grade intraepithelial neoplasias
GCThe image shows the transcriptomic changes along malignancy continuum.log2FC in expression of this searched gene in stem-like cells from each diseased tissue sample relative to stem-like cells in normal samples in each tissue plotted against the malignancy continuum. Samples are colored based on if they are from different disease stage.
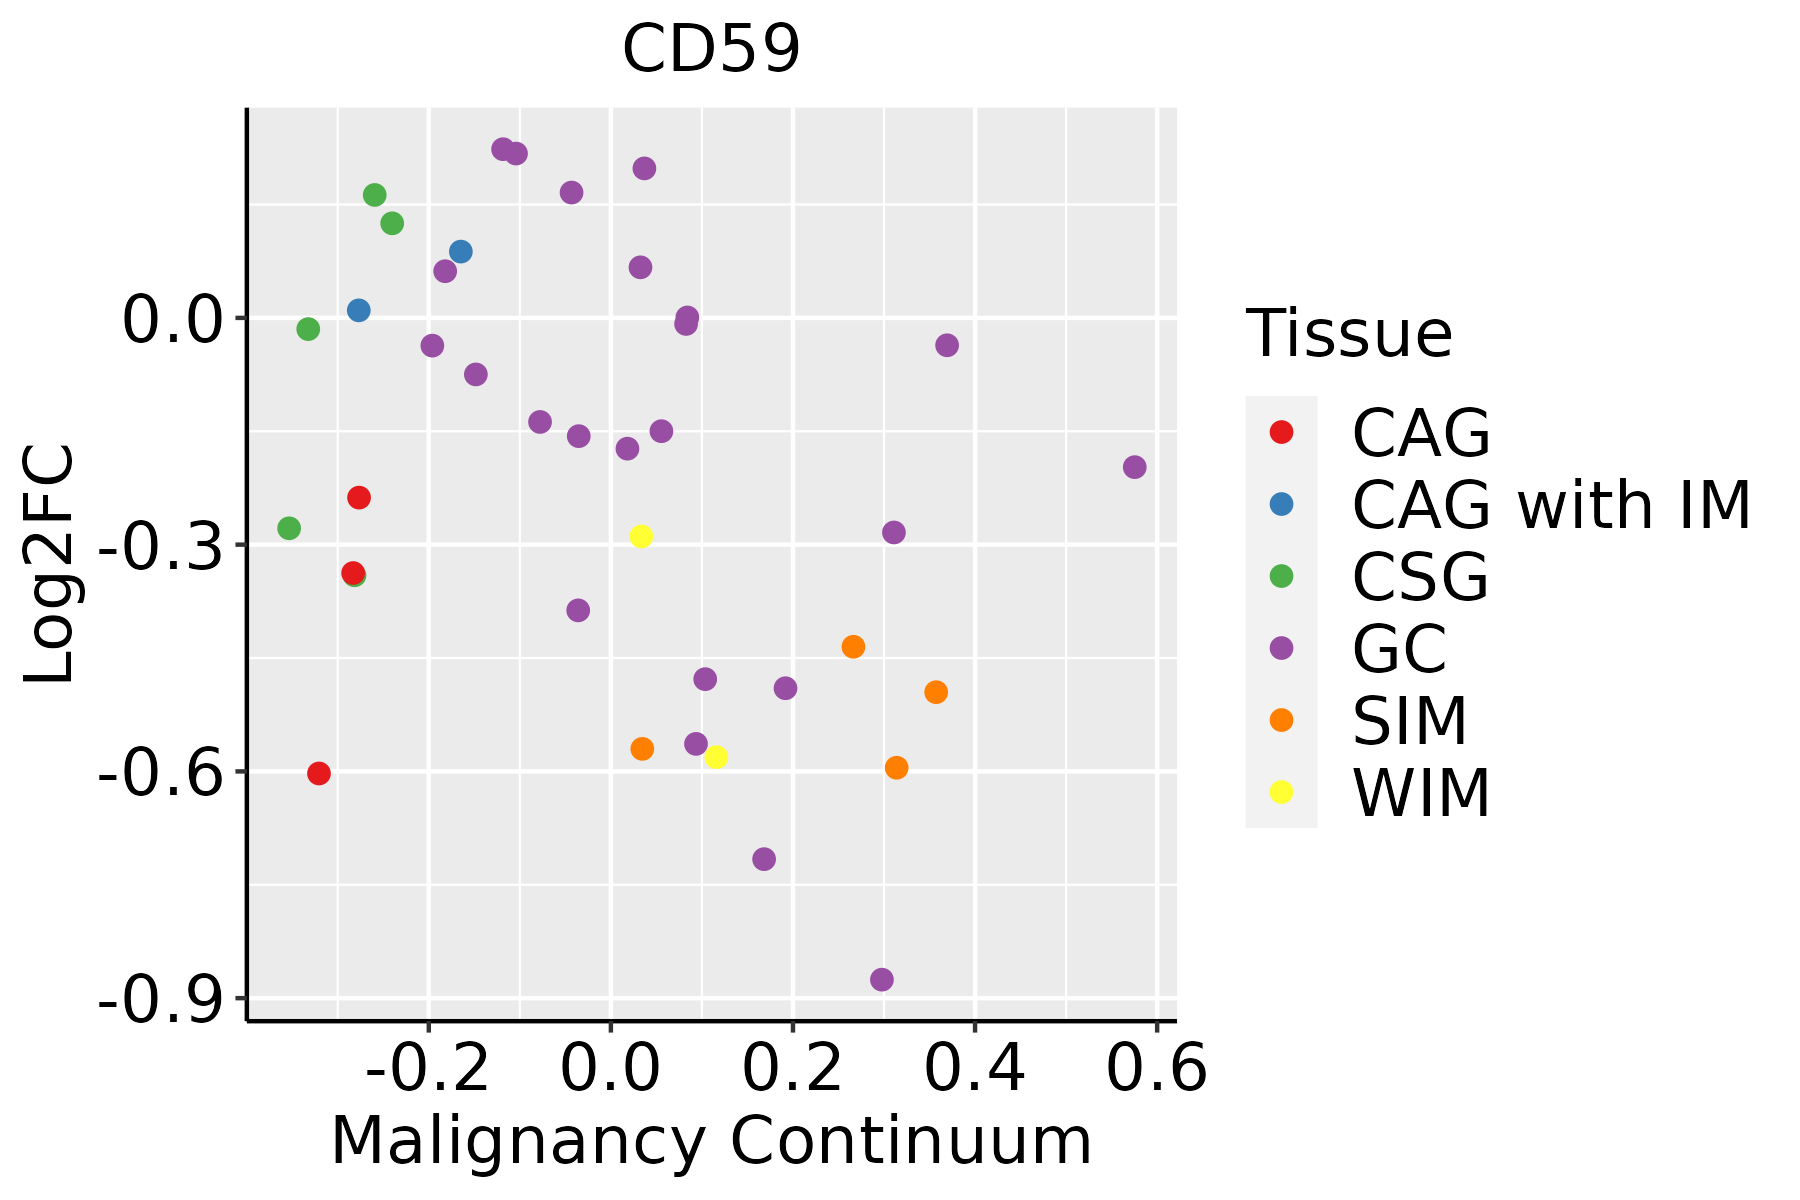
CAG: Chronic atrophic gastritis
CAG with IM: Chronic atrophic gastritis with intestinal metaplasia
CSG: Chronic superficial gastritis
GC: Gastric cancer
SIM: Severe intestinal metaplasia
WIM: Wild intestinal metaplasia
LiverThe image shows the transcriptomic changes along malignancy continuum.log2FC in expression of this searched gene in stem-like cells from each diseased tissue sample relative to stem-like cells in normal samples in each tissue plotted against the malignancy continuum. Samples are colored based on if they are from different disease stage.
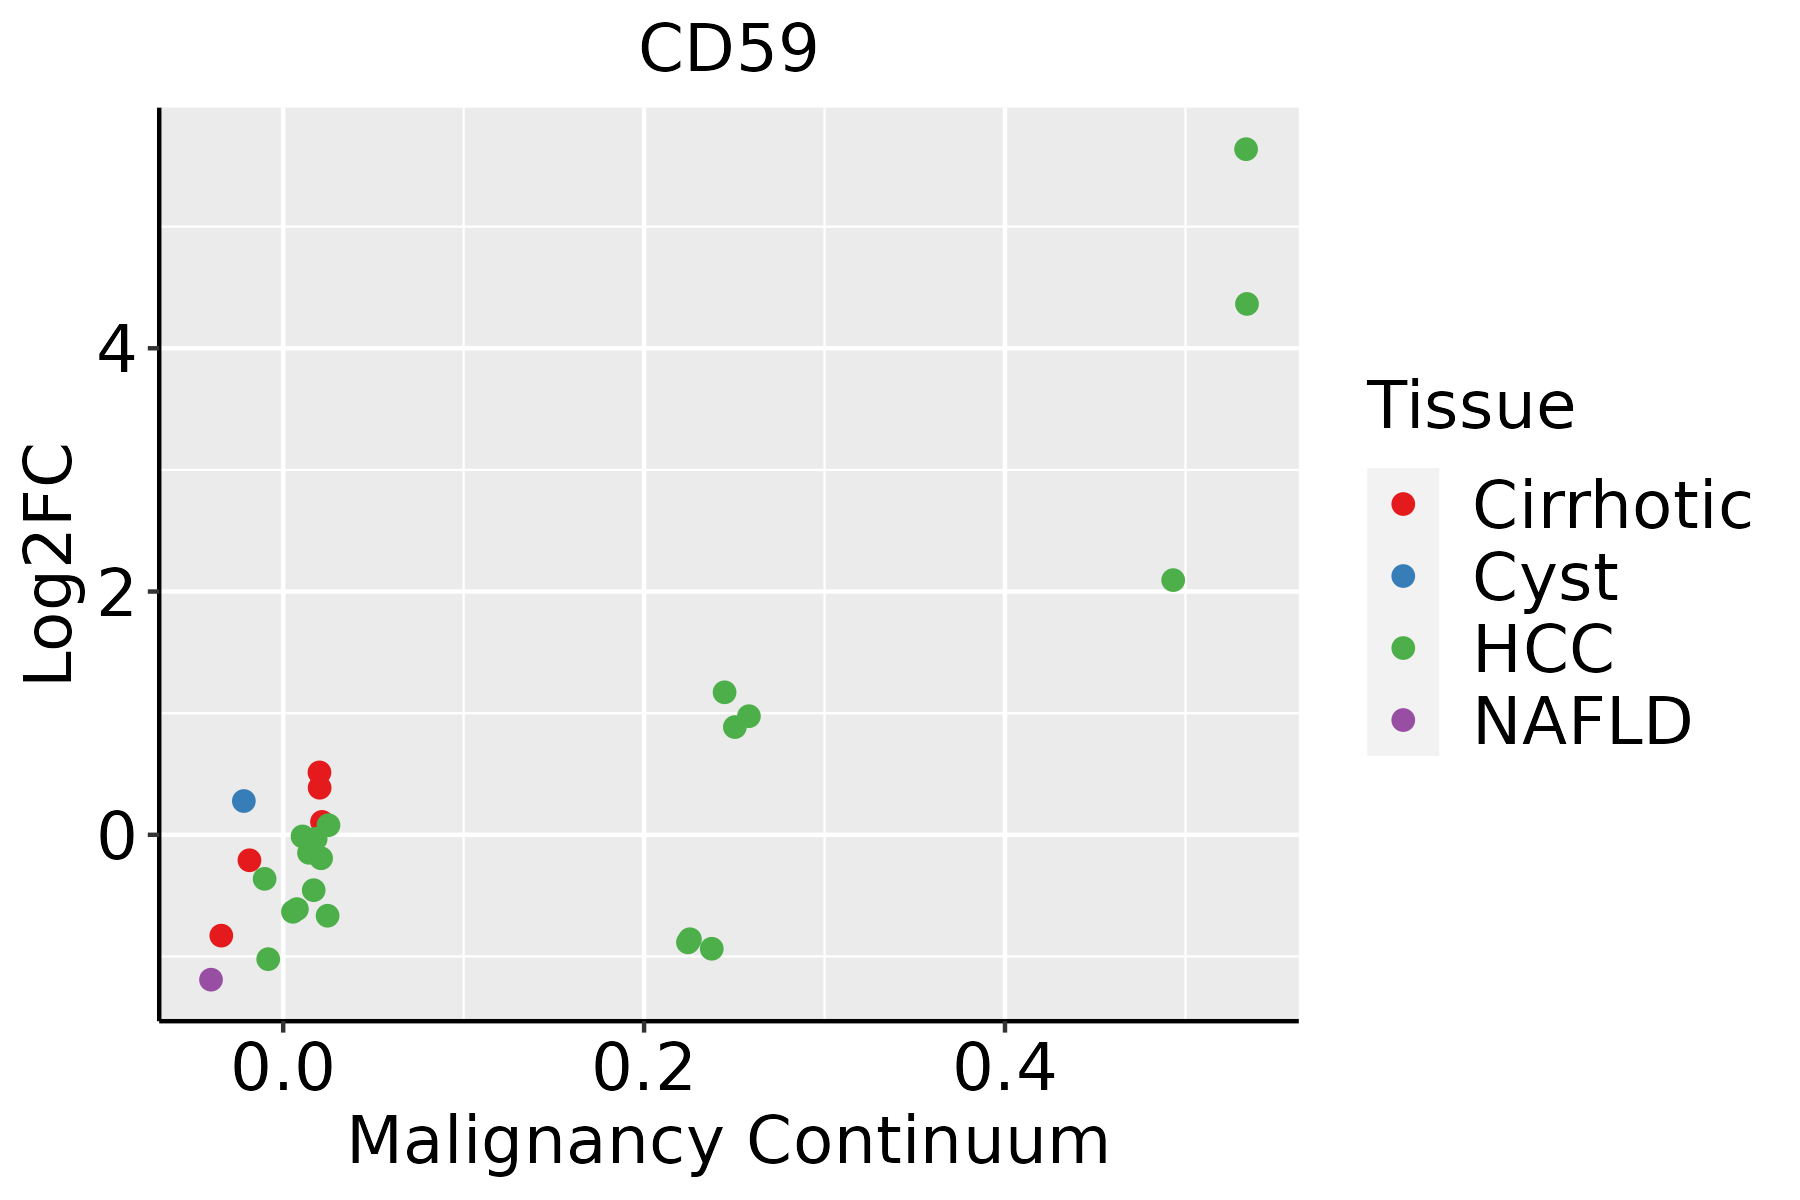
HCC: Hepatocellular carcinoma
NAFLD: Non-alcoholic fatty liver disease
LungThe image shows the transcriptomic changes along malignancy continuum.log2FC in expression of this searched gene in stem-like cells from each diseased tissue sample relative to stem-like cells in normal samples in each tissue plotted against the malignancy continuum. Samples are colored based on if they are from different disease stage.AAH: Atypical adenomatous hyperplasia
AIS: Adenocarcinoma in situ
IAC: Invasive lung adenocarcinoma
MIA: Minimally invasive adenocarcinoma
Oral CavityThe image shows the transcriptomic changes along malignancy continuum.log2FC in expression of this searched gene in stem-like cells from each diseased tissue sample relative to stem-like cells in normal samples in each tissue plotted against the malignancy continuum. Samples are colored based on if they are from different disease stage.
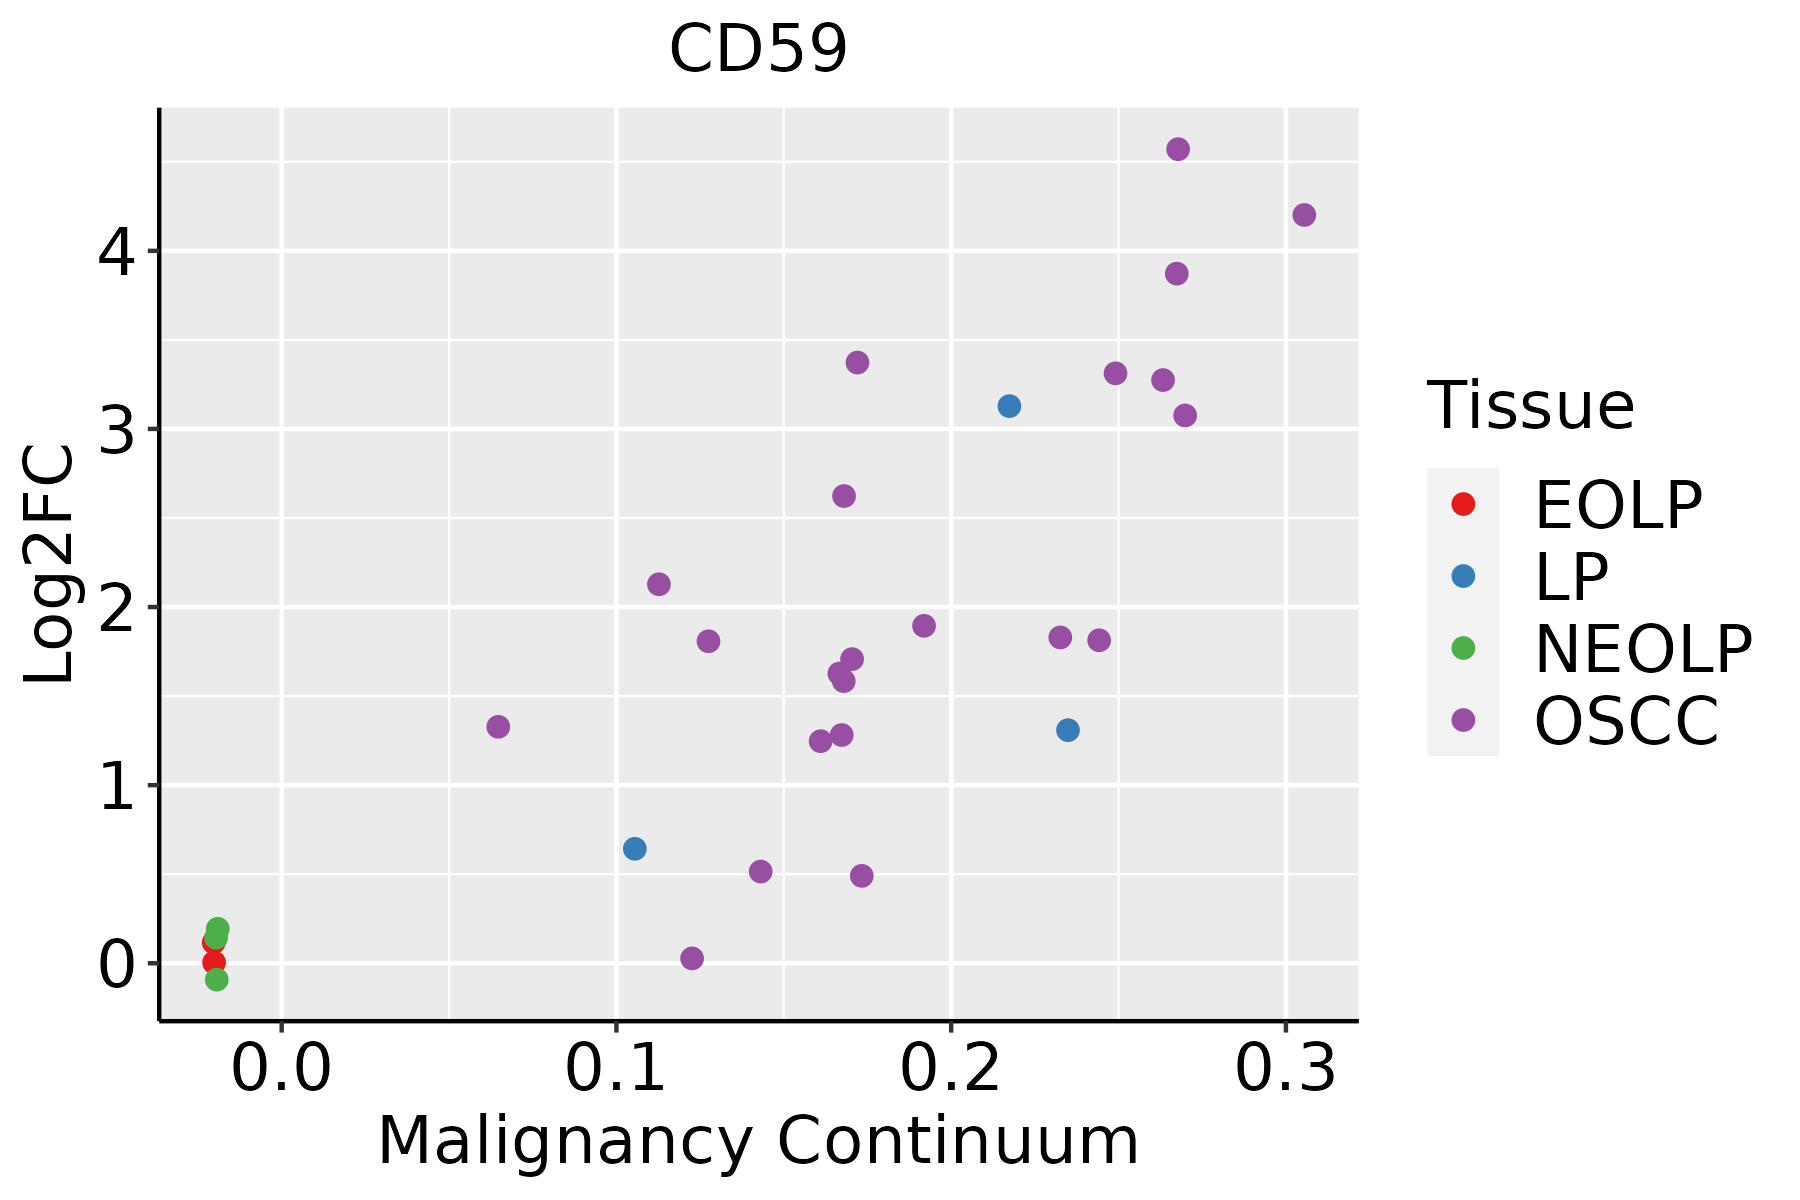
EOLP: Erosive Oral lichen planus
LP: leukoplakia
NEOLP: Non-erosive oral lichen planus
OSCC: Oral squamous cell carcinoma
ProstateThe image shows the transcriptomic changes along malignancy continuum.log2FC in expression of this searched gene in stem-like cells from each diseased tissue sample relative to stem-like cells in normal samples in each tissue plotted against the malignancy continuum. Samples are colored based on if they are from different disease stage.
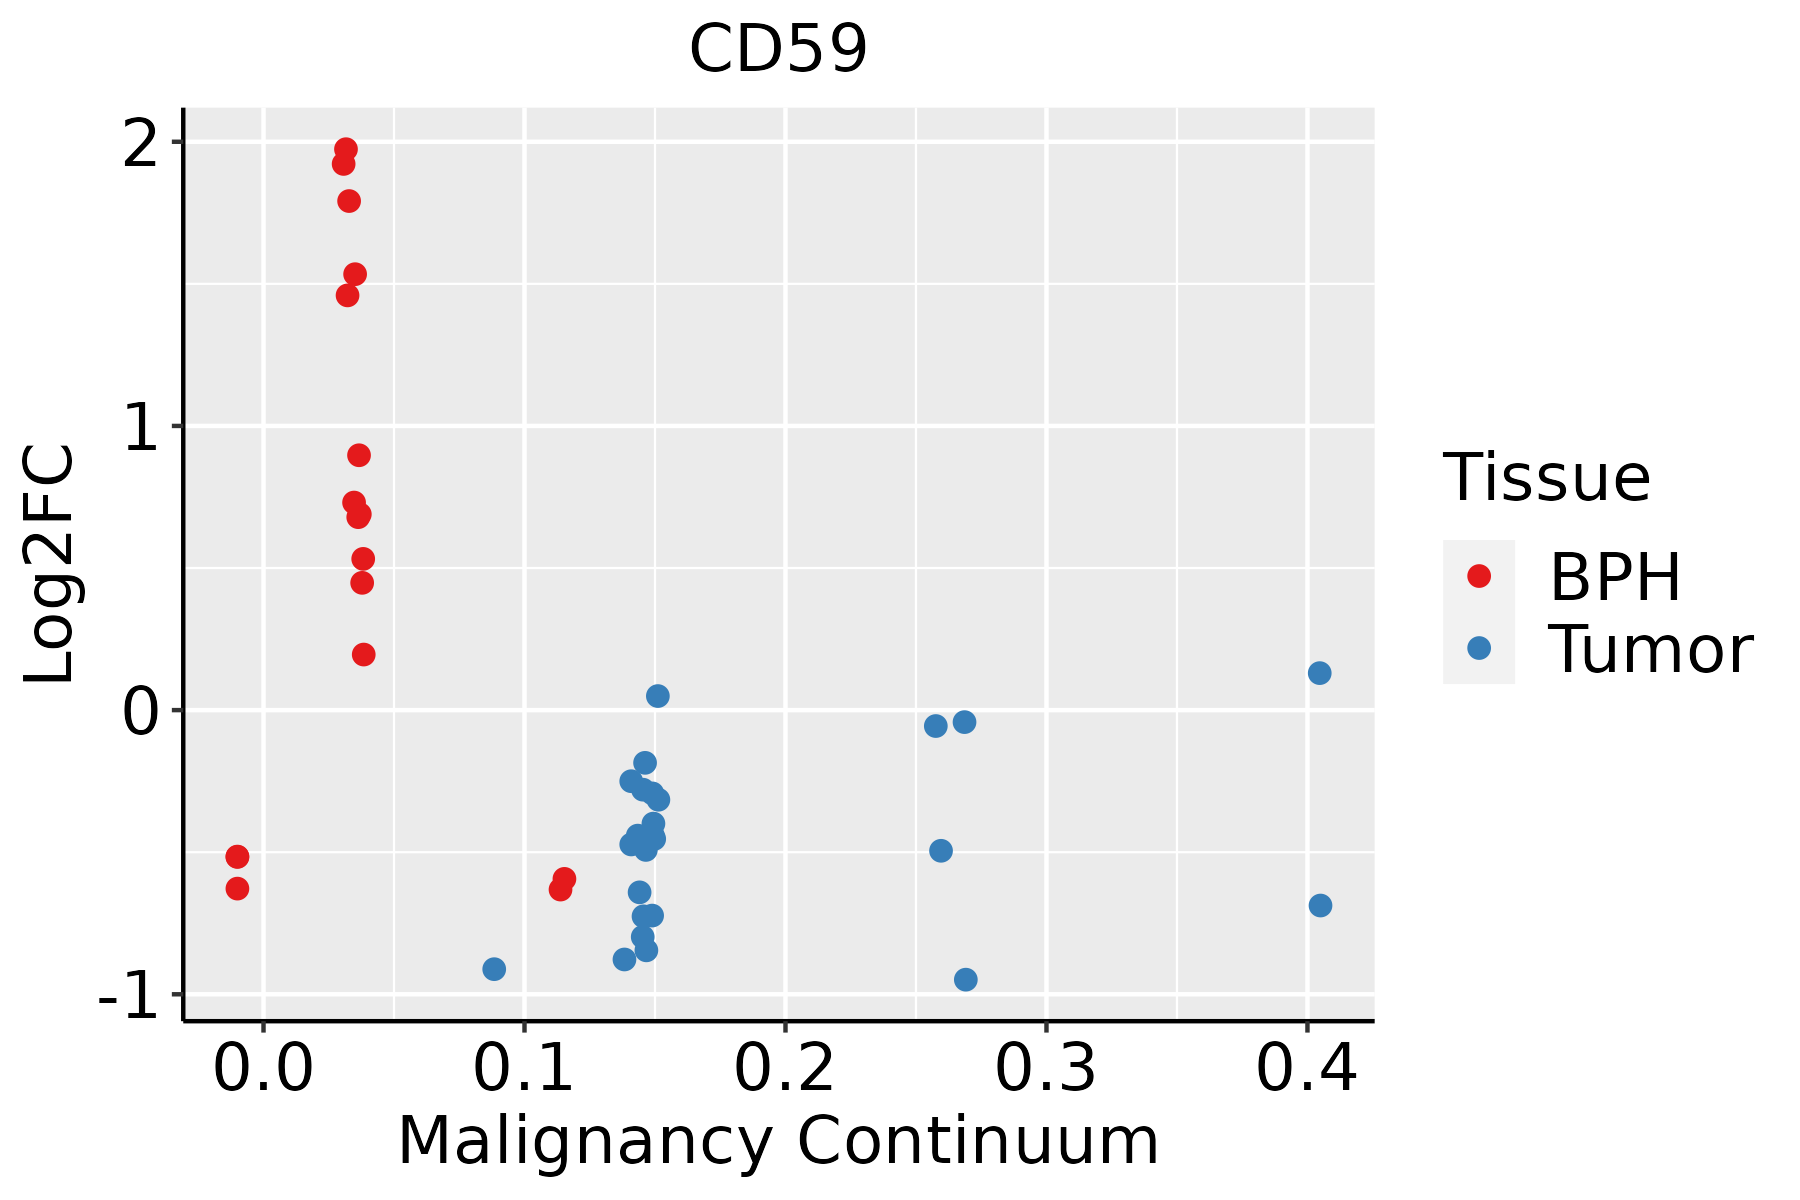
BPH: Benign Prostatic Hyperplasia
SkinThe image shows the transcriptomic changes along malignancy continuum.log2FC in expression of this searched gene in stem-like cells from each diseased tissue sample relative to stem-like cells in normal samples in each tissue plotted against the malignancy continuum. Samples are colored based on if they are from different disease stage.
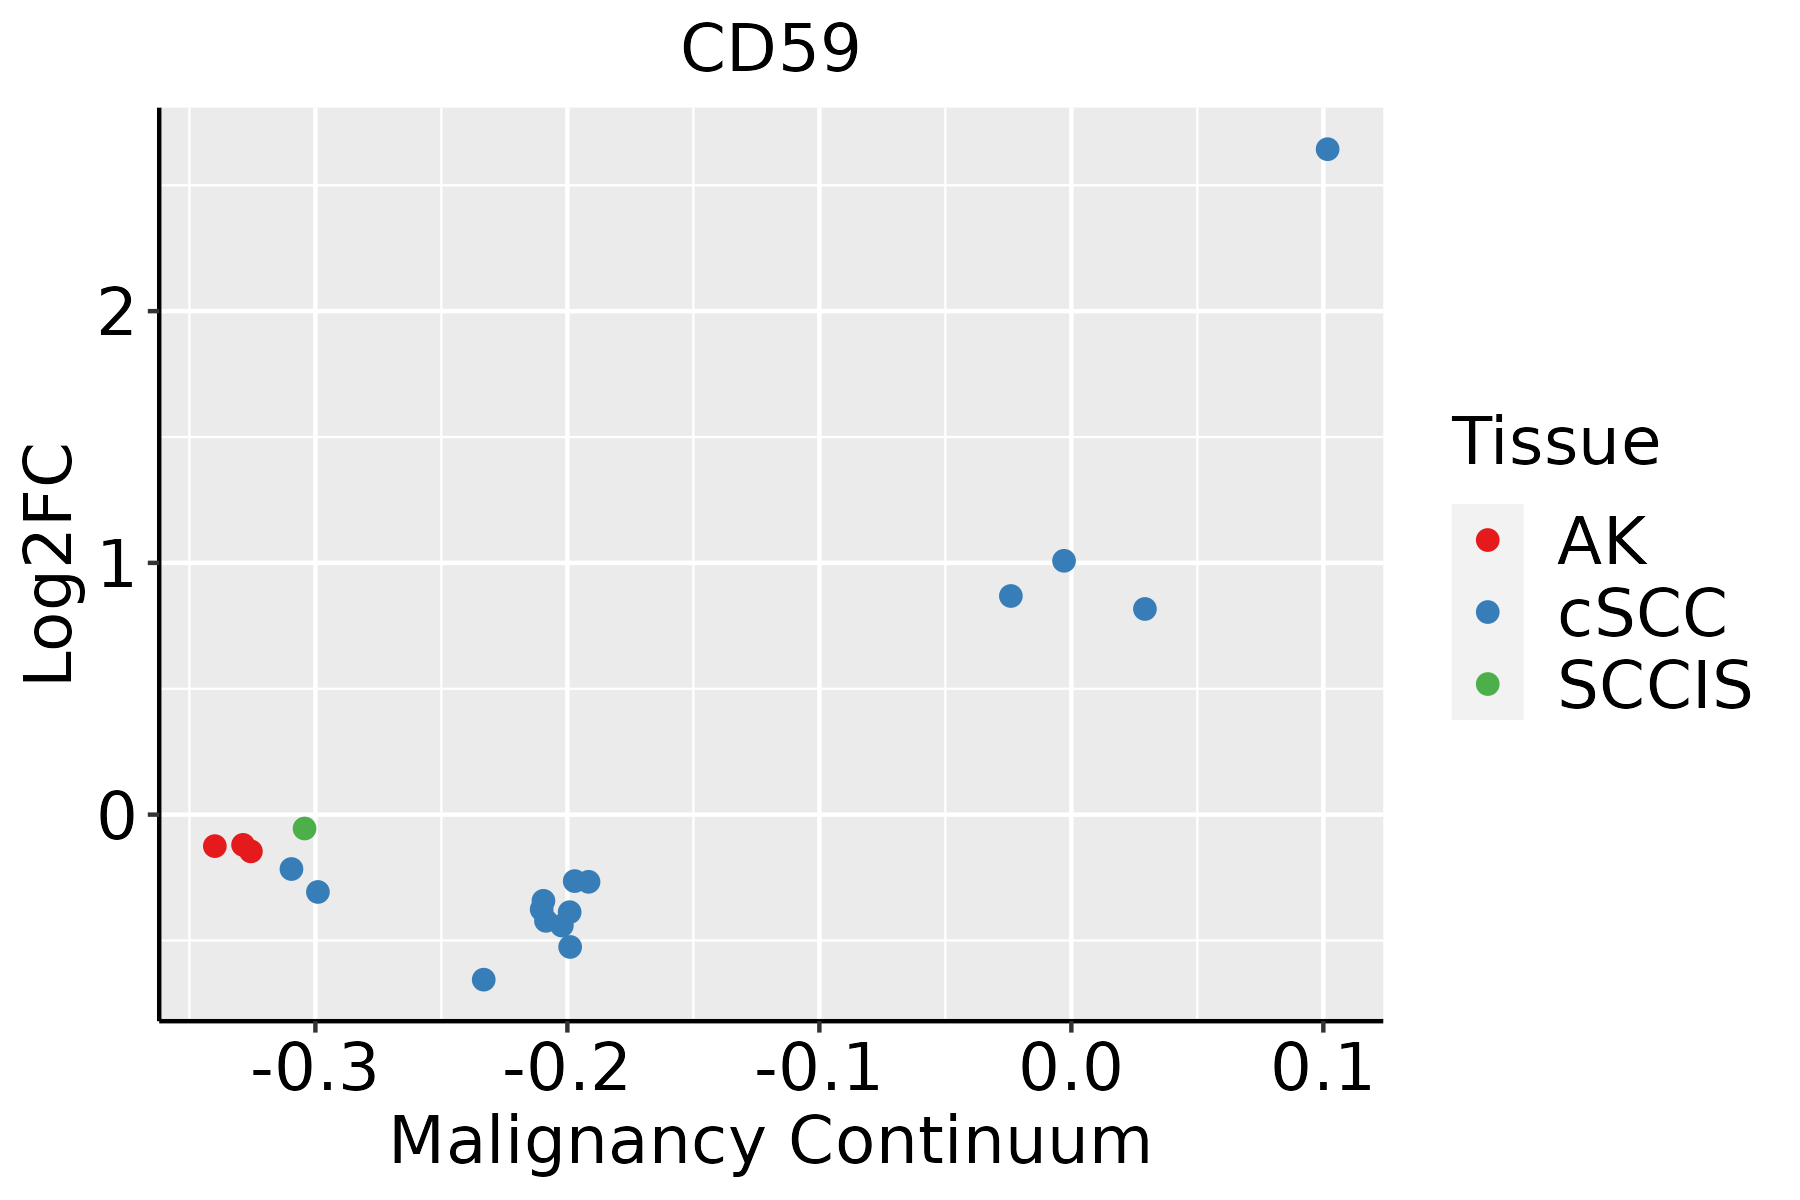
AK: Actinic keratosis
cSCC: Cutaneous squamous cell carcinoma
SCCIS:squamous cell carcinoma in situ
ThyroidThe image shows the transcriptomic changes along malignancy continuum.log2FC in expression of this searched gene in stem-like cells from each diseased tissue sample relative to stem-like cells in normal samples in each tissue plotted against the malignancy continuum. Samples are colored based on if they are from different disease stage.
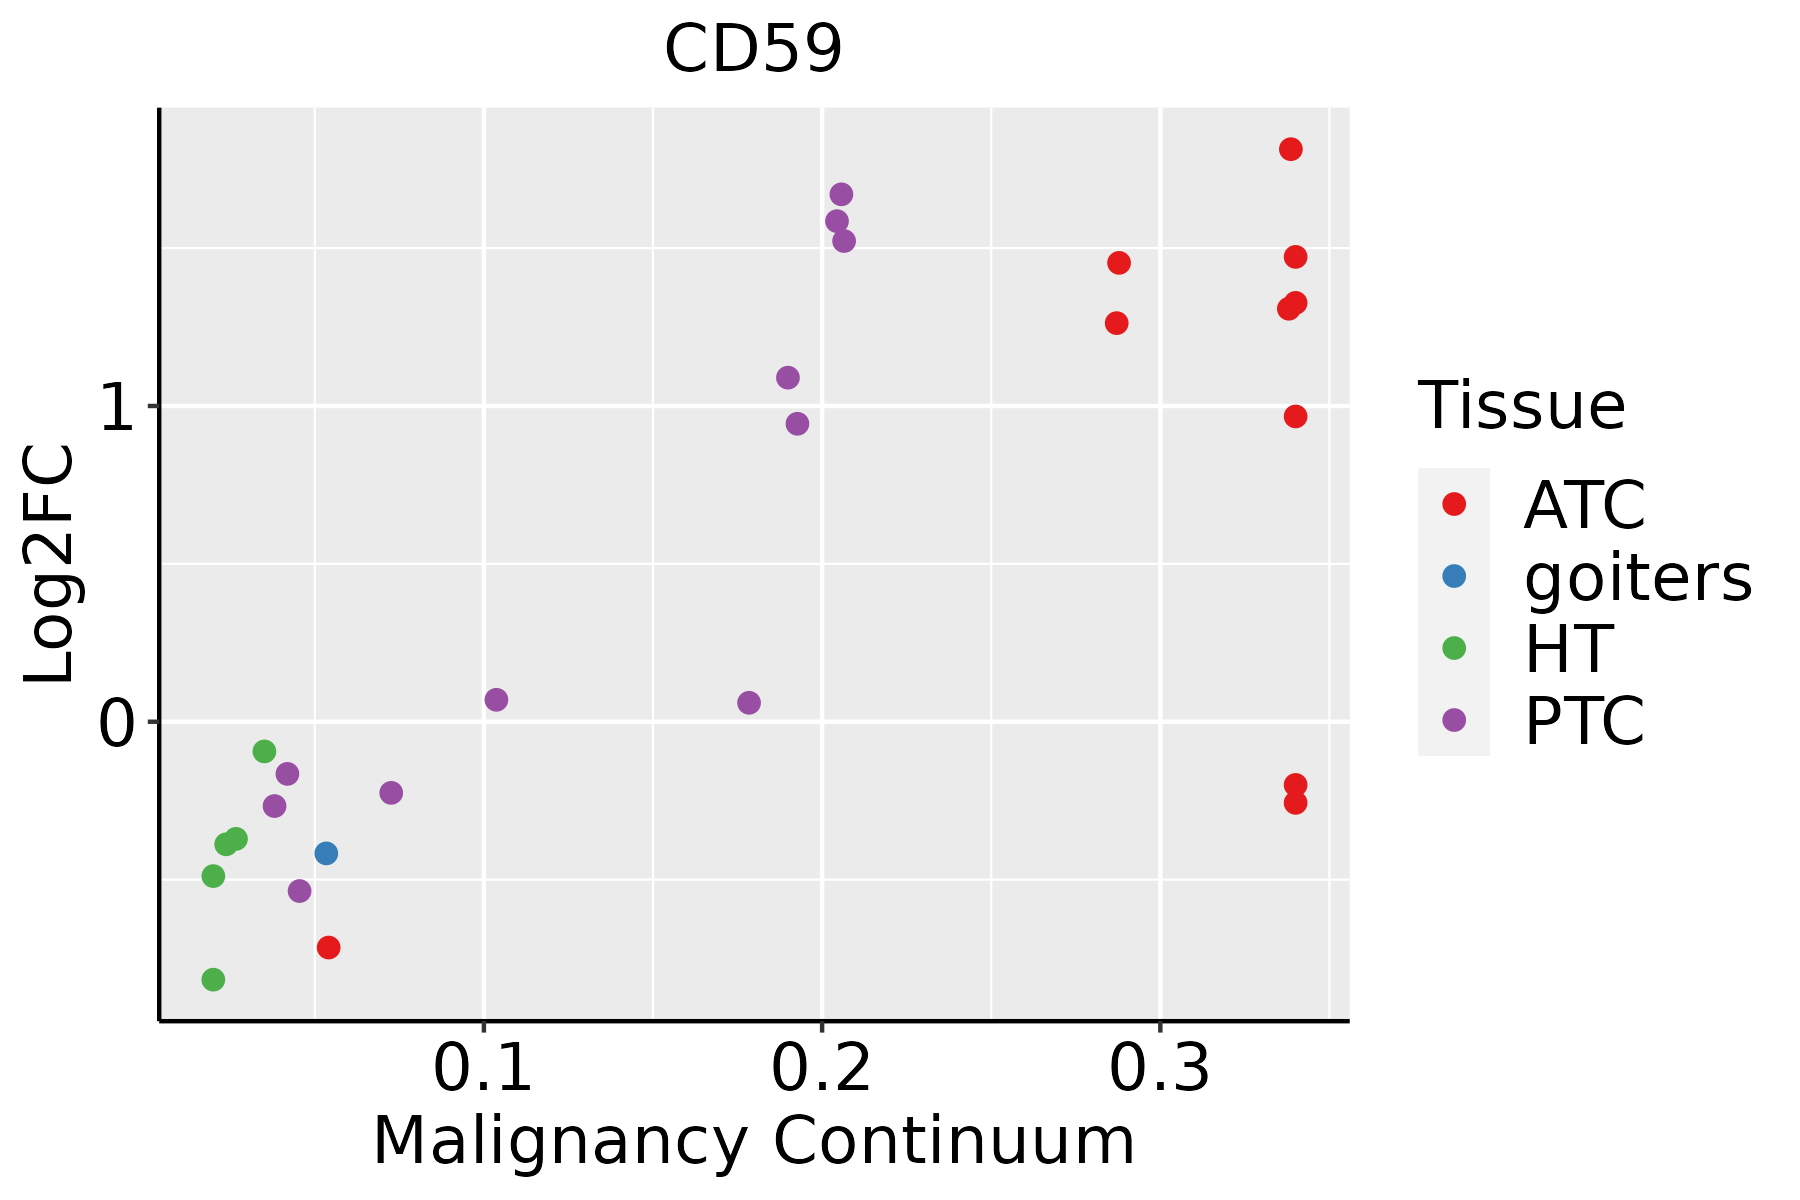
ATC: Anaplastic thyroid cancer
HT: Hashimoto's thyroiditis
PTC: Papillary thyroid cancer
∗log2FC in expression of this searched gene in stem-like cells from each diseased tissue sample relative to stem-like cells in normal samples in each tissue plotted against the malignancy continuum. Samples are colored based on if they are from different disease stage.

Top

Malignant transformation related pathway analysis

check buttonFind out the enriched GO biological processes and KEGG pathways involved in transition from healthy to precancer to cancer
check button Figure of enriched GO biological processes.
TissueDisease StageEnriched GO biological Processes
ColorectumADGO analysis - Figure of enriched GO biological processes: Top 15 enriched GO BP terms are showed in the bar plot of each disease state in each tissue. Each row represents a significant GO biological process which is colored according to the -log10(p.adjust).
ColorectumSERGO analysis - Figure of enriched GO biological processes: Top 15 enriched GO BP terms are showed in the bar plot of each disease state in each tissue. Each row represents a significant GO biological process which is colored according to the -log10(p.adjust).
ColorectumMSSGO analysis - Figure of enriched GO biological processes: Top 15 enriched GO BP terms are showed in the bar plot of each disease state in each tissue. Each row represents a significant GO biological process which is colored according to the -log10(p.adjust).
ColorectumMSI-HGO analysis - Figure of enriched GO biological processes: Top 15 enriched GO BP terms are showed in the bar plot of each disease state in each tissue. Each row represents a significant GO biological process which is colored according to the -log10(p.adjust).
ColorectumFAPGO analysis - Figure of enriched GO biological processes: Top 15 enriched GO BP terms are showed in the bar plot of each disease state in each tissue. Each row represents a significant GO biological process which is colored according to the -log10(p.adjust).
∗Top 15 enriched GO BP terms are showed in the bar plot of each disease state in each tissue. Each row represents a significant GO biological process which is colored according to the -log10(p.adjust).
Page: 1 2 3 4 5 6 7 8 9 

check button Enriched GO biological processes.
GO IDTissueDisease StageDescriptionGene RatioBg Ratiopvaluep.adjustCount
GO:00420609BreastPrecancerwound healing48/1080422/187235.48e-061.63e-0448
GO:00508789BreastPrecancerregulation of body fluid levels40/1080379/187231.68e-042.77e-0340
GO:00026836BreastPrecancernegative regulation of immune system process41/1080434/187231.33e-031.40e-0241
GO:00075995BreastPrecancerhemostasis24/1080222/187232.31e-032.15e-0224
GO:00075965BreastPrecancerblood coagulation23/1080217/187233.61e-032.98e-0223
GO:00508175BreastPrecancercoagulation23/1080222/187234.78e-033.64e-0223
GO:004206014BreastIDCwound healing55/1434422/187237.27e-051.45e-0355
GO:005087813BreastIDCregulation of body fluid levels50/1434379/187231.12e-042.10e-0350
GO:000268311BreastIDCnegative regulation of immune system process55/1434434/187231.53e-042.67e-0355
GO:00069596BreastIDChumoral immune response40/1434317/187231.25e-031.33e-0240
GO:00022532BreastIDCactivation of immune response43/1434375/187235.16e-033.84e-0243
GO:000268321BreastDCISnegative regulation of immune system process57/1390434/187231.81e-054.35e-0457
GO:005087823BreastDCISregulation of body fluid levels50/1390379/187235.17e-051.06e-0350
GO:004206024BreastDCISwound healing54/1390422/187236.09e-051.22e-0354
GO:000225311BreastDCISactivation of immune response43/1390375/187232.96e-032.54e-0243
GO:000695911BreastDCIShumoral immune response37/1390317/187234.16e-033.29e-0237
GO:004206010CervixCCwound healing109/2311422/187231.84e-141.57e-11109
GO:00026837CervixCCnegative regulation of immune system process94/2311434/187232.63e-081.87e-0694
GO:005087810CervixCCregulation of body fluid levels78/2311379/187233.20e-068.77e-0578
GO:00022533CervixCCactivation of immune response72/2311375/187238.26e-051.11e-0372
Page: 1 2 3 4 5 6 7 8 9 10 11 12 

check button Enriched KEGG pathways.
Pathway IDTissueDisease StageDescriptionGene RatioBg Ratiopvaluep.adjustqvalueCount
hsa04640CervixHSIL_HPVHematopoietic cell lineage18/45999/84654.97e-068.10e-056.54e-0518
hsa046401CervixHSIL_HPVHematopoietic cell lineage18/45999/84654.97e-068.10e-056.54e-0518
hsa046402CervixN_HPVHematopoietic cell lineage13/34999/84651.98e-041.74e-031.36e-0313
hsa046403CervixN_HPVHematopoietic cell lineage13/34999/84651.98e-041.74e-031.36e-0313
hsa04610LiverNAFLDComplement and coagulation cascades35/104386/84652.48e-112.04e-091.64e-0935
hsa046101LiverNAFLDComplement and coagulation cascades35/104386/84652.48e-112.04e-091.64e-0935
hsa046102LiverCirrhoticComplement and coagulation cascades48/253086/84654.41e-075.44e-063.35e-0648
hsa046103LiverCirrhoticComplement and coagulation cascades48/253086/84654.41e-075.44e-063.35e-0648
hsa046104LiverHCCComplement and coagulation cascades57/402086/84653.19e-041.45e-038.04e-0457
hsa046105LiverHCCComplement and coagulation cascades57/402086/84653.19e-041.45e-038.04e-0457
Page: 1 

Top

Cell-cell communication analysis

check buttonIdentification of potential cell-cell interactions between two cell types and their ligand-receptor pairs for different disease states
LigandReceptorLRpairPathwayTissueDisease Stage
Page: 1 

Top

Single-cell gene regulatory network inference analysis

check buttonFind out the significant the regulons (TFs) and the target genes of each regulon across cell types for different disease states
TFCell TypeTissueDisease StageTarget GeneRSSRegulon Activity
CD59ICAFColorectumADJTAGLN2,VIM,CRIP2, etc.2.53e-01The dot plots of a searched regulon are shown for all cell subpopulations in each disease state of each tissue based on the regulon specific score inferred using pySCENIC and by calculating the average expression.
CD59ICAFColorectumCRCTAGLN2,VIM,CRIP2, etc.4.71e-02The dot plots of a searched regulon are shown for all cell subpopulations in each disease state of each tissue based on the regulon specific score inferred using pySCENIC and by calculating the average expression.
CD59STMStomachADJCD63,TM4SF1,IFI27, etc.2.81e-01The dot plots of a searched regulon are shown for all cell subpopulations in each disease state of each tissue based on the regulon specific score inferred using pySCENIC and by calculating the average expression.
CD59STMStomachCAG with IMCD63,TM4SF1,IFI27, etc.2.70e-01The dot plots of a searched regulon are shown for all cell subpopulations in each disease state of each tissue based on the regulon specific score inferred using pySCENIC and by calculating the average expression.
CD59STMStomachCSGCD63,TM4SF1,IFI27, etc.2.76e-01The dot plots of a searched regulon are shown for all cell subpopulations in each disease state of each tissue based on the regulon specific score inferred using pySCENIC and by calculating the average expression.
CD59PTCThyroidATCCYBA,B2M,APLP2, etc.3.94e-01The dot plots of a searched regulon are shown for all cell subpopulations in each disease state of each tissue based on the regulon specific score inferred using pySCENIC and by calculating the average expression.
∗The dot plots of a searched regulon are shown for all cell subpopulations in each disease state of each tissue based on the regulon specific score inferred using pySCENIC and by calculating the average expression.
Page: 1 

Top

Somatic mutation of malignant transformation related genes

check buttonAnnotation of somatic variants for genes involved in malignant transformation
Hugo SymbolVariant ClassVariant ClassificationdbSNP RSHGVScHGVSpHGVSp ShortSWISSPROTBIOTYPESIFTPolyPhenTumor Sample BarcodeTissueHistologySexAgeStageTherapy TypesDrugsOutcome
CD59SNVMissense_Mutationrs754311428c.292N>Ap.Glu98Lysp.E98KP13987protein_codingtolerated(0.56)benign(0)TCGA-AN-A046-01Breastbreast invasive carcinomaFemale>=65I/IIUnknownUnknownSD
CD59SNVMissense_Mutationnovelc.327G>Tp.Glu109Aspp.E109DP13987protein_codingtolerated(0.17)benign(0.031)TCGA-EI-6917-01Colorectumrectum adenocarcinomaMale<65III/IVChemotherapy5fluorouracil+oxaciplatina+l-folinianSD
CD59SNVMissense_Mutationc.122C>Tp.Ala41Valp.A41VP13987protein_codingtolerated(0.73)benign(0.001)TCGA-AX-A0J1-01Endometriumuterine corpus endometrioid carcinomaFemale>=65I/IIUnknownUnknownSD
CD59SNVMissense_Mutationnovelc.184N>Gp.Asn62Aspp.N62DP13987protein_codingtolerated(0.26)benign(0.15)TCGA-BG-A221-01Endometriumuterine corpus endometrioid carcinomaFemale>=65I/IIUnknownUnknownSD
CD59SNVMissense_Mutationrs754311428c.292N>Ap.Glu98Lysp.E98KP13987protein_codingtolerated(0.56)benign(0)TCGA-D1-A160-01Endometriumuterine corpus endometrioid carcinomaFemale>=65I/IIUnknownUnknownSD
CD59SNVMissense_Mutationnovelc.187N>Gp.Lys63Glup.K63EP13987protein_codingdeleterious(0.02)benign(0.001)TCGA-EY-A215-01Endometriumuterine corpus endometrioid carcinomaFemale<65I/IIUnknownUnknownSD
CD59SNVMissense_Mutationrs146915059c.65N>Tp.Ser22Leup.S22LP13987protein_codingtolerated(0.23)benign(0.015)TCGA-FI-A2EW-01Endometriumuterine corpus endometrioid carcinomaFemale>=65I/IIChemotherapycarboplatinumPD
CD59SNVMissense_Mutationrs759088791c.149C>Tp.Ala50Valp.A50VP13987protein_codingtolerated(0.13)benign(0.047)TCGA-SJ-A6ZI-01Endometriumuterine corpus endometrioid carcinomaFemale<65I/IIUnknownUnknownSD
CD59insertionFrame_Shift_Insnovelc.229_230insGTTTGAGCATTGCAATTTCAACGACGTCACAAp.Thr77SerfsTer14p.T77Sfs*14P13987protein_codingTCGA-44-4112-01Lunglung adenocarcinomaFemale<65I/IIChemotherapycisplatinPD
CD59SNVMissense_Mutationnovelc.148N>Ap.Ala50Thrp.A50TP13987protein_codingtolerated(0.25)benign(0.044)TCGA-CQ-7071-01Oral cavityhead & neck squamous cell carcinomaFemale>=65III/IVUnknownUnknownSD
Page: 1 

Top

Related drugs of malignant transformation related genes

check buttonIdentification of chemicals and drugs interact with genes involved in malignant transfromation
(DGIdb 4.0)
Entrez IDSymbolCategoryInteraction TypesDrug Claim NameDrug NamePMIDs
966CD59DRUGGABLE GENOME, CELL SURFACE, KINASEMBL17113913
Page: 1