
|
|||||
|
 | |
| |
| |
| |
| |
| |
|
Gene: CD58 |
Gene summary for CD58 |
| Gene information | Species | Human | Gene symbol | CD58 | Gene ID | 965 |
| Gene name | CD58 molecule | |
| Gene Alias | LFA-3 | |
| Cytomap | 1p13.1 | |
| Gene Type | protein-coding | GO ID | GO:0001816 | UniProtAcc | P19256 |
Top |
Malignant transformation analysis |
| Identification of the aberrant gene expression in precancerous and cancerous lesions by comparing the gene expression of stem-like cells in diseased tissues with normal stem cells |
| Entrez ID | Symbol | Replicates | Species | Organ | Tissue | Adj P-value | Log2FC | Malignancy |
| 965 | CD58 | CCI_1 | Human | Cervix | CC | 9.64e-04 | 8.79e-01 | 0.528 |
| 965 | CD58 | CCI_3 | Human | Cervix | CC | 5.14e-04 | 6.89e-01 | 0.516 |
| 965 | CD58 | sample3 | Human | Cervix | CC | 1.29e-05 | 1.58e-01 | 0.1387 |
| 965 | CD58 | T3 | Human | Cervix | CC | 9.87e-04 | 1.48e-01 | 0.1389 |
| 965 | CD58 | LZE4T | Human | Esophagus | ESCC | 1.04e-23 | 7.39e-01 | 0.0811 |
| 965 | CD58 | LZE7T | Human | Esophagus | ESCC | 3.58e-06 | 3.46e-01 | 0.0667 |
| 965 | CD58 | LZE8T | Human | Esophagus | ESCC | 7.22e-07 | 4.04e-02 | 0.067 |
| 965 | CD58 | LZE20T | Human | Esophagus | ESCC | 1.98e-09 | 2.58e-01 | 0.0662 |
| 965 | CD58 | LZE24D1 | Human | Esophagus | HGIN | 2.92e-02 | 3.25e-01 | 0.054 |
| 965 | CD58 | LZE24T | Human | Esophagus | ESCC | 3.98e-07 | 1.38e-01 | 0.0596 |
| 965 | CD58 | LZE21T | Human | Esophagus | ESCC | 1.42e-04 | 3.09e-01 | 0.0655 |
| 965 | CD58 | LZE6T | Human | Esophagus | ESCC | 2.66e-03 | 3.43e-01 | 0.0845 |
| 965 | CD58 | P1T-E | Human | Esophagus | ESCC | 2.48e-06 | 5.10e-01 | 0.0875 |
| 965 | CD58 | P2T-E | Human | Esophagus | ESCC | 1.09e-02 | 1.32e-01 | 0.1177 |
| 965 | CD58 | P4T-E | Human | Esophagus | ESCC | 6.21e-22 | 5.68e-01 | 0.1323 |
| 965 | CD58 | P5T-E | Human | Esophagus | ESCC | 2.33e-20 | 5.00e-01 | 0.1327 |
| 965 | CD58 | P8T-E | Human | Esophagus | ESCC | 8.09e-12 | 1.33e-01 | 0.0889 |
| 965 | CD58 | P9T-E | Human | Esophagus | ESCC | 4.61e-11 | 4.91e-01 | 0.1131 |
| 965 | CD58 | P10T-E | Human | Esophagus | ESCC | 1.31e-15 | 1.31e-01 | 0.116 |
| 965 | CD58 | P11T-E | Human | Esophagus | ESCC | 8.89e-22 | 7.24e-01 | 0.1426 |
| Page: 1 2 3 4 5 |
| Tissue | Expression Dynamics | Abbreviation |
| Cervix | 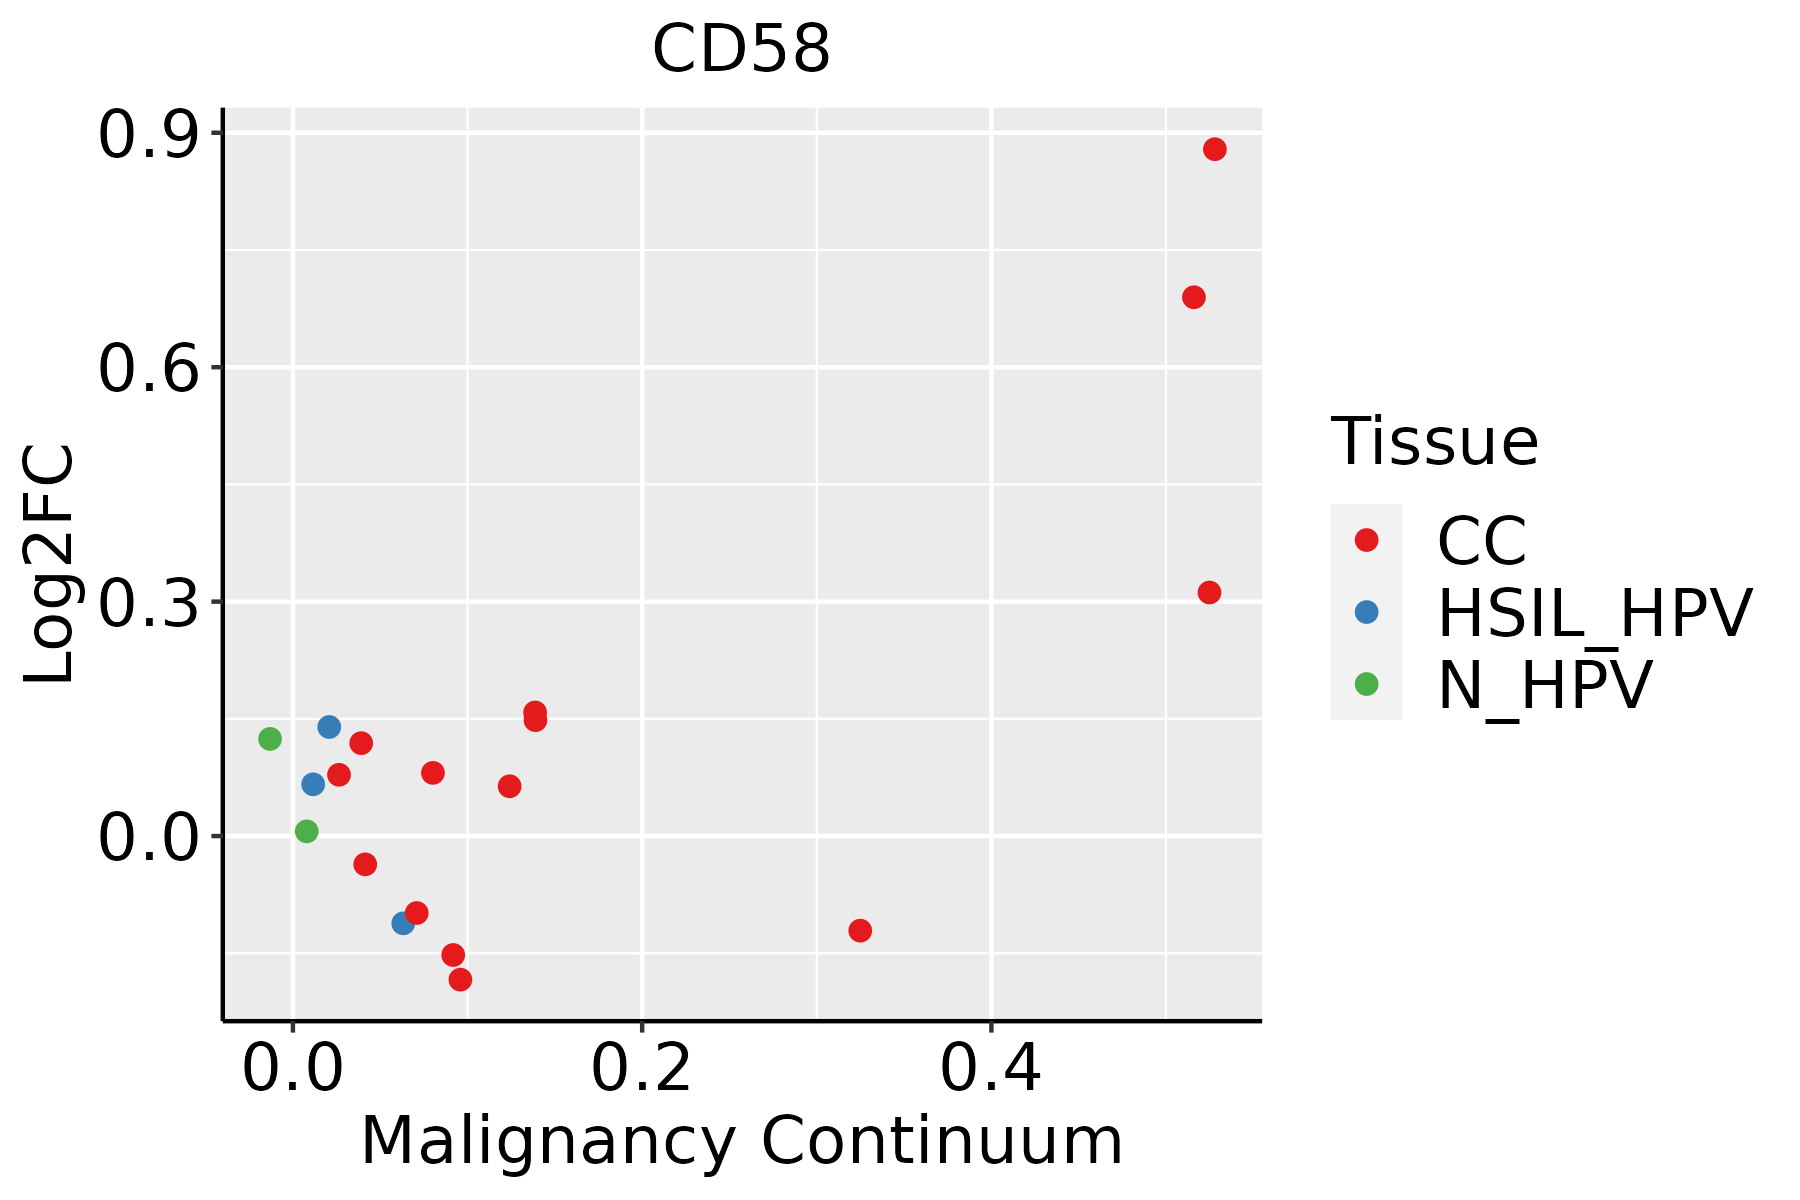 | CC: Cervix cancer |
| HSIL_HPV: HPV-infected high-grade squamous intraepithelial lesions | ||
| N_HPV: HPV-infected normal cervix | ||
| Esophagus |  | ESCC: Esophageal squamous cell carcinoma |
| HGIN: High-grade intraepithelial neoplasias | ||
| LGIN: Low-grade intraepithelial neoplasias | ||
| Liver |  | HCC: Hepatocellular carcinoma |
| NAFLD: Non-alcoholic fatty liver disease | ||
| Oral Cavity | 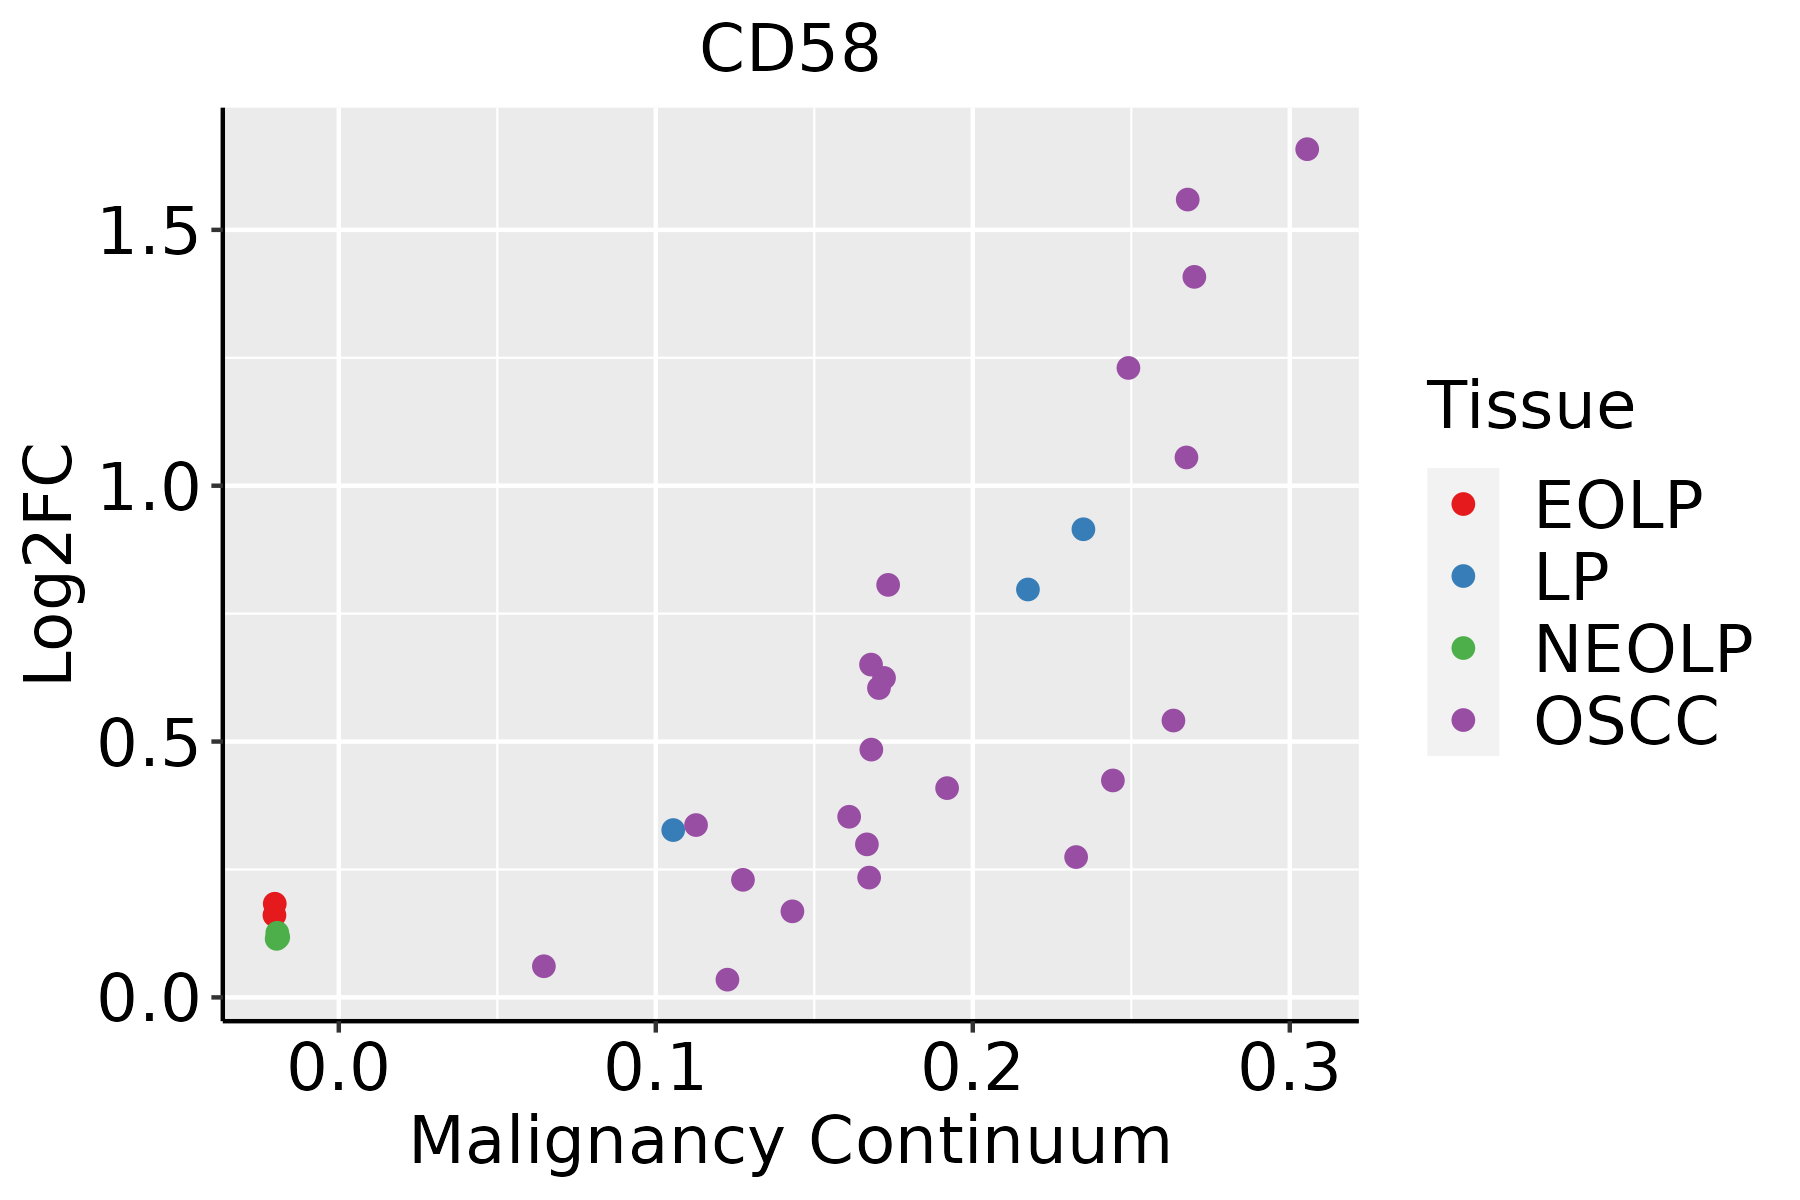 | EOLP: Erosive Oral lichen planus |
| LP: leukoplakia | ||
| NEOLP: Non-erosive oral lichen planus | ||
| OSCC: Oral squamous cell carcinoma | ||
| Skin | 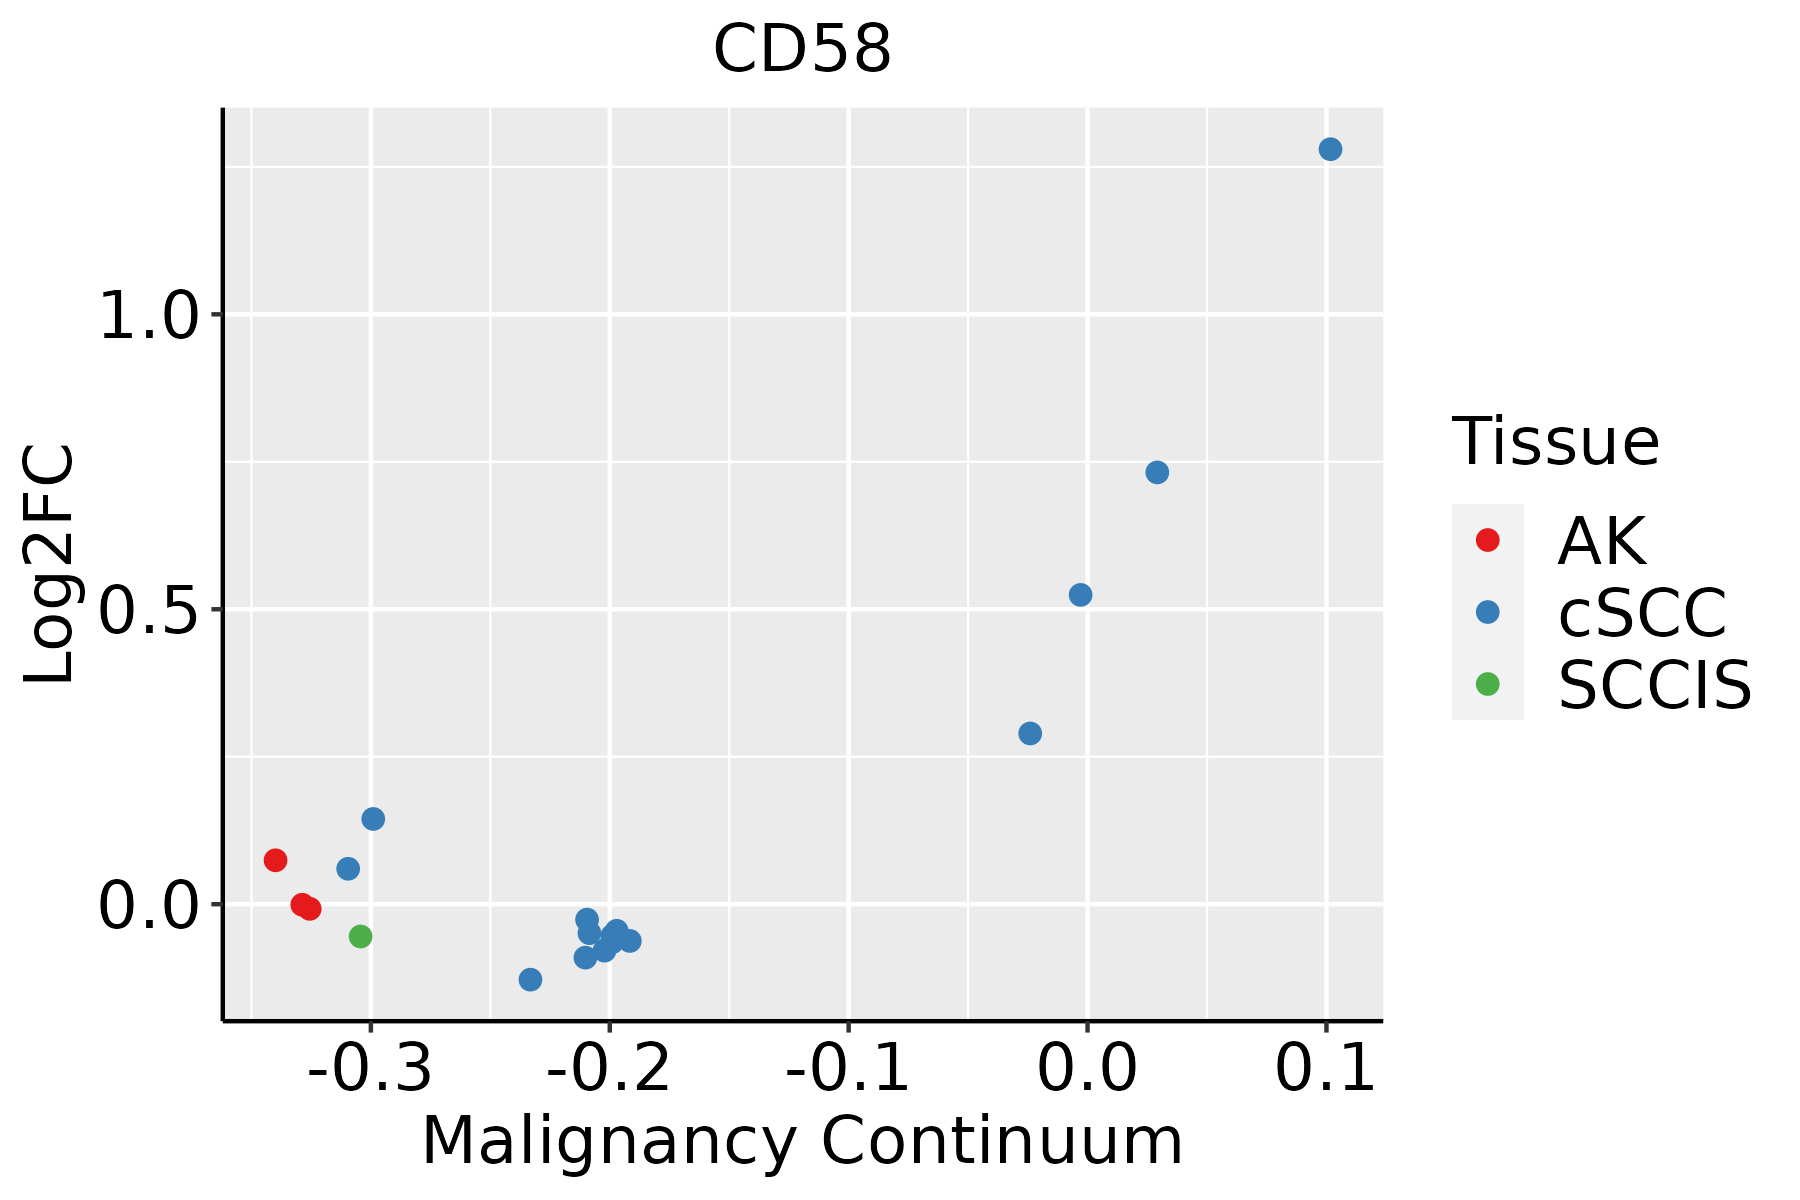 | AK: Actinic keratosis |
| cSCC: Cutaneous squamous cell carcinoma | ||
| SCCIS:squamous cell carcinoma in situ |
| ∗log2FC in expression of this searched gene in stem-like cells from each diseased tissue sample relative to stem-like cells in normal samples in each tissue plotted against the malignancy continuum. Samples are colored based on if they are from different disease stage. |
Top |
Malignant transformation related pathway analysis |
| Find out the enriched GO biological processes and KEGG pathways involved in transition from healthy to precancer to cancer |
| Tissue | Disease Stage | Enriched GO biological Processes |
| Colorectum | AD |  |
| Colorectum | SER |  |
| Colorectum | MSS |  |
| Colorectum | MSI-H |  |
| Colorectum | FAP |  |
| ∗Top 15 enriched GO BP terms are showed in the bar plot of each disease state in each tissue. Each row represents a significant GO biological process which is colored according to the -log10(p.adjust). |
| Page: 1 2 3 4 5 6 7 8 9 |
| GO ID | Tissue | Disease Stage | Description | Gene Ratio | Bg Ratio | pvalue | p.adjust | Count |
| GO:00018197 | Cervix | CC | positive regulation of cytokine production | 95/2311 | 467/18723 | 4.88e-07 | 1.85e-05 | 95 |
| GO:00346129 | Cervix | CC | response to tumor necrosis factor | 55/2311 | 253/18723 | 1.75e-05 | 3.32e-04 | 55 |
| GO:00713569 | Cervix | CC | cellular response to tumor necrosis factor | 51/2311 | 229/18723 | 1.75e-05 | 3.32e-04 | 51 |
| GO:00343415 | Cervix | CC | response to interferon-gamma | 30/2311 | 141/18723 | 1.88e-03 | 1.39e-02 | 30 |
| GO:00713463 | Cervix | CC | cellular response to interferon-gamma | 25/2311 | 118/18723 | 4.54e-03 | 2.75e-02 | 25 |
| GO:00341133 | Cervix | CC | heterotypic cell-cell adhesion | 15/2311 | 61/18723 | 6.23e-03 | 3.53e-02 | 15 |
| GO:003461220 | Esophagus | ESCC | response to tumor necrosis factor | 149/8552 | 253/18723 | 1.47e-05 | 1.33e-04 | 149 |
| GO:007135620 | Esophagus | ESCC | cellular response to tumor necrosis factor | 132/8552 | 229/18723 | 1.69e-04 | 1.11e-03 | 132 |
| GO:00343418 | Esophagus | ESCC | response to interferon-gamma | 86/8552 | 141/18723 | 1.74e-04 | 1.14e-03 | 86 |
| GO:000181916 | Esophagus | ESCC | positive regulation of cytokine production | 244/8552 | 467/18723 | 2.29e-03 | 1.01e-02 | 244 |
| GO:00713466 | Esophagus | ESCC | cellular response to interferon-gamma | 69/8552 | 118/18723 | 3.44e-03 | 1.41e-02 | 69 |
| GO:00341135 | Esophagus | ESCC | heterotypic cell-cell adhesion | 37/8552 | 61/18723 | 1.32e-02 | 4.31e-02 | 37 |
| GO:00343413 | Liver | Cirrhotic | response to interferon-gamma | 60/4634 | 141/18723 | 2.57e-06 | 4.63e-05 | 60 |
| GO:0071346 | Liver | Cirrhotic | cellular response to interferon-gamma | 49/4634 | 118/18723 | 4.43e-05 | 5.22e-04 | 49 |
| GO:00346126 | Liver | Cirrhotic | response to tumor necrosis factor | 89/4634 | 253/18723 | 1.24e-04 | 1.22e-03 | 89 |
| GO:00713566 | Liver | Cirrhotic | cellular response to tumor necrosis factor | 79/4634 | 229/18723 | 5.68e-04 | 4.45e-03 | 79 |
| GO:00341132 | Liver | Cirrhotic | heterotypic cell-cell adhesion | 25/4634 | 61/18723 | 3.80e-03 | 2.08e-02 | 25 |
| GO:00343411 | Liver | HCC | response to interferon-gamma | 82/7958 | 141/18723 | 1.25e-04 | 1.03e-03 | 82 |
| GO:00713461 | Liver | HCC | cellular response to interferon-gamma | 70/7958 | 118/18723 | 1.66e-04 | 1.32e-03 | 70 |
| GO:003461211 | Liver | HCC | response to tumor necrosis factor | 132/7958 | 253/18723 | 1.14e-03 | 6.48e-03 | 132 |
| Page: 1 2 |
| Pathway ID | Tissue | Disease Stage | Description | Gene Ratio | Bg Ratio | pvalue | p.adjust | qvalue | Count |
| hsa0516920 | Cervix | CC | Epstein-Barr virus infection | 57/1267 | 202/8465 | 7.30e-07 | 7.39e-06 | 4.37e-06 | 57 |
| hsa045147 | Cervix | CC | Cell adhesion molecules | 36/1267 | 157/8465 | 4.94e-03 | 1.67e-02 | 9.86e-03 | 36 |
| hsa05169110 | Cervix | CC | Epstein-Barr virus infection | 57/1267 | 202/8465 | 7.30e-07 | 7.39e-06 | 4.37e-06 | 57 |
| hsa0451412 | Cervix | CC | Cell adhesion molecules | 36/1267 | 157/8465 | 4.94e-03 | 1.67e-02 | 9.86e-03 | 36 |
| hsa05169210 | Esophagus | ESCC | Epstein-Barr virus infection | 151/4205 | 202/8465 | 1.55e-13 | 3.45e-12 | 1.77e-12 | 151 |
| hsa0516937 | Esophagus | ESCC | Epstein-Barr virus infection | 151/4205 | 202/8465 | 1.55e-13 | 3.45e-12 | 1.77e-12 | 151 |
| hsa0516914 | Liver | Cirrhotic | Epstein-Barr virus infection | 80/2530 | 202/8465 | 1.80e-03 | 8.33e-03 | 5.13e-03 | 80 |
| hsa0516915 | Liver | Cirrhotic | Epstein-Barr virus infection | 80/2530 | 202/8465 | 1.80e-03 | 8.33e-03 | 5.13e-03 | 80 |
| hsa0516921 | Liver | HCC | Epstein-Barr virus infection | 128/4020 | 202/8465 | 3.17e-06 | 2.79e-05 | 1.55e-05 | 128 |
| hsa0516931 | Liver | HCC | Epstein-Barr virus infection | 128/4020 | 202/8465 | 3.17e-06 | 2.79e-05 | 1.55e-05 | 128 |
| hsa0516928 | Oral cavity | OSCC | Epstein-Barr virus infection | 144/3704 | 202/8465 | 1.08e-15 | 3.60e-14 | 1.83e-14 | 144 |
| hsa05169113 | Oral cavity | OSCC | Epstein-Barr virus infection | 144/3704 | 202/8465 | 1.08e-15 | 3.60e-14 | 1.83e-14 | 144 |
| hsa0516929 | Oral cavity | LP | Epstein-Barr virus infection | 106/2418 | 202/8465 | 4.30e-13 | 9.54e-12 | 6.15e-12 | 106 |
| hsa0516936 | Oral cavity | LP | Epstein-Barr virus infection | 106/2418 | 202/8465 | 4.30e-13 | 9.54e-12 | 6.15e-12 | 106 |
| Page: 1 |
Top |
Cell-cell communication analysis |
| Identification of potential cell-cell interactions between two cell types and their ligand-receptor pairs for different disease states |
| Ligand | Receptor | LRpair | Pathway | Tissue | Disease Stage |
| Page: 1 |
Top |
Single-cell gene regulatory network inference analysis |
| Find out the significant the regulons (TFs) and the target genes of each regulon across cell types for different disease states |
| TF | Cell Type | Tissue | Disease Stage | Target Gene | RSS | Regulon Activity |
| ∗The dot plots of a searched regulon are shown for all cell subpopulations in each disease state of each tissue based on the regulon specific score inferred using pySCENIC and by calculating the average expression. |
| Page: 1 |
Top |
Somatic mutation of malignant transformation related genes |
| Annotation of somatic variants for genes involved in malignant transformation |
| Hugo Symbol | Variant Class | Variant Classification | dbSNP RS | HGVSc | HGVSp | HGVSp Short | SWISSPROT | BIOTYPE | SIFT | PolyPhen | Tumor Sample Barcode | Tissue | Histology | Sex | Age | Stage | Therapy Types | Drugs | Outcome |
| CD58 | SNV | Missense_Mutation | rs757111380 | c.596N>T | p.Ser199Leu | p.S199L | P19256 | protein_coding | tolerated(0.11) | benign(0.043) | TCGA-E2-A1IN-01 | Breast | breast invasive carcinoma | Female | <65 | I/II | Hormone Therapy | arimidex | SD |
| CD58 | deletion | Frame_Shift_Del | novel | c.436delG | p.Glu146SerfsTer10 | p.E146Sfs*10 | P19256 | protein_coding | TCGA-EW-A2FV-01 | Breast | breast invasive carcinoma | Female | <65 | III/IV | Chemotherapy | docetaxel | SD | ||
| CD58 | SNV | Missense_Mutation | c.502C>G | p.Arg168Gly | p.R168G | P19256 | protein_coding | tolerated(0.58) | benign(0) | TCGA-DS-A1OC-01 | Cervix | cervical & endocervical cancer | Female | <65 | I/II | Chemotherapy | gemcitabine | SD | |
| CD58 | SNV | Missense_Mutation | c.193G>C | p.Glu65Gln | p.E65Q | P19256 | protein_coding | deleterious(0.01) | probably_damaging(0.995) | TCGA-IR-A3LL-01 | Cervix | cervical & endocervical cancer | Female | <65 | I/II | Chemotherapy | cisplatin | CR | |
| CD58 | SNV | Missense_Mutation | c.308A>G | p.Tyr103Cys | p.Y103C | P19256 | protein_coding | deleterious(0) | probably_damaging(1) | TCGA-A6-5665-01 | Colorectum | colon adenocarcinoma | Female | >=65 | I/II | Unknown | Unknown | PD | |
| CD58 | SNV | Missense_Mutation | rs752587623 | c.99N>G | p.Ile33Met | p.I33M | P19256 | protein_coding | tolerated(0.18) | possibly_damaging(0.64) | TCGA-AA-A010-01 | Colorectum | colon adenocarcinoma | Female | <65 | I/II | Chemotherapy | folinic | CR |
| CD58 | SNV | Missense_Mutation | c.179A>C | p.Lys60Thr | p.K60T | P19256 | protein_coding | tolerated(0.06) | probably_damaging(0.971) | TCGA-AZ-4315-01 | Colorectum | colon adenocarcinoma | Male | <65 | I/II | Unknown | Unknown | SD | |
| CD58 | SNV | Missense_Mutation | c.326N>C | p.Asn109Thr | p.N109T | P19256 | protein_coding | tolerated(0.15) | benign(0.153) | TCGA-CA-6717-01 | Colorectum | colon adenocarcinoma | Male | <65 | I/II | Chemotherapy | oxaliplatin | CR | |
| CD58 | SNV | Missense_Mutation | c.222N>G | p.Phe74Leu | p.F74L | P19256 | protein_coding | deleterious(0.01) | possibly_damaging(0.823) | TCGA-G4-6625-01 | Colorectum | colon adenocarcinoma | Female | >=65 | I/II | Unknown | Unknown | PD | |
| CD58 | SNV | Missense_Mutation | novel | c.676A>C | p.Ile226Leu | p.I226L | P19256 | protein_coding | tolerated(0.06) | benign(0.086) | TCGA-AG-A002-01 | Colorectum | rectum adenocarcinoma | Male | <65 | I/II | Unknown | Unknown | SD |
| Page: 1 2 3 |
Top |
Related drugs of malignant transformation related genes |
| Identification of chemicals and drugs interact with genes involved in malignant transfromation |
| (DGIdb 4.0) |
| Entrez ID | Symbol | Category | Interaction Types | Drug Claim Name | Drug Name | PMIDs |
| 965 | CD58 | CLINICALLY ACTIONABLE, DRUGGABLE GENOME, CELL SURFACE | ALBUMIN | ALBUMIN HUMAN | 8697653 | |
| 965 | CD58 | CLINICALLY ACTIONABLE, DRUGGABLE GENOME, CELL SURFACE | Alefacept | ALEFACEPT | ||
| 965 | CD58 | CLINICALLY ACTIONABLE, DRUGGABLE GENOME, CELL SURFACE | interferon beta-1b | |||
| 965 | CD58 | CLINICALLY ACTIONABLE, DRUGGABLE GENOME, CELL SURFACE | interferon beta-1a |
| Page: 1 |

Copyright 2023-Present -The University of Texas Health Science Center at Houston |