
|
|||||
|
 | |
| |
| |
| |
| |
| |
|
Gene: CD55 |
Gene summary for CD55 |
| Gene information | Species | Human | Gene symbol | CD55 | Gene ID | 1604 |
| Gene name | CD55 molecule (Cromer blood group) | |
| Gene Alias | CHAPLE | |
| Cytomap | 1q32.2 | |
| Gene Type | protein-coding | GO ID | GO:0001775 | UniProtAcc | P08174 |
Top |
Malignant transformation analysis |
| Identification of the aberrant gene expression in precancerous and cancerous lesions by comparing the gene expression of stem-like cells in diseased tissues with normal stem cells |
| Entrez ID | Symbol | Replicates | Species | Organ | Tissue | Adj P-value | Log2FC | Malignancy |
| 1604 | CD55 | CA_HPV_1 | Human | Cervix | CC | 7.14e-04 | -2.33e-01 | 0.0264 |
| 1604 | CD55 | N_HPV_2 | Human | Cervix | N_HPV | 3.11e-02 | 2.89e-01 | -0.0131 |
| 1604 | CD55 | H2 | Human | Cervix | HSIL_HPV | 1.74e-08 | 4.29e-01 | 0.0632 |
| 1604 | CD55 | L1 | Human | Cervix | CC | 3.04e-06 | -3.93e-01 | 0.0802 |
| 1604 | CD55 | T2 | Human | Cervix | CC | 2.37e-17 | 9.46e-01 | 0.0709 |
| 1604 | CD55 | AEH-subject1 | Human | Endometrium | AEH | 9.18e-06 | 4.01e-01 | -0.3059 |
| 1604 | CD55 | AEH-subject2 | Human | Endometrium | AEH | 2.11e-02 | 2.11e-01 | -0.2525 |
| 1604 | CD55 | AEH-subject4 | Human | Endometrium | AEH | 4.07e-06 | 3.90e-01 | -0.2657 |
| 1604 | CD55 | AEH-subject5 | Human | Endometrium | AEH | 4.18e-18 | 6.47e-01 | -0.2953 |
| 1604 | CD55 | EEC-subject3 | Human | Endometrium | EEC | 5.85e-10 | 3.78e-01 | -0.2525 |
| 1604 | CD55 | EEC-subject4 | Human | Endometrium | EEC | 1.37e-06 | 3.64e-01 | -0.2571 |
| 1604 | CD55 | GSM5276934 | Human | Endometrium | EEC | 9.58e-07 | 3.87e-01 | -0.0913 |
| 1604 | CD55 | GSM6177620_NYU_UCEC1_lib1_lib1 | Human | Endometrium | EEC | 3.48e-07 | -3.37e-01 | -0.1869 |
| 1604 | CD55 | GSM6177620_NYU_UCEC1_lib2_lib2 | Human | Endometrium | EEC | 2.98e-08 | -2.73e-01 | -0.1875 |
| 1604 | CD55 | GSM6177620_NYU_UCEC1_lib3_lib3 | Human | Endometrium | EEC | 3.29e-07 | -3.10e-01 | -0.1883 |
| 1604 | CD55 | GSM6177621_NYU_UCEC2_lib1_lib1 | Human | Endometrium | EEC | 6.23e-04 | -1.37e-01 | -0.1934 |
| 1604 | CD55 | GSM6177622_NYU_UCEC3_lib1_lib1 | Human | Endometrium | EEC | 2.73e-15 | 7.71e-02 | -0.1917 |
| 1604 | CD55 | GSM6177622_NYU_UCEC3_lib2_lib2 | Human | Endometrium | EEC | 2.84e-15 | 1.05e-01 | -0.1916 |
| 1604 | CD55 | LZE5T | Human | Esophagus | ESCC | 3.41e-10 | 1.73e+00 | 0.0514 |
| 1604 | CD55 | LZE21D1 | Human | Esophagus | HGIN | 1.51e-03 | -3.54e-01 | 0.0632 |
| Page: 1 2 3 4 5 6 7 8 9 |
| Tissue | Expression Dynamics | Abbreviation |
| Cervix |  | CC: Cervix cancer |
| HSIL_HPV: HPV-infected high-grade squamous intraepithelial lesions | ||
| N_HPV: HPV-infected normal cervix | ||
| Endometrium |  | AEH: Atypical endometrial hyperplasia |
| EEC: Endometrioid Cancer | ||
| Esophagus | 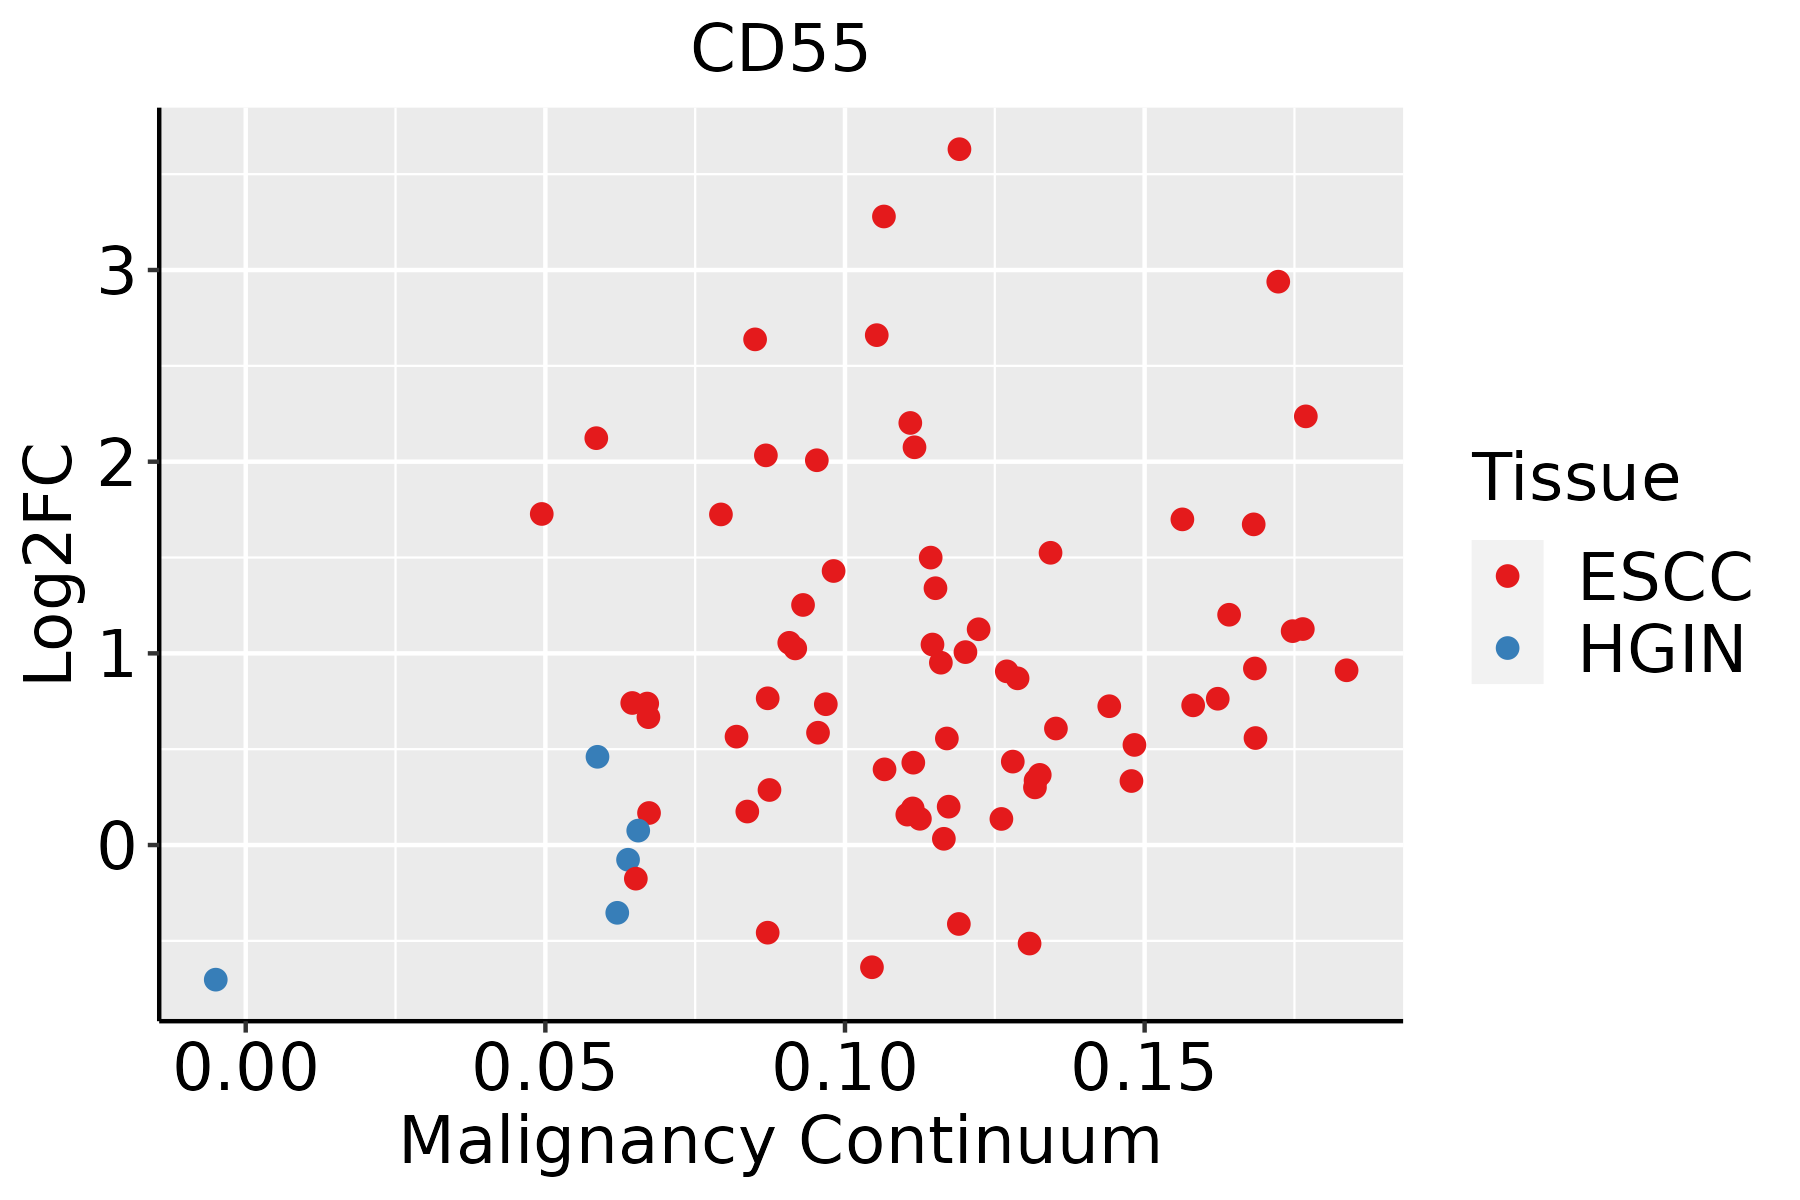 | ESCC: Esophageal squamous cell carcinoma |
| HGIN: High-grade intraepithelial neoplasias | ||
| LGIN: Low-grade intraepithelial neoplasias | ||
| GC |  | CAG: Chronic atrophic gastritis |
| CAG with IM: Chronic atrophic gastritis with intestinal metaplasia | ||
| CSG: Chronic superficial gastritis | ||
| GC: Gastric cancer | ||
| SIM: Severe intestinal metaplasia | ||
| WIM: Wild intestinal metaplasia | ||
| Lung |  | AAH: Atypical adenomatous hyperplasia |
| AIS: Adenocarcinoma in situ | ||
| IAC: Invasive lung adenocarcinoma | ||
| MIA: Minimally invasive adenocarcinoma | ||
| Oral Cavity | 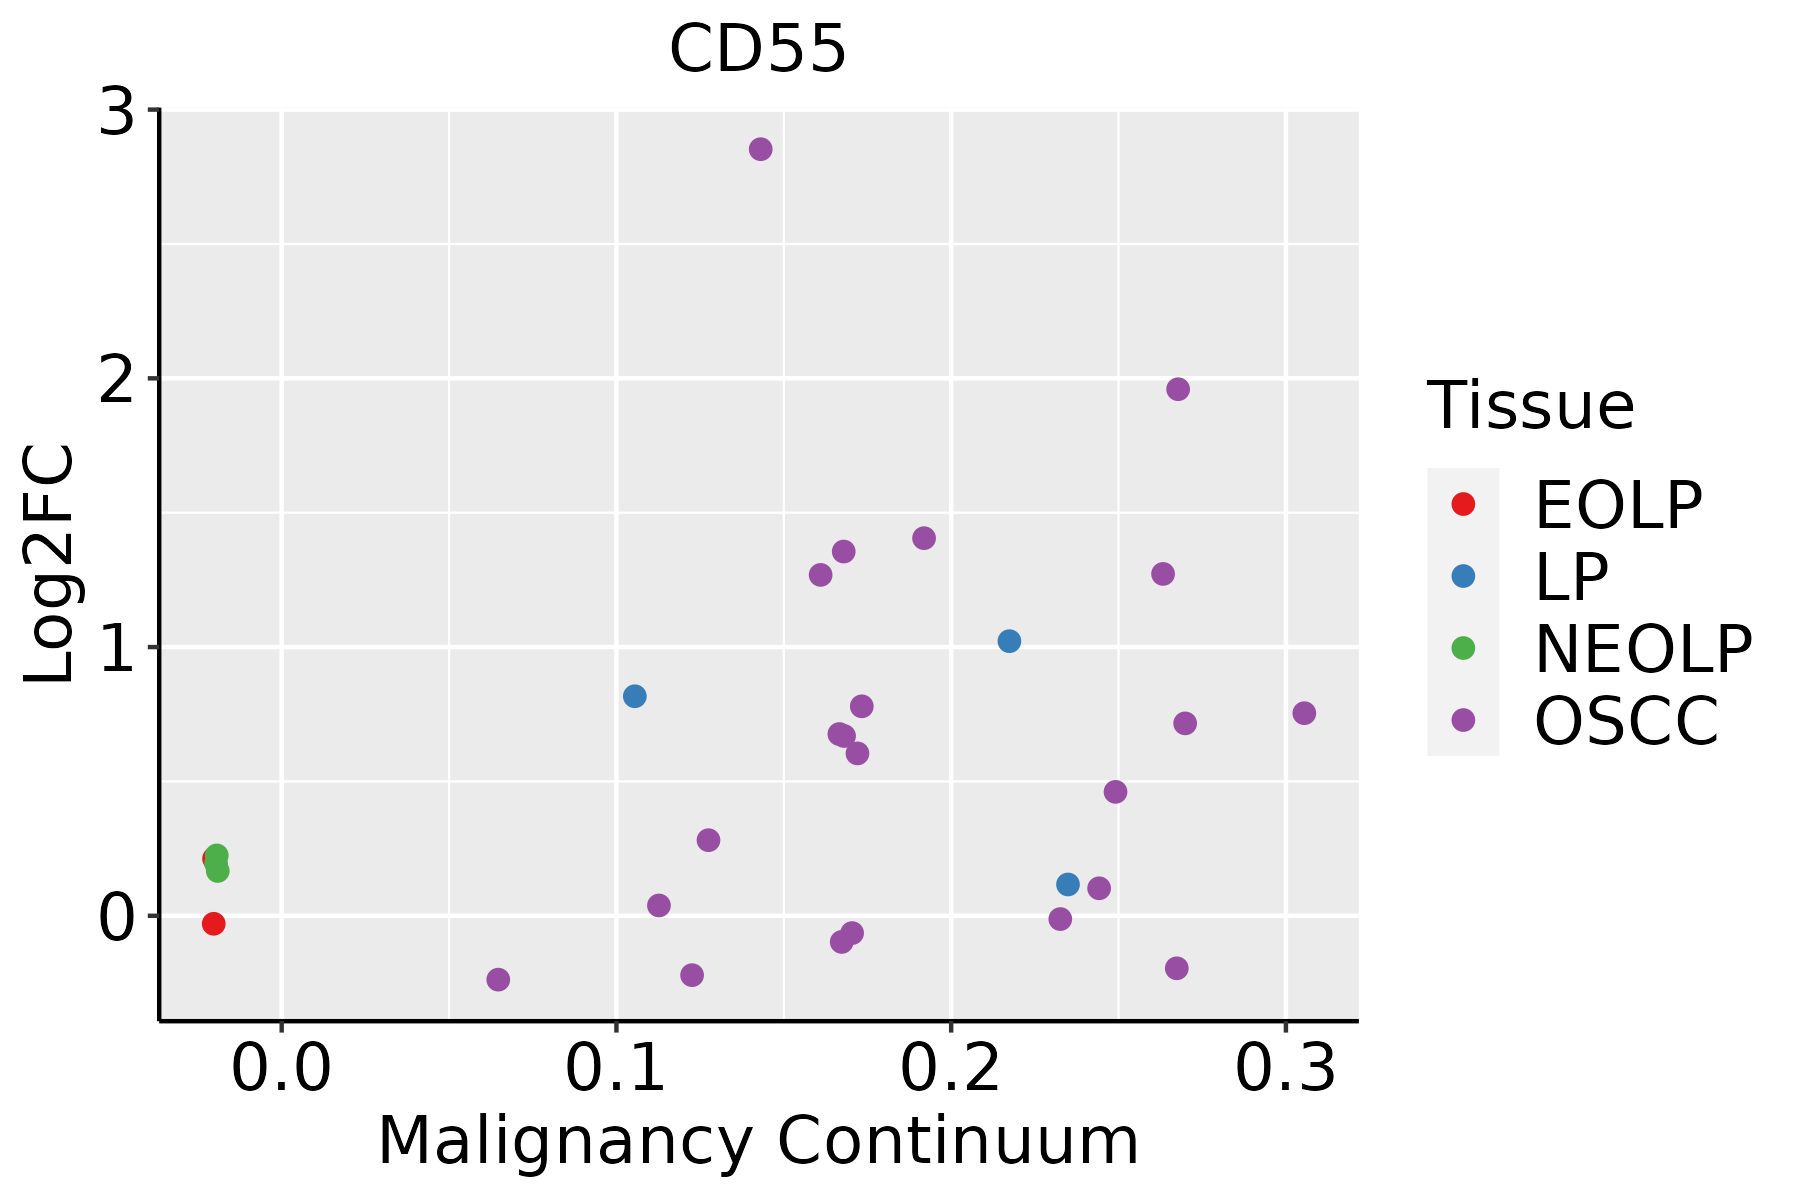 | EOLP: Erosive Oral lichen planus |
| LP: leukoplakia | ||
| NEOLP: Non-erosive oral lichen planus | ||
| OSCC: Oral squamous cell carcinoma | ||
| Prostate | 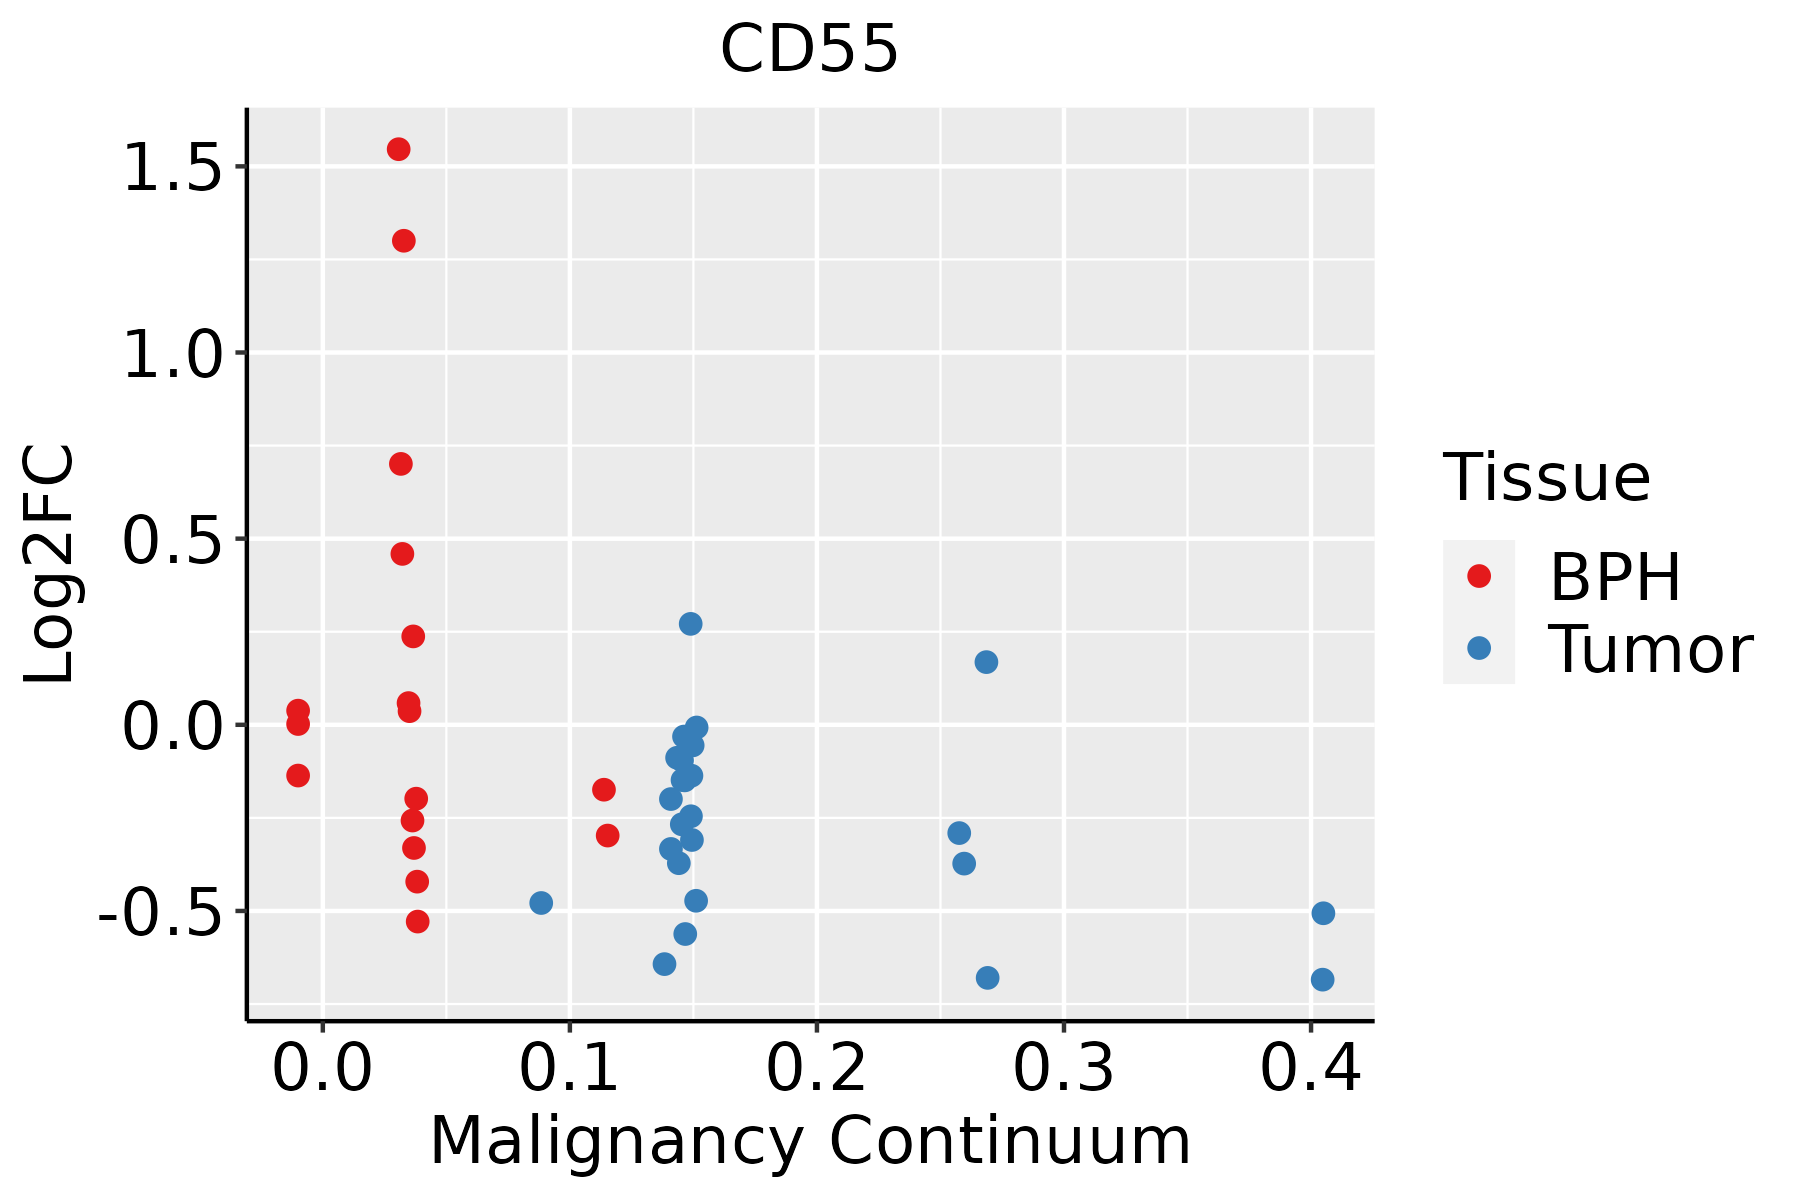 | BPH: Benign Prostatic Hyperplasia |
| Skin |  | AK: Actinic keratosis |
| cSCC: Cutaneous squamous cell carcinoma | ||
| SCCIS:squamous cell carcinoma in situ | ||
| Thyroid | 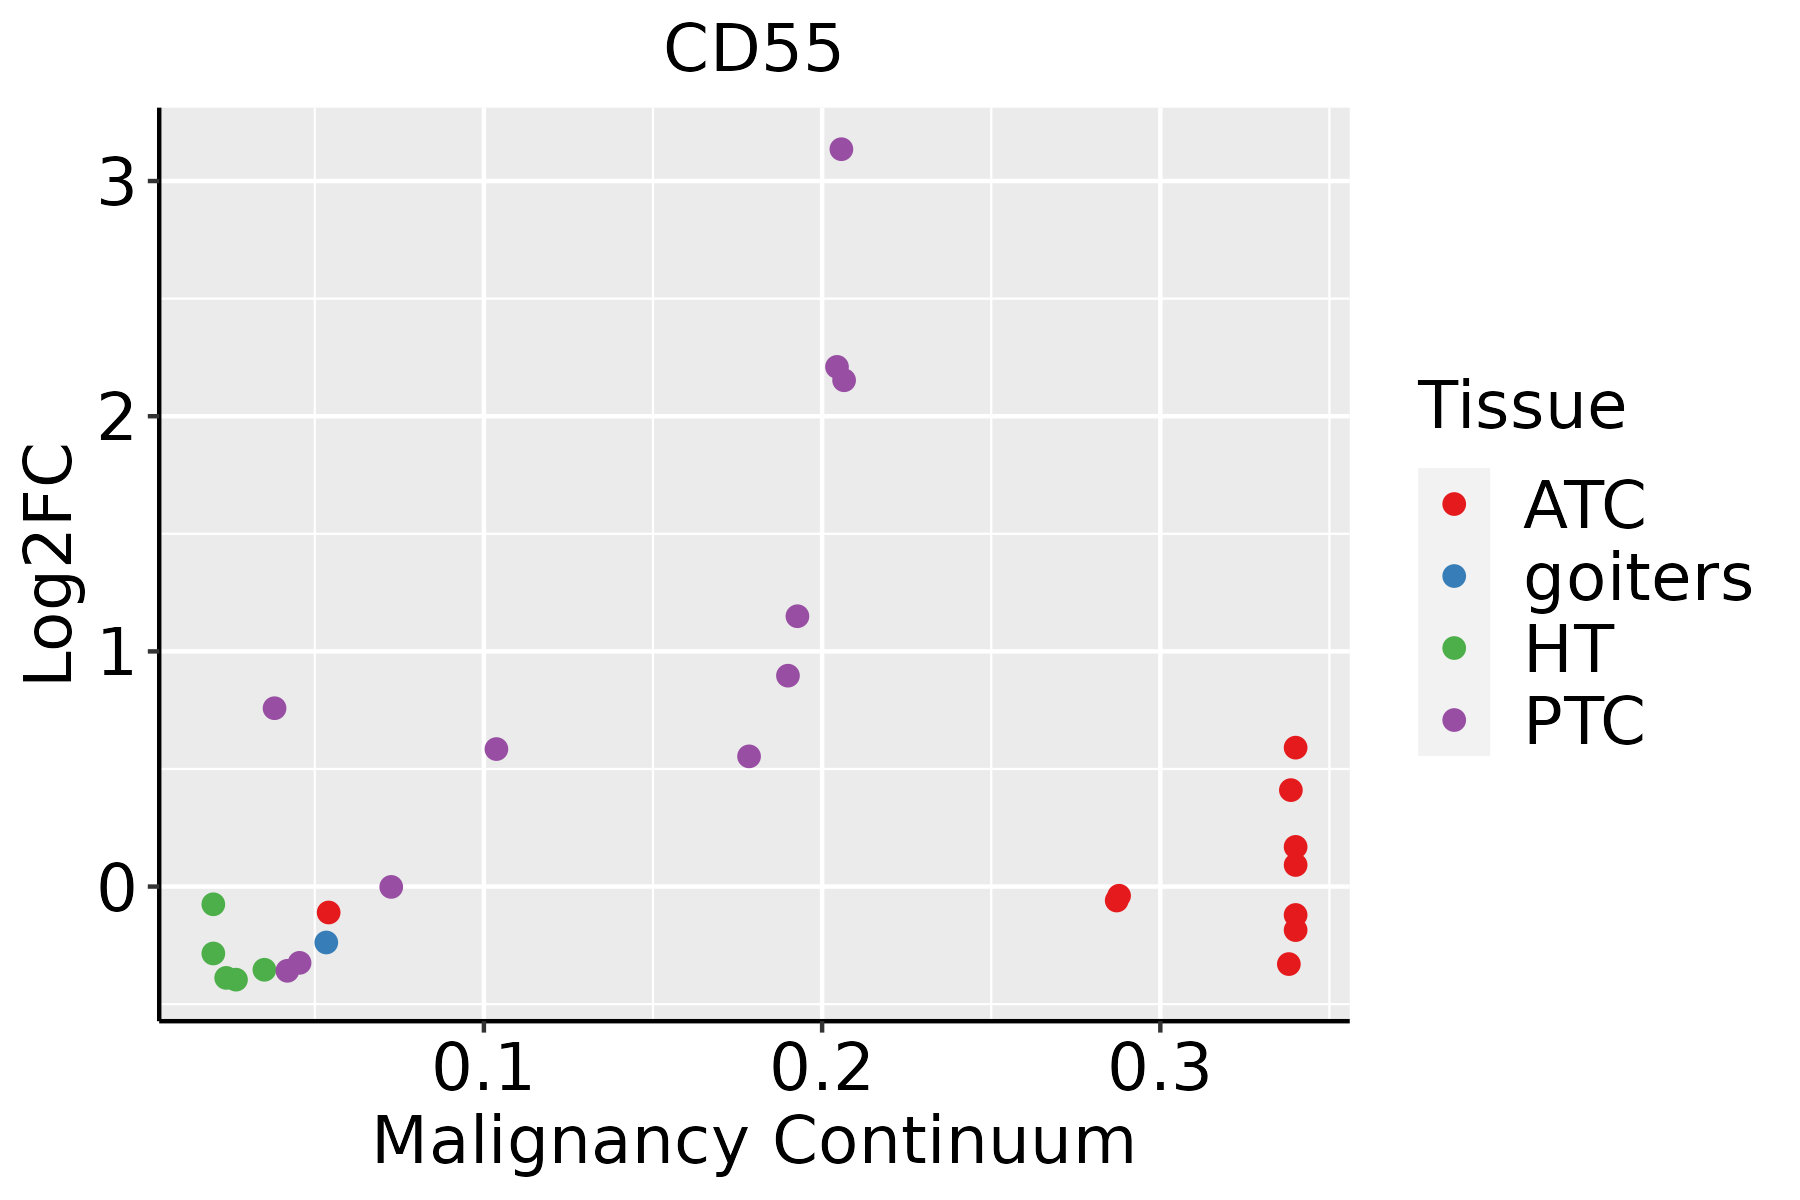 | ATC: Anaplastic thyroid cancer |
| HT: Hashimoto's thyroiditis | ||
| PTC: Papillary thyroid cancer |
| ∗log2FC in expression of this searched gene in stem-like cells from each diseased tissue sample relative to stem-like cells in normal samples in each tissue plotted against the malignancy continuum. Samples are colored based on if they are from different disease stage. |
Top |
Malignant transformation related pathway analysis |
| Find out the enriched GO biological processes and KEGG pathways involved in transition from healthy to precancer to cancer |
| Tissue | Disease Stage | Enriched GO biological Processes |
| Colorectum | AD |  |
| Colorectum | SER |  |
| Colorectum | MSS |  |
| Colorectum | MSI-H |  |
| Colorectum | FAP |  |
| ∗Top 15 enriched GO BP terms are showed in the bar plot of each disease state in each tissue. Each row represents a significant GO biological process which is colored according to the -log10(p.adjust). |
| Page: 1 2 3 4 5 6 7 8 9 |
| GO ID | Tissue | Disease Stage | Description | Gene Ratio | Bg Ratio | pvalue | p.adjust | Count |
| GO:001603210 | Cervix | CC | viral process | 109/2311 | 415/18723 | 5.40e-15 | 6.46e-12 | 109 |
| GO:001905810 | Cervix | CC | viral life cycle | 87/2311 | 317/18723 | 2.20e-13 | 1.20e-10 | 87 |
| GO:002240710 | Cervix | CC | regulation of cell-cell adhesion | 103/2311 | 448/18723 | 1.78e-10 | 2.87e-08 | 103 |
| GO:004578510 | Cervix | CC | positive regulation of cell adhesion | 101/2311 | 437/18723 | 1.96e-10 | 3.08e-08 | 101 |
| GO:005212610 | Cervix | CC | movement in host environment | 52/2311 | 175/18723 | 7.03e-10 | 8.76e-08 | 52 |
| GO:004440910 | Cervix | CC | entry into host | 47/2311 | 151/18723 | 8.45e-10 | 1.03e-07 | 47 |
| GO:005170110 | Cervix | CC | biological process involved in interaction with host | 57/2311 | 203/18723 | 1.18e-09 | 1.41e-07 | 57 |
| GO:00421108 | Cervix | CC | T cell activation | 107/2311 | 487/18723 | 1.24e-09 | 1.46e-07 | 107 |
| GO:00508638 | Cervix | CC | regulation of T cell activation | 80/2311 | 329/18723 | 1.28e-09 | 1.47e-07 | 80 |
| GO:004671810 | Cervix | CC | viral entry into host cell | 44/2311 | 144/18723 | 5.47e-09 | 5.03e-07 | 44 |
| GO:004440310 | Cervix | CC | biological process involved in symbiotic interaction | 71/2311 | 290/18723 | 7.94e-09 | 6.98e-07 | 71 |
| GO:00071598 | Cervix | CC | leukocyte cell-cell adhesion | 85/2311 | 371/18723 | 8.27e-09 | 7.07e-07 | 85 |
| GO:00026837 | Cervix | CC | negative regulation of immune system process | 94/2311 | 434/18723 | 2.63e-08 | 1.87e-06 | 94 |
| GO:19030378 | Cervix | CC | regulation of leukocyte cell-cell adhesion | 77/2311 | 336/18723 | 4.08e-08 | 2.54e-06 | 77 |
| GO:00018197 | Cervix | CC | positive regulation of cytokine production | 95/2311 | 467/18723 | 4.88e-07 | 1.85e-05 | 95 |
| GO:00022379 | Cervix | CC | response to molecule of bacterial origin | 78/2311 | 363/18723 | 5.55e-07 | 2.06e-05 | 78 |
| GO:00324969 | Cervix | CC | response to lipopolysaccharide | 74/2311 | 343/18723 | 9.15e-07 | 3.25e-05 | 74 |
| GO:00420988 | Cervix | CC | T cell proliferation | 49/2311 | 199/18723 | 1.32e-06 | 4.49e-05 | 49 |
| GO:00421297 | Cervix | CC | regulation of T cell proliferation | 43/2311 | 171/18723 | 3.21e-06 | 8.77e-05 | 43 |
| GO:00706637 | Cervix | CC | regulation of leukocyte proliferation | 55/2311 | 245/18723 | 6.51e-06 | 1.56e-04 | 55 |
| Page: 1 2 3 4 5 6 7 8 9 10 11 12 13 14 15 16 17 18 19 20 21 22 23 24 25 26 27 28 29 30 31 32 33 34 35 36 37 38 39 40 41 42 43 |
| Pathway ID | Tissue | Disease Stage | Description | Gene Ratio | Bg Ratio | pvalue | p.adjust | qvalue | Count |
| hsa0541620 | Cervix | CC | Viral myocarditis | 27/1267 | 60/8465 | 2.43e-08 | 3.57e-07 | 2.11e-07 | 27 |
| hsa05416110 | Cervix | CC | Viral myocarditis | 27/1267 | 60/8465 | 2.43e-08 | 3.57e-07 | 2.11e-07 | 27 |
| hsa0541624 | Cervix | HSIL_HPV | Viral myocarditis | 14/459 | 60/8465 | 2.70e-06 | 4.95e-05 | 4.00e-05 | 14 |
| hsa04640 | Cervix | HSIL_HPV | Hematopoietic cell lineage | 18/459 | 99/8465 | 4.97e-06 | 8.10e-05 | 6.54e-05 | 18 |
| hsa0541634 | Cervix | HSIL_HPV | Viral myocarditis | 14/459 | 60/8465 | 2.70e-06 | 4.95e-05 | 4.00e-05 | 14 |
| hsa046401 | Cervix | HSIL_HPV | Hematopoietic cell lineage | 18/459 | 99/8465 | 4.97e-06 | 8.10e-05 | 6.54e-05 | 18 |
| hsa0541643 | Cervix | N_HPV | Viral myocarditis | 14/349 | 60/8465 | 9.77e-08 | 1.90e-06 | 1.48e-06 | 14 |
| hsa046402 | Cervix | N_HPV | Hematopoietic cell lineage | 13/349 | 99/8465 | 1.98e-04 | 1.74e-03 | 1.36e-03 | 13 |
| hsa0541653 | Cervix | N_HPV | Viral myocarditis | 14/349 | 60/8465 | 9.77e-08 | 1.90e-06 | 1.48e-06 | 14 |
| hsa046403 | Cervix | N_HPV | Hematopoietic cell lineage | 13/349 | 99/8465 | 1.98e-04 | 1.74e-03 | 1.36e-03 | 13 |
| hsa0541625 | Endometrium | AEH | Viral myocarditis | 27/1197 | 60/8465 | 6.98e-09 | 1.13e-07 | 8.30e-08 | 27 |
| hsa05416111 | Endometrium | AEH | Viral myocarditis | 27/1197 | 60/8465 | 6.98e-09 | 1.13e-07 | 8.30e-08 | 27 |
| hsa0541626 | Endometrium | EEC | Viral myocarditis | 28/1237 | 60/8465 | 2.81e-09 | 5.77e-08 | 4.30e-08 | 28 |
| hsa0541635 | Endometrium | EEC | Viral myocarditis | 28/1237 | 60/8465 | 2.81e-09 | 5.77e-08 | 4.30e-08 | 28 |
| hsa0541630 | Esophagus | ESCC | Viral myocarditis | 41/4205 | 60/8465 | 2.59e-03 | 7.05e-03 | 3.61e-03 | 41 |
| hsa05416114 | Esophagus | ESCC | Viral myocarditis | 41/4205 | 60/8465 | 2.59e-03 | 7.05e-03 | 3.61e-03 | 41 |
| hsa0541616 | Lung | IAC | Viral myocarditis | 21/1053 | 60/8465 | 5.30e-06 | 1.57e-04 | 1.04e-04 | 21 |
| hsa0541617 | Lung | IAC | Viral myocarditis | 21/1053 | 60/8465 | 5.30e-06 | 1.57e-04 | 1.04e-04 | 21 |
| hsa0541622 | Lung | AIS | Viral myocarditis | 19/961 | 60/8465 | 2.01e-05 | 4.08e-04 | 2.61e-04 | 19 |
| hsa0541632 | Lung | AIS | Viral myocarditis | 19/961 | 60/8465 | 2.01e-05 | 4.08e-04 | 2.61e-04 | 19 |
| Page: 1 2 3 |
Top |
Cell-cell communication analysis |
| Identification of potential cell-cell interactions between two cell types and their ligand-receptor pairs for different disease states |
| Ligand | Receptor | LRpair | Pathway | Tissue | Disease Stage |
| ADGRE5 | CD55 | ADGRE5_CD55 | ADGRE5 | Breast | ADJ |
| ADGRE5 | CD55 | ADGRE5_CD55 | ADGRE5 | Breast | DCIS |
| ADGRE5 | CD55 | ADGRE5_CD55 | ADGRE5 | Breast | Healthy |
| ADGRE5 | CD55 | ADGRE5_CD55 | ADGRE5 | Breast | IDC |
| ADGRE5 | CD55 | ADGRE5_CD55 | ADGRE5 | Cervix | ADJ |
| ADGRE5 | CD55 | ADGRE5_CD55 | ADGRE5 | Cervix | CC |
| ADGRE5 | CD55 | ADGRE5_CD55 | ADGRE5 | Cervix | Healthy |
| ADGRE5 | CD55 | ADGRE5_CD55 | ADGRE5 | CRC | Healthy |
| ADGRE5 | CD55 | ADGRE5_CD55 | ADGRE5 | CRC | MSI-H |
| ADGRE5 | CD55 | ADGRE5_CD55 | ADGRE5 | CRC | MSS |
| ADGRE5 | CD55 | ADGRE5_CD55 | ADGRE5 | Endometrium | ADJ |
| ADGRE5 | CD55 | ADGRE5_CD55 | ADGRE5 | Endometrium | AEH |
| ADGRE5 | CD55 | ADGRE5_CD55 | ADGRE5 | Endometrium | EEC |
| ADGRE5 | CD55 | ADGRE5_CD55 | ADGRE5 | Endometrium | Healthy |
| ADGRE5 | CD55 | ADGRE5_CD55 | ADGRE5 | Esophagus | ESCC |
| ADGRE5 | CD55 | ADGRE5_CD55 | ADGRE5 | GC | ADJ |
| ADGRE5 | CD55 | ADGRE5_CD55 | ADGRE5 | GC | GC |
| ADGRE5 | CD55 | ADGRE5_CD55 | ADGRE5 | GC | Precancer |
| ADGRE5 | CD55 | ADGRE5_CD55 | ADGRE5 | HNSCC | ADJ |
| ADGRE5 | CD55 | ADGRE5_CD55 | ADGRE5 | HNSCC | Healthy |
| Page: 1 |
Top |
Single-cell gene regulatory network inference analysis |
| Find out the significant the regulons (TFs) and the target genes of each regulon across cell types for different disease states |
| TF | Cell Type | Tissue | Disease Stage | Target Gene | RSS | Regulon Activity |
| ∗The dot plots of a searched regulon are shown for all cell subpopulations in each disease state of each tissue based on the regulon specific score inferred using pySCENIC and by calculating the average expression. |
| Page: 1 |
Top |
Somatic mutation of malignant transformation related genes |
| Annotation of somatic variants for genes involved in malignant transformation |
| Hugo Symbol | Variant Class | Variant Classification | dbSNP RS | HGVSc | HGVSp | HGVSp Short | SWISSPROT | BIOTYPE | SIFT | PolyPhen | Tumor Sample Barcode | Tissue | Histology | Sex | Age | Stage | Therapy Types | Drugs | Outcome |
| CD55 | SNV | Missense_Mutation | rs752481959 | c.509N>A | p.Arg170Gln | p.R170Q | protein_coding | tolerated(0.55) | benign(0.072) | TCGA-E2-A152-01 | Breast | breast invasive carcinoma | Female | <65 | I/II | Targeted Molecular therapy | trastuzumab | PD | |
| CD55 | SNV | Missense_Mutation | novel | c.929N>T | p.Ser310Leu | p.S310L | protein_coding | tolerated(0.35) | benign(0.006) | TCGA-E9-A2JT-01 | Breast | breast invasive carcinoma | Female | <65 | I/II | Hormone Therapy | tamoxiphen | SD | |
| CD55 | SNV | Missense_Mutation | c.940C>G | p.Gln314Glu | p.Q314E | protein_coding | deleterious(0.01) | benign(0.033) | TCGA-Q1-A73P-01 | Cervix | cervical & endocervical cancer | Female | <65 | I/II | Unknown | Unknown | SD | ||
| CD55 | SNV | Missense_Mutation | rs143471404 | c.992N>T | p.Thr331Ile | p.T331I | protein_coding | tolerated(0.17) | benign(0.035) | TCGA-AA-3713-01 | Colorectum | colon adenocarcinoma | Male | >=65 | III/IV | Chemotherapy | 5-fluorouracil | PR | |
| CD55 | SNV | Missense_Mutation | novel | c.707N>A | p.Ile236Asn | p.I236N | protein_coding | tolerated(0.05) | probably_damaging(0.999) | TCGA-AA-3877-01 | Colorectum | colon adenocarcinoma | Female | >=65 | I/II | Unknown | Unknown | SD | |
| CD55 | SNV | Missense_Mutation | c.385T>C | p.Cys129Arg | p.C129R | protein_coding | deleterious(0) | probably_damaging(1) | TCGA-AM-5821-01 | Colorectum | colon adenocarcinoma | Female | >=65 | I/II | Unknown | Unknown | SD | ||
| CD55 | SNV | Missense_Mutation | c.466G>A | p.Glu156Lys | p.E156K | protein_coding | deleterious(0.05) | possibly_damaging(0.826) | TCGA-AP-A056-01 | Endometrium | uterine corpus endometrioid carcinoma | Female | <65 | I/II | Unknown | Unknown | SD | ||
| CD55 | SNV | Missense_Mutation | rs756646491 | c.389N>A | p.Arg130His | p.R130H | protein_coding | deleterious(0.02) | probably_damaging(1) | TCGA-AP-A059-01 | Endometrium | uterine corpus endometrioid carcinoma | Female | >=65 | I/II | Unknown | Unknown | SD | |
| CD55 | SNV | Missense_Mutation | c.967N>T | p.Pro323Ser | p.P323S | protein_coding | tolerated(0.12) | benign(0.003) | TCGA-AP-A059-01 | Endometrium | uterine corpus endometrioid carcinoma | Female | >=65 | I/II | Unknown | Unknown | SD | ||
| CD55 | SNV | Missense_Mutation | c.589N>G | p.Phe197Val | p.F197V | protein_coding | tolerated(1) | benign(0.013) | TCGA-AX-A0J0-01 | Endometrium | uterine corpus endometrioid carcinoma | Female | <65 | I/II | Unknown | Unknown | SD |
| Page: 1 2 3 4 |
Top |
Related drugs of malignant transformation related genes |
| Identification of chemicals and drugs interact with genes involved in malignant transfromation |
| (DGIdb 4.0) |
| Entrez ID | Symbol | Category | Interaction Types | Drug Claim Name | Drug Name | PMIDs |
| 1604 | CD55 | DRUGGABLE GENOME, CELL SURFACE | PD-98059 | CHEMBL35482 | 11528371 | |
| 1604 | CD55 | DRUGGABLE GENOME, CELL SURFACE | PAT-SC1 | |||
| 1604 | CD55 | DRUGGABLE GENOME, CELL SURFACE | ETHANOL | ALCOHOL | 17383432 | |
| 1604 | CD55 | DRUGGABLE GENOME, CELL SURFACE | COXSACKIEVIRUS TYPE A21 | |||
| 1604 | CD55 | DRUGGABLE GENOME, CELL SURFACE | Coxsackievirus A21 | |||
| 1604 | CD55 | DRUGGABLE GENOME, CELL SURFACE | RETINOIC ACID | 15668483 | ||
| 1604 | CD55 | DRUGGABLE GENOME, CELL SURFACE | INTERLEUKIN-8 | 14723618 | ||
| 1604 | CD55 | DRUGGABLE GENOME, CELL SURFACE | ONYVAX-105 (105AD7) |
| Page: 1 |

Copyright 2023-Present -The University of Texas Health Science Center at Houston |