
|
|||||
|
 | |
| |
| |
| |
| |
| |
|
Gene: CD53 |
Gene summary for CD53 |
| Gene information | Species | Human | Gene symbol | CD53 | Gene ID | 963 |
| Gene name | CD53 molecule | |
| Gene Alias | MOX44 | |
| Cytomap | 1p13.3 | |
| Gene Type | protein-coding | GO ID | GO:0000768 | UniProtAcc | P19397 |
Top |
Malignant transformation analysis |
| Identification of the aberrant gene expression in precancerous and cancerous lesions by comparing the gene expression of stem-like cells in diseased tissues with normal stem cells |
| Entrez ID | Symbol | Replicates | Species | Organ | Tissue | Adj P-value | Log2FC | Malignancy |
| 963 | CD53 | C21 | Human | Oral cavity | OSCC | 3.94e-17 | 6.56e-01 | 0.2678 |
| 963 | CD53 | C46 | Human | Oral cavity | OSCC | 6.69e-08 | 1.09e-01 | 0.1673 |
| 963 | CD53 | C51 | Human | Oral cavity | OSCC | 8.71e-05 | 2.40e-01 | 0.2674 |
| 963 | CD53 | C57 | Human | Oral cavity | OSCC | 2.67e-08 | 1.52e-01 | 0.1679 |
| 963 | CD53 | C06 | Human | Oral cavity | OSCC | 4.00e-05 | 5.08e-01 | 0.2699 |
| 963 | CD53 | C07 | Human | Oral cavity | OSCC | 3.24e-02 | 2.75e-01 | 0.2491 |
| 963 | CD53 | C08 | Human | Oral cavity | OSCC | 6.30e-05 | 9.47e-02 | 0.1919 |
| 963 | CD53 | C09 | Human | Oral cavity | OSCC | 4.13e-04 | 1.14e-01 | 0.1431 |
| 963 | CD53 | LN22 | Human | Oral cavity | OSCC | 1.21e-08 | 9.97e-01 | 0.1733 |
| 963 | CD53 | LN38 | Human | Oral cavity | OSCC | 7.91e-03 | 3.82e-01 | 0.168 |
| 963 | CD53 | LN46 | Human | Oral cavity | OSCC | 7.40e-05 | 2.65e-01 | 0.1666 |
| 963 | CD53 | EOLP-1 | Human | Oral cavity | EOLP | 3.46e-09 | 3.36e-01 | -0.0202 |
| 963 | CD53 | EOLP-2 | Human | Oral cavity | EOLP | 5.22e-06 | 2.04e-01 | -0.0203 |
| Page: 1 |
| Tissue | Expression Dynamics | Abbreviation |
| Oral Cavity | 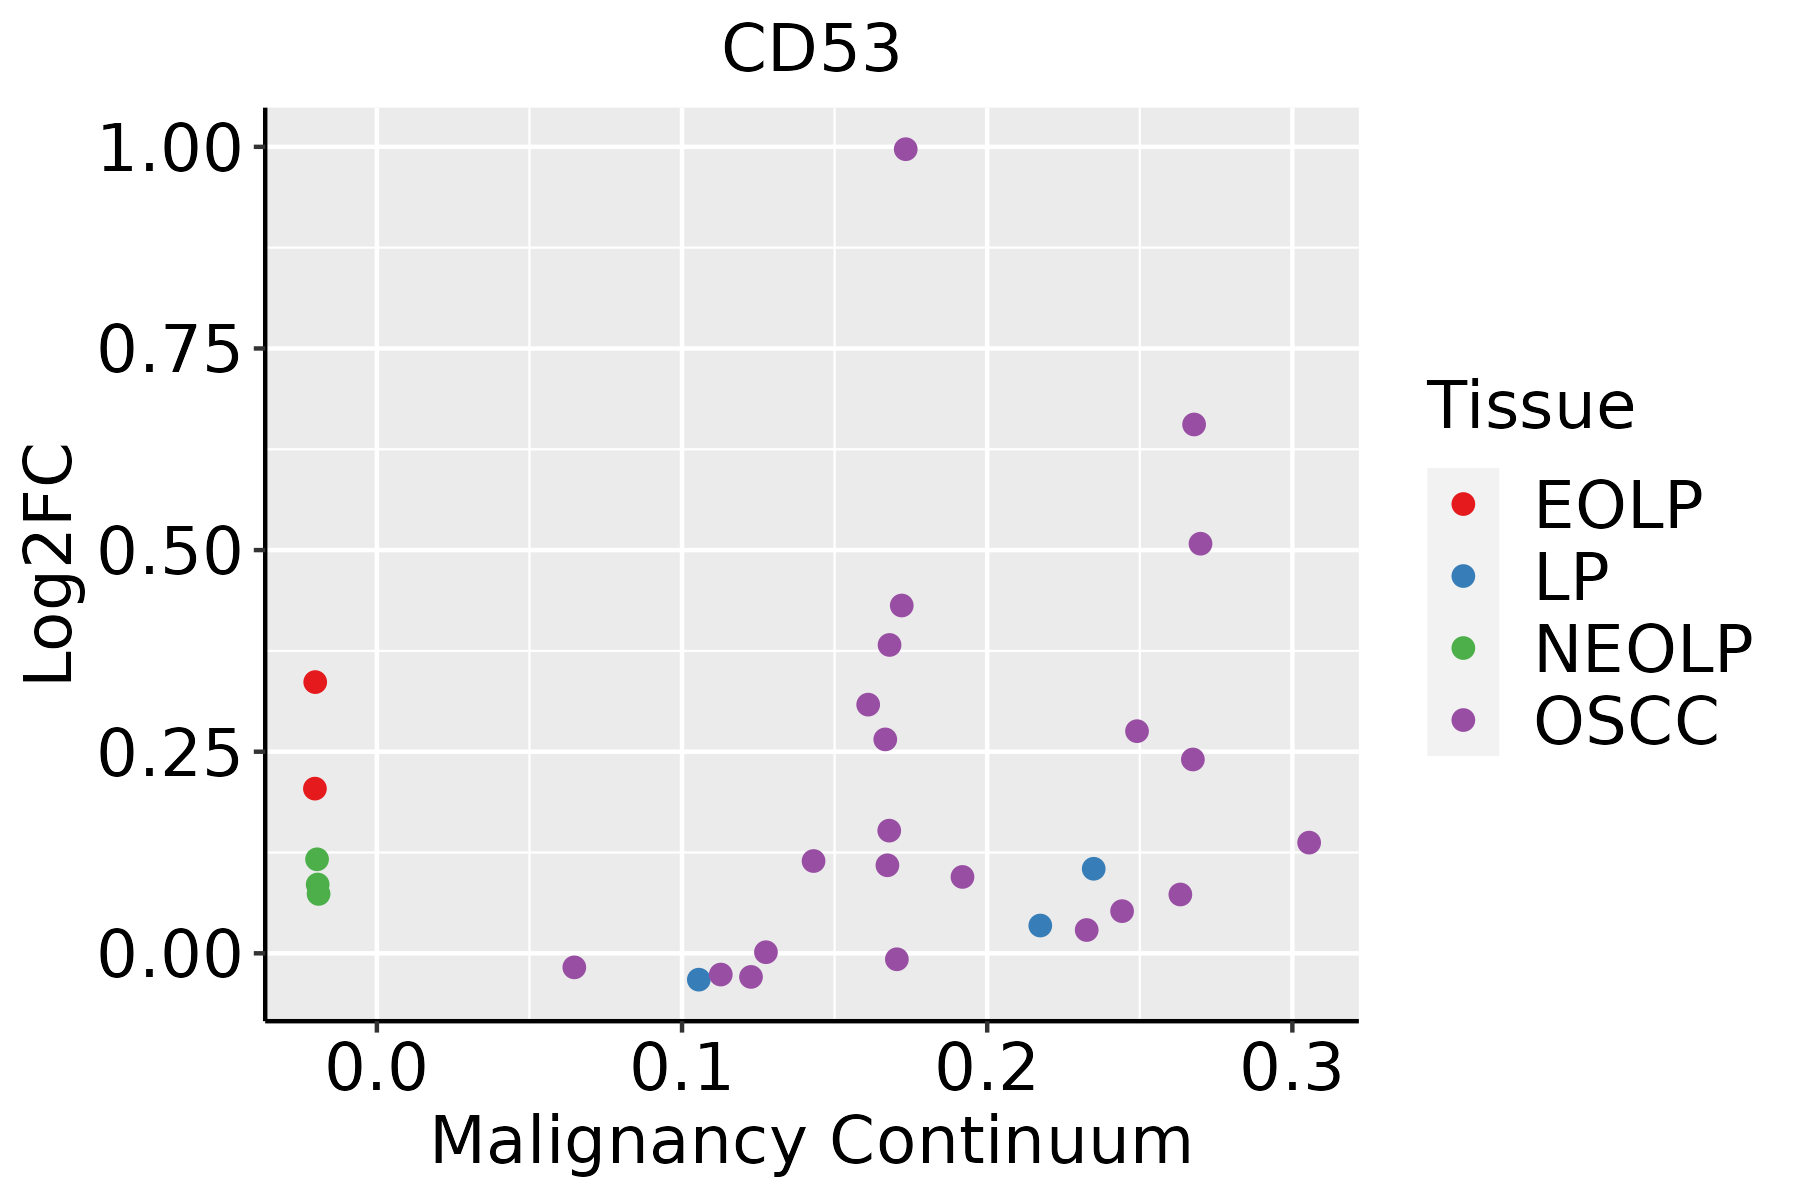 | EOLP: Erosive Oral lichen planus |
| LP: leukoplakia | ||
| NEOLP: Non-erosive oral lichen planus | ||
| OSCC: Oral squamous cell carcinoma |
| ∗log2FC in expression of this searched gene in stem-like cells from each diseased tissue sample relative to stem-like cells in normal samples in each tissue plotted against the malignancy continuum. Samples are colored based on if they are from different disease stage. |
Top |
Malignant transformation related pathway analysis |
| Find out the enriched GO biological processes and KEGG pathways involved in transition from healthy to precancer to cancer |
| Tissue | Disease Stage | Enriched GO biological Processes |
| Colorectum | AD |  |
| Colorectum | SER |  |
| Colorectum | MSS |  |
| Colorectum | MSI-H |  |
| Colorectum | FAP |  |
| ∗Top 15 enriched GO BP terms are showed in the bar plot of each disease state in each tissue. Each row represents a significant GO biological process which is colored according to the -log10(p.adjust). |
| Page: 1 2 3 4 5 6 7 8 9 |
| GO ID | Tissue | Disease Stage | Description | Gene Ratio | Bg Ratio | pvalue | p.adjust | Count |
| GO:00426927 | Oral cavity | OSCC | muscle cell differentiation | 175/7305 | 384/18723 | 4.79e-03 | 1.92e-02 | 175 |
| GO:004269214 | Oral cavity | EOLP | muscle cell differentiation | 77/2218 | 384/18723 | 2.18e-06 | 4.91e-05 | 77 |
| GO:00511467 | Oral cavity | EOLP | striated muscle cell differentiation | 57/2218 | 283/18723 | 3.82e-05 | 5.25e-04 | 57 |
| GO:00007682 | Oral cavity | EOLP | syncytium formation by plasma membrane fusion | 14/2218 | 55/18723 | 4.04e-03 | 2.23e-02 | 14 |
| GO:01402532 | Oral cavity | EOLP | cell-cell fusion | 14/2218 | 55/18723 | 4.04e-03 | 2.23e-02 | 14 |
| GO:00069492 | Oral cavity | EOLP | syncytium formation | 14/2218 | 57/18723 | 5.70e-03 | 2.92e-02 | 14 |
| GO:00075202 | Oral cavity | EOLP | myoblast fusion | 11/2218 | 42/18723 | 8.21e-03 | 3.86e-02 | 11 |
| Page: 1 |
| Pathway ID | Tissue | Disease Stage | Description | Gene Ratio | Bg Ratio | pvalue | p.adjust | qvalue | Count |
| Page: 1 |
Top |
Cell-cell communication analysis |
| Identification of potential cell-cell interactions between two cell types and their ligand-receptor pairs for different disease states |
| Ligand | Receptor | LRpair | Pathway | Tissue | Disease Stage |
| Page: 1 |
Top |
Single-cell gene regulatory network inference analysis |
| Find out the significant the regulons (TFs) and the target genes of each regulon across cell types for different disease states |
| TF | Cell Type | Tissue | Disease Stage | Target Gene | RSS | Regulon Activity |
| ∗The dot plots of a searched regulon are shown for all cell subpopulations in each disease state of each tissue based on the regulon specific score inferred using pySCENIC and by calculating the average expression. |
| Page: 1 |
Top |
Somatic mutation of malignant transformation related genes |
| Annotation of somatic variants for genes involved in malignant transformation |
| Hugo Symbol | Variant Class | Variant Classification | dbSNP RS | HGVSc | HGVSp | HGVSp Short | SWISSPROT | BIOTYPE | SIFT | PolyPhen | Tumor Sample Barcode | Tissue | Histology | Sex | Age | Stage | Therapy Types | Drugs | Outcome |
| CD53 | SNV | Missense_Mutation | rs779244088 | c.324G>C | p.Gln108His | p.Q108H | P19397 | protein_coding | deleterious(0) | benign(0.02) | TCGA-AC-A23H-01 | Breast | breast invasive carcinoma | Female | >=65 | I/II | Unknown | Unknown | PD |
| CD53 | SNV | Missense_Mutation | c.152C>G | p.Thr51Arg | p.T51R | P19397 | protein_coding | deleterious(0) | probably_damaging(0.969) | TCGA-AR-A24L-01 | Breast | breast invasive carcinoma | Female | <65 | I/II | Hormone Therapy | tamoxiphen | PD | |
| CD53 | insertion | Frame_Shift_Ins | novel | c.649_650insAGCAC | p.Ile217LysfsTer3 | p.I217Kfs*3 | P19397 | protein_coding | TCGA-BH-A0B4-01 | Breast | breast invasive carcinoma | Male | >=65 | III/IV | Hormone Therapy | tamoxiphen | SD | ||
| CD53 | SNV | Missense_Mutation | novel | c.482G>A | p.Cys161Tyr | p.C161Y | P19397 | protein_coding | deleterious(0) | probably_damaging(1) | TCGA-2W-A8YY-01 | Cervix | cervical & endocervical cancer | Female | <65 | I/II | Chemotherapy | cisplatin | CR |
| CD53 | SNV | Missense_Mutation | novel | c.479N>G | p.Ser160Cys | p.S160C | P19397 | protein_coding | tolerated(0.26) | probably_damaging(0.977) | TCGA-C5-A2LV-01 | Cervix | cervical & endocervical cancer | Female | <65 | I/II | Unknown | Unknown | SD |
| CD53 | SNV | Missense_Mutation | novel | c.646A>C | p.Thr216Pro | p.T216P | P19397 | protein_coding | tolerated(0.15) | benign(0.01) | TCGA-EX-A8YF-01 | Cervix | cervical & endocervical cancer | Female | <65 | I/II | Unknown | Unknown | PD |
| CD53 | SNV | Missense_Mutation | novel | c.224T>C | p.Ile75Thr | p.I75T | P19397 | protein_coding | deleterious(0) | probably_damaging(0.938) | TCGA-A6-2681-01 | Colorectum | colon adenocarcinoma | Female | >=65 | I/II | Unknown | Unknown | PD |
| CD53 | SNV | Missense_Mutation | c.148N>A | p.Leu50Ile | p.L50I | P19397 | protein_coding | deleterious(0.01) | possibly_damaging(0.657) | TCGA-AA-A01R-01 | Colorectum | colon adenocarcinoma | Male | <65 | III/IV | Chemotherapy | 5-fluorouracil | PD | |
| CD53 | deletion | Frame_Shift_Del | novel | c.166delN | p.Phe56LeufsTer10 | p.F56Lfs*10 | P19397 | protein_coding | TCGA-5M-AAT6-01 | Colorectum | colon adenocarcinoma | Female | <65 | III/IV | Unknown | Unknown | PD | ||
| CD53 | SNV | Missense_Mutation | novel | c.526N>A | p.Leu176Met | p.L176M | P19397 | protein_coding | tolerated(0.12) | benign(0.364) | TCGA-A5-A0G2-01 | Endometrium | uterine corpus endometrioid carcinoma | Female | <65 | III/IV | Unknown | Unknown | SD |
| Page: 1 2 3 |
Top |
Related drugs of malignant transformation related genes |
| Identification of chemicals and drugs interact with genes involved in malignant transfromation |
| (DGIdb 4.0) |
| Entrez ID | Symbol | Category | Interaction Types | Drug Claim Name | Drug Name | PMIDs |
| Page: 1 |

Copyright 2023-Present -The University of Texas Health Science Center at Houston |