
|
|||||
|
 | |
| |
| |
| |
| |
| |
|
Gene: CD52 |
Gene summary for CD52 |
| Gene information | Species | Human | Gene symbol | CD52 | Gene ID | 1043 |
| Gene name | CD52 molecule | |
| Gene Alias | CDW52 | |
| Cytomap | 1p36.11 | |
| Gene Type | protein-coding | GO ID | GO:0006873 | UniProtAcc | P31358 |
Top |
Malignant transformation analysis |
| Identification of the aberrant gene expression in precancerous and cancerous lesions by comparing the gene expression of stem-like cells in diseased tissues with normal stem cells |
| Entrez ID | Symbol | Replicates | Species | Organ | Tissue | Adj P-value | Log2FC | Malignancy |
| 1043 | CD52 | CA_HPV_1 | Human | Cervix | CC | 2.13e-02 | 4.16e-01 | 0.0264 |
| 1043 | CD52 | N_HPV_1 | Human | Cervix | N_HPV | 1.80e-03 | 4.32e-01 | 0.0079 |
| 1043 | CD52 | N_HPV_2 | Human | Cervix | N_HPV | 8.63e-09 | 2.14e-01 | -0.0131 |
| 1043 | CD52 | CCI_1 | Human | Cervix | CC | 2.01e-03 | -6.07e-01 | 0.528 |
| 1043 | CD52 | CCI_2 | Human | Cervix | CC | 7.14e-05 | -6.28e-01 | 0.5249 |
| 1043 | CD52 | CCI_3 | Human | Cervix | CC | 1.02e-07 | -6.28e-01 | 0.516 |
| 1043 | CD52 | CCII_1 | Human | Cervix | CC | 3.27e-11 | -6.28e-01 | 0.3249 |
| 1043 | CD52 | Tumor | Human | Cervix | CC | 4.75e-24 | -6.22e-01 | 0.1241 |
| 1043 | CD52 | sample1 | Human | Cervix | CC | 5.11e-07 | -6.15e-01 | 0.0959 |
| 1043 | CD52 | sample3 | Human | Cervix | CC | 2.26e-19 | -6.05e-01 | 0.1387 |
| 1043 | CD52 | H2 | Human | Cervix | HSIL_HPV | 5.37e-14 | -5.45e-01 | 0.0632 |
| 1043 | CD52 | T1 | Human | Cervix | CC | 1.10e-15 | -5.95e-01 | 0.0918 |
| 1043 | CD52 | T2 | Human | Cervix | CC | 3.07e-02 | -5.91e-01 | 0.0709 |
| 1043 | CD52 | T3 | Human | Cervix | CC | 4.35e-24 | -6.18e-01 | 0.1389 |
| 1043 | CD52 | LZE4T | Human | Esophagus | ESCC | 7.59e-14 | 8.91e-01 | 0.0811 |
| 1043 | CD52 | LZE7T | Human | Esophagus | ESCC | 2.93e-09 | 9.41e-01 | 0.0667 |
| 1043 | CD52 | LZE22D1 | Human | Esophagus | HGIN | 8.41e-03 | 4.95e-01 | 0.0595 |
| 1043 | CD52 | LZE6T | Human | Esophagus | ESCC | 9.80e-24 | 1.96e+00 | 0.0845 |
| 1043 | CD52 | P27T-E | Human | Esophagus | ESCC | 4.27e-03 | 5.46e-02 | 0.1055 |
| 1043 | CD52 | P130T-E | Human | Esophagus | ESCC | 3.11e-05 | 2.72e-01 | 0.1676 |
| Page: 1 2 3 |
| Tissue | Expression Dynamics | Abbreviation |
| Cervix | 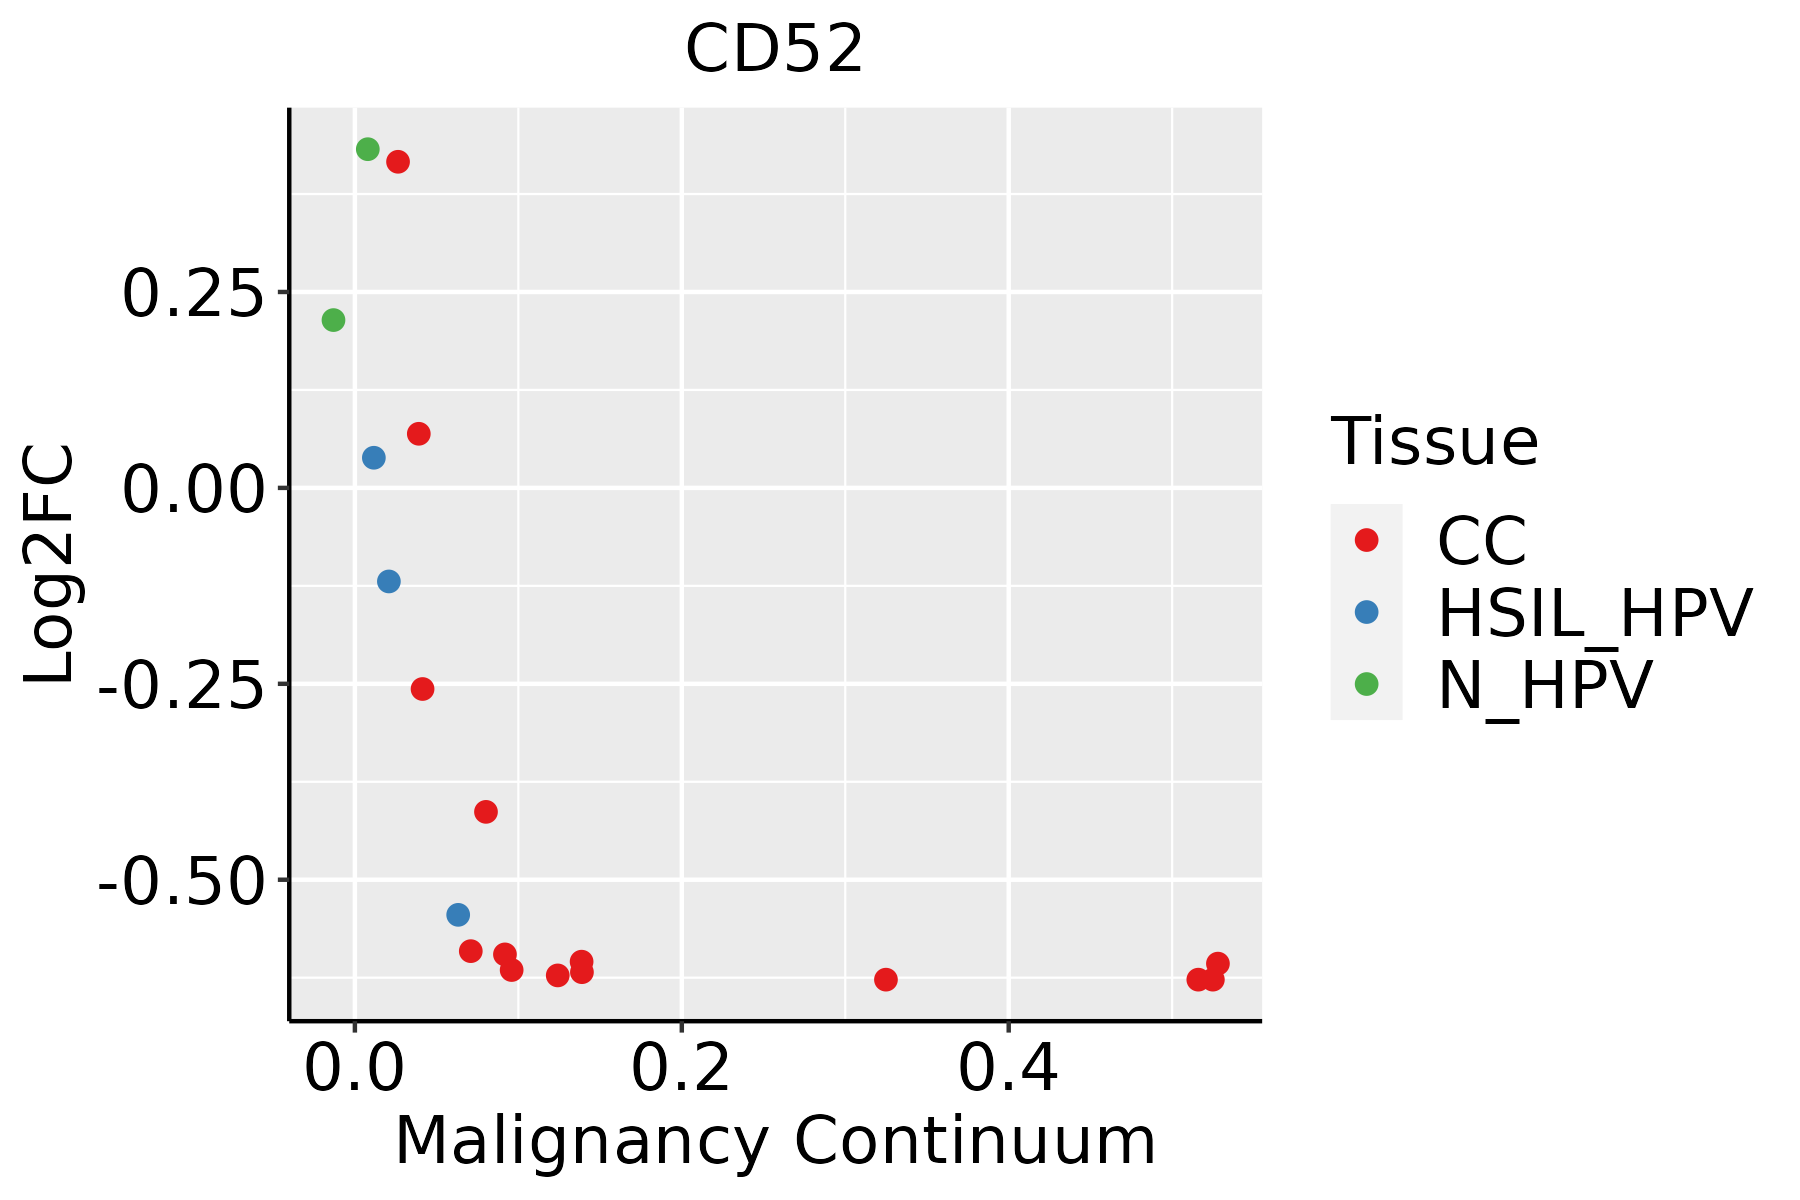 | CC: Cervix cancer |
| HSIL_HPV: HPV-infected high-grade squamous intraepithelial lesions | ||
| N_HPV: HPV-infected normal cervix | ||
| Esophagus | 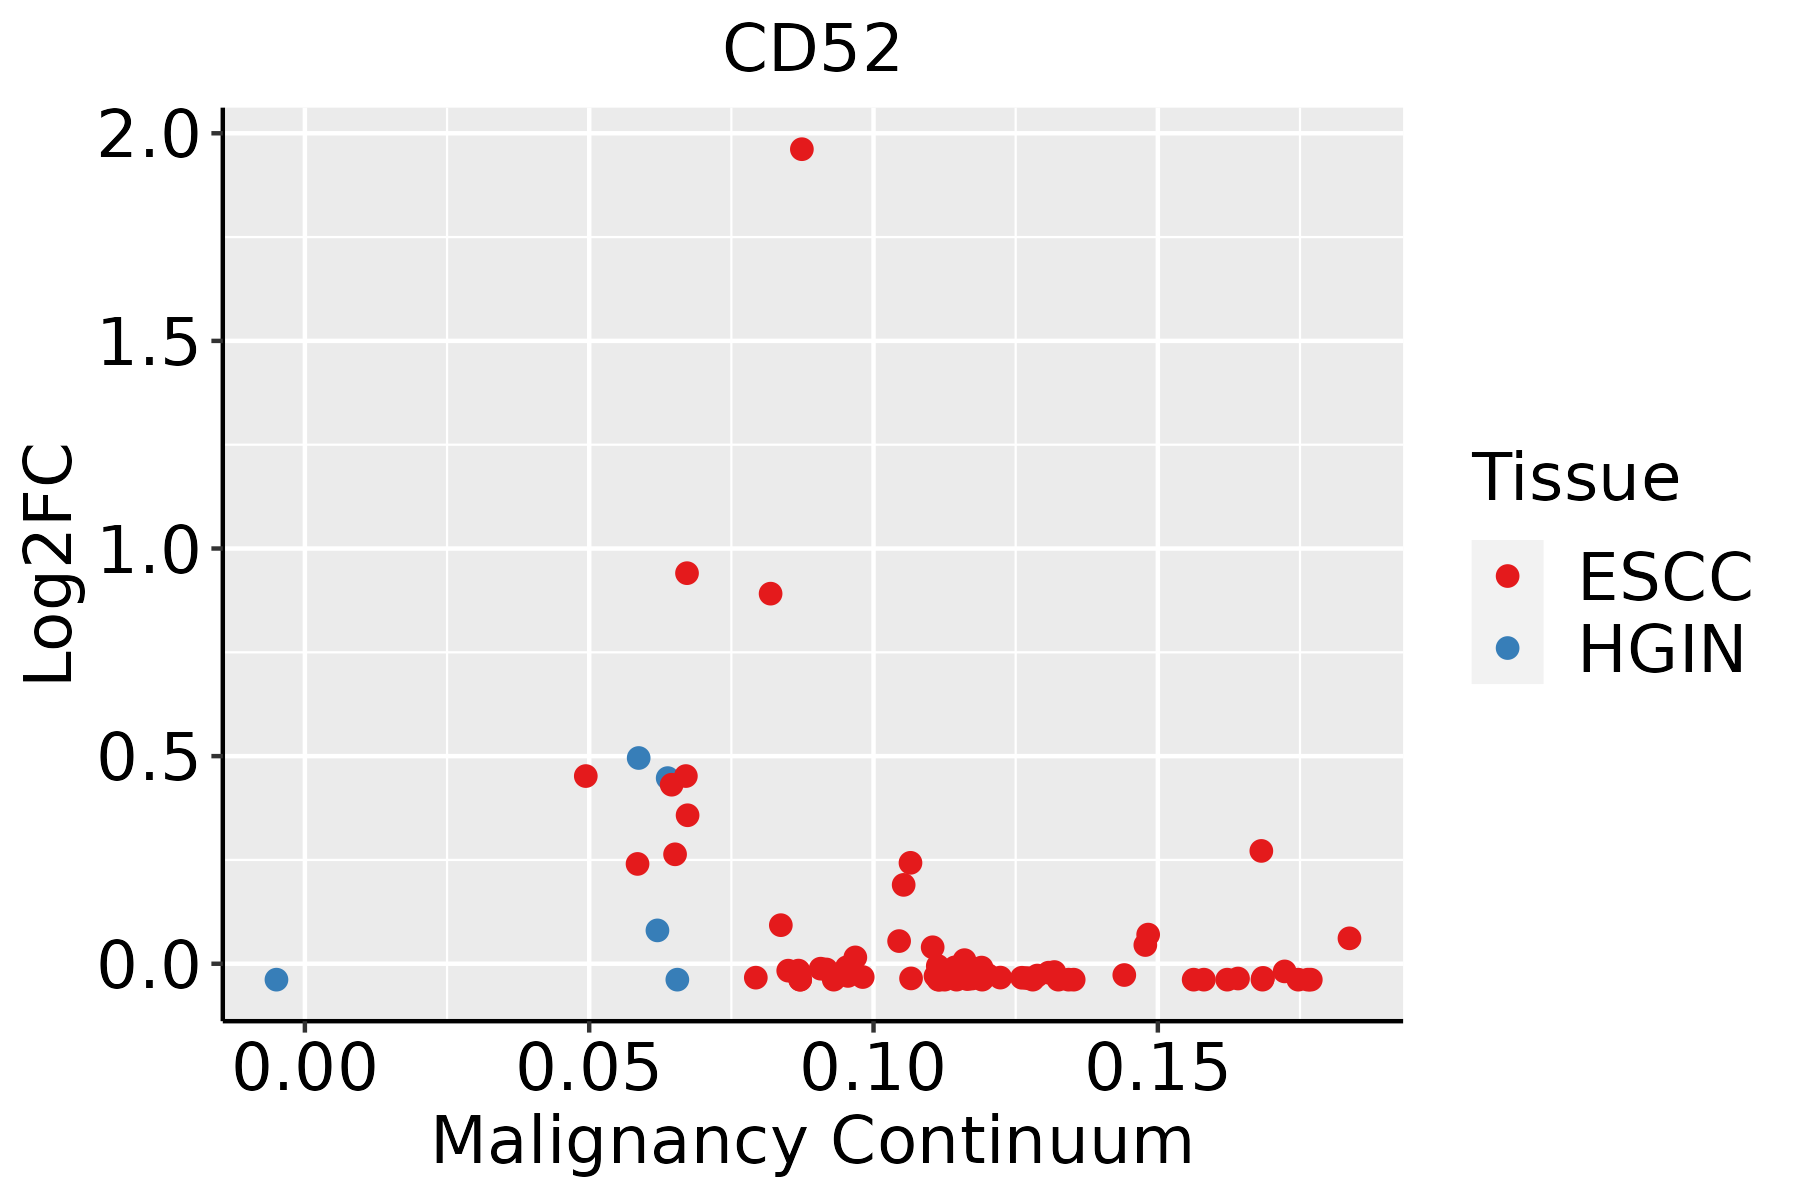 | ESCC: Esophageal squamous cell carcinoma |
| HGIN: High-grade intraepithelial neoplasias | ||
| LGIN: Low-grade intraepithelial neoplasias | ||
| Liver |  | HCC: Hepatocellular carcinoma |
| NAFLD: Non-alcoholic fatty liver disease | ||
| Oral Cavity | 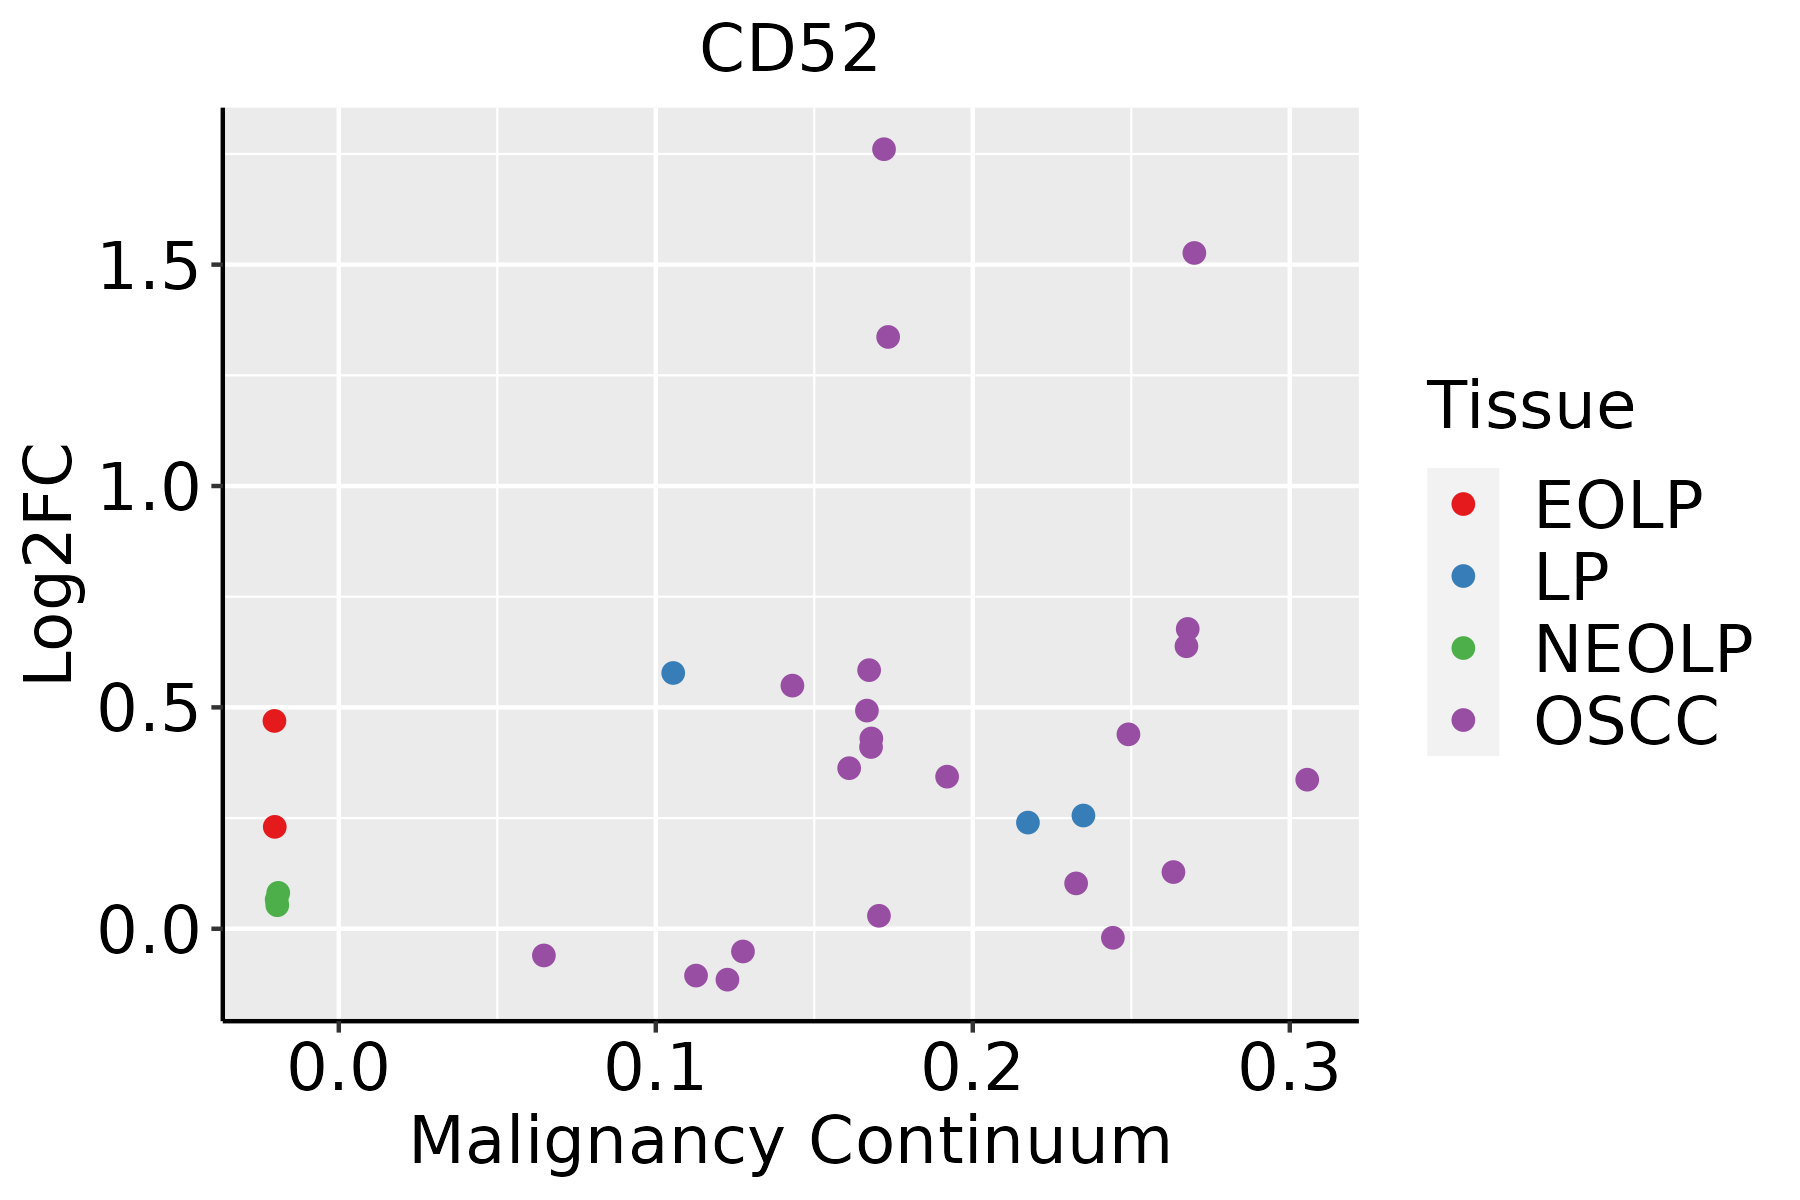 | EOLP: Erosive Oral lichen planus |
| LP: leukoplakia | ||
| NEOLP: Non-erosive oral lichen planus | ||
| OSCC: Oral squamous cell carcinoma | ||
| Thyroid | 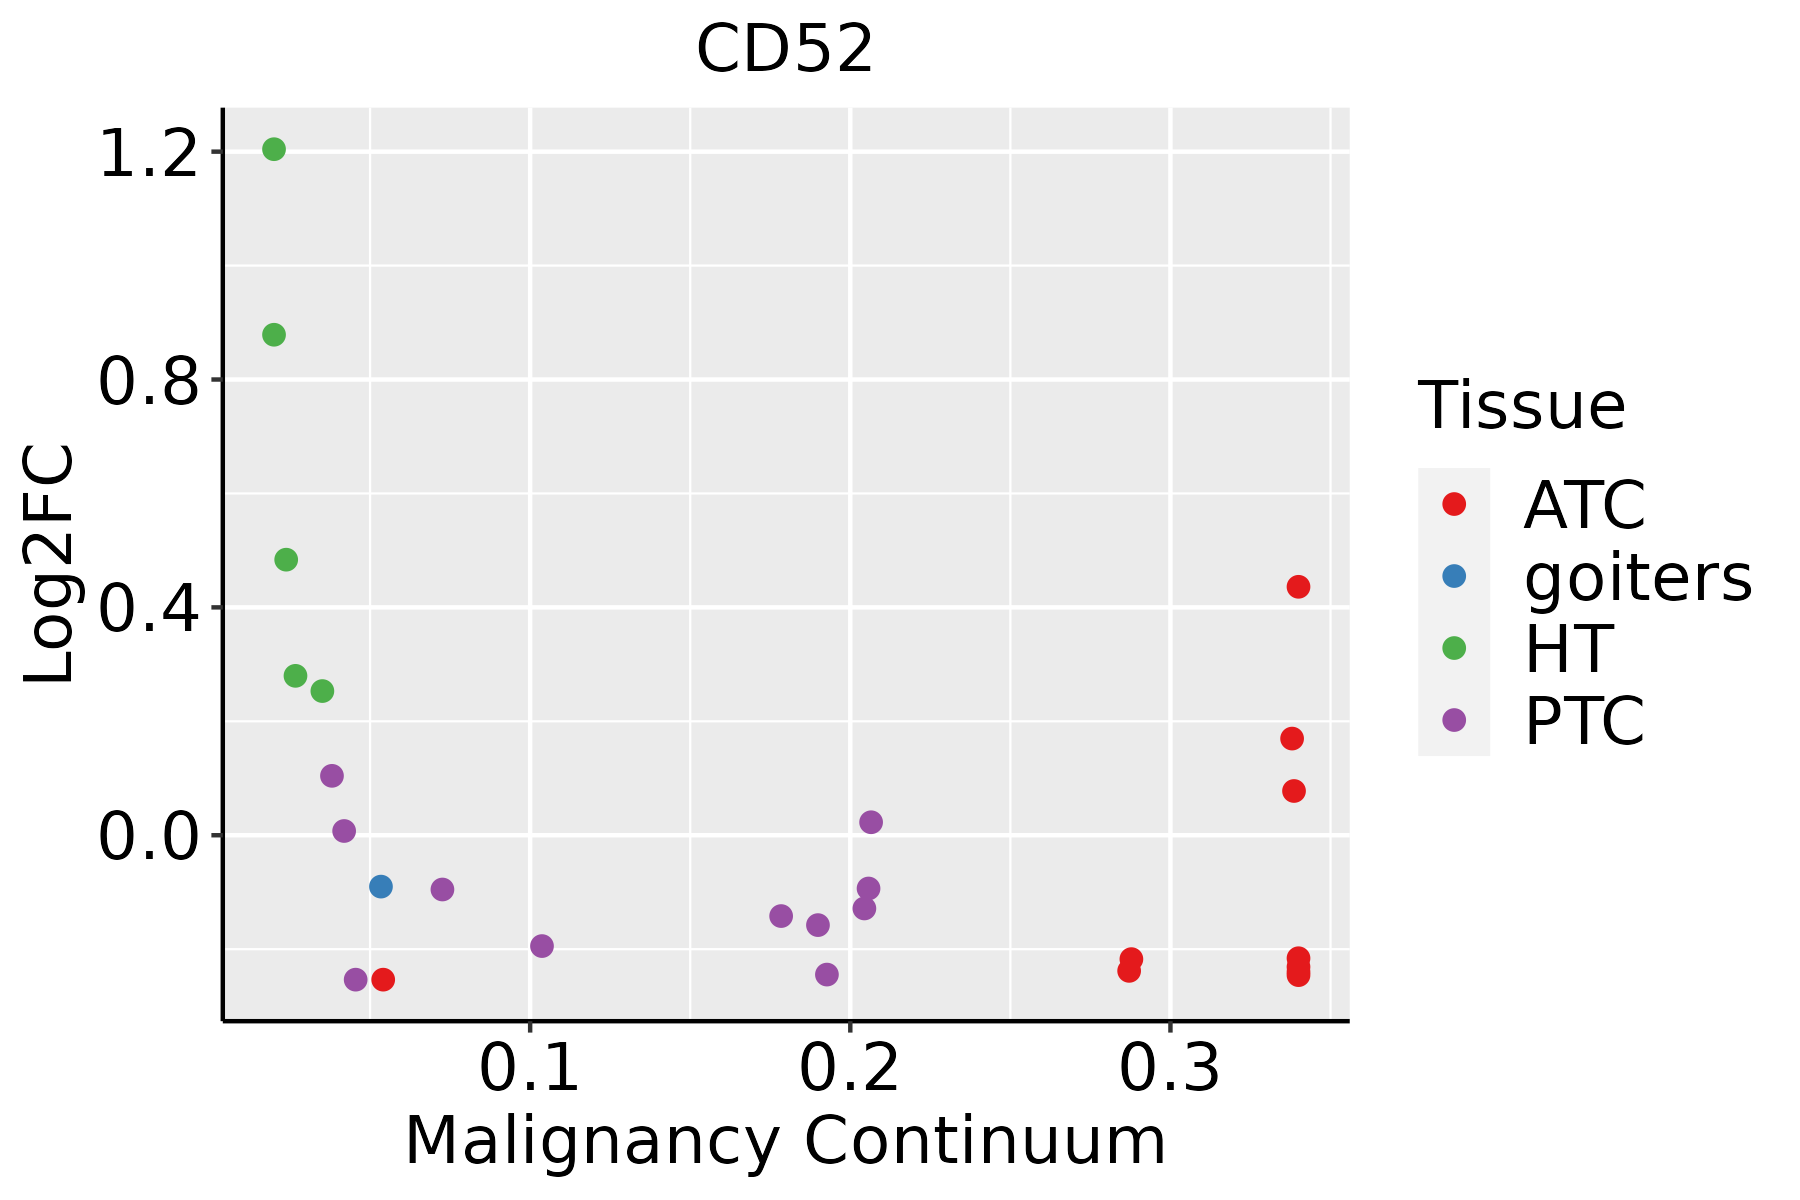 | ATC: Anaplastic thyroid cancer |
| HT: Hashimoto's thyroiditis | ||
| PTC: Papillary thyroid cancer |
| ∗log2FC in expression of this searched gene in stem-like cells from each diseased tissue sample relative to stem-like cells in normal samples in each tissue plotted against the malignancy continuum. Samples are colored based on if they are from different disease stage. |
Top |
Malignant transformation related pathway analysis |
| Find out the enriched GO biological processes and KEGG pathways involved in transition from healthy to precancer to cancer |
| Tissue | Disease Stage | Enriched GO biological Processes |
| Colorectum | AD |  |
| Colorectum | SER |  |
| Colorectum | MSS |  |
| Colorectum | MSI-H |  |
| Colorectum | FAP |  |
| ∗Top 15 enriched GO BP terms are showed in the bar plot of each disease state in each tissue. Each row represents a significant GO biological process which is colored according to the -log10(p.adjust). |
| Page: 1 2 3 4 5 6 7 8 9 |
| GO ID | Tissue | Disease Stage | Description | Gene Ratio | Bg Ratio | pvalue | p.adjust | Count |
| GO:00457306 | Cervix | CC | respiratory burst | 14/2311 | 37/18723 | 6.97e-05 | 9.81e-04 | 14 |
| GO:004573013 | Cervix | HSIL_HPV | respiratory burst | 9/737 | 37/18723 | 9.97e-06 | 3.41e-04 | 9 |
| GO:004573022 | Cervix | N_HPV | respiratory burst | 9/534 | 37/18723 | 7.12e-07 | 4.16e-05 | 9 |
| GO:00725031 | Cervix | N_HPV | cellular divalent inorganic cation homeostasis | 24/534 | 486/18723 | 6.76e-03 | 4.52e-02 | 24 |
| GO:00457308 | Oral cavity | EOLP | respiratory burst | 14/2218 | 37/18723 | 4.41e-05 | 5.93e-04 | 14 |
| GO:00725032 | Oral cavity | EOLP | cellular divalent inorganic cation homeostasis | 75/2218 | 486/18723 | 9.77e-03 | 4.42e-02 | 75 |
| GO:00457309 | Thyroid | HT | respiratory burst | 12/1272 | 37/18723 | 3.46e-06 | 1.15e-04 | 12 |
| Page: 1 |
| Pathway ID | Tissue | Disease Stage | Description | Gene Ratio | Bg Ratio | pvalue | p.adjust | qvalue | Count |
| Page: 1 |
Top |
Cell-cell communication analysis |
| Identification of potential cell-cell interactions between two cell types and their ligand-receptor pairs for different disease states |
| Ligand | Receptor | LRpair | Pathway | Tissue | Disease Stage |
| Page: 1 |
Top |
Single-cell gene regulatory network inference analysis |
| Find out the significant the regulons (TFs) and the target genes of each regulon across cell types for different disease states |
| TF | Cell Type | Tissue | Disease Stage | Target Gene | RSS | Regulon Activity |
| ∗The dot plots of a searched regulon are shown for all cell subpopulations in each disease state of each tissue based on the regulon specific score inferred using pySCENIC and by calculating the average expression. |
| Page: 1 |
Top |
Somatic mutation of malignant transformation related genes |
| Annotation of somatic variants for genes involved in malignant transformation |
| Hugo Symbol | Variant Class | Variant Classification | dbSNP RS | HGVSc | HGVSp | HGVSp Short | SWISSPROT | BIOTYPE | SIFT | PolyPhen | Tumor Sample Barcode | Tissue | Histology | Sex | Age | Stage | Therapy Types | Drugs | Outcome |
| CD52 | SNV | Missense_Mutation | rs141117966 | c.7C>T | p.Arg3Cys | p.R3C | P31358 | protein_coding | tolerated_low_confidence(0.06) | possibly_damaging(0.666) | TCGA-A2-A0EU-01 | Breast | breast invasive carcinoma | Female | >=65 | I/II | Unknown | Unknown | SD |
| CD52 | deletion | Frame_Shift_Del | novel | c.94delA | p.Thr32ProfsTer10 | p.T32Pfs*10 | P31358 | protein_coding | TCGA-D8-A27V-01 | Breast | breast invasive carcinoma | Female | <65 | I/II | Hormone Therapy | tamoxiphen | SD | ||
| CD52 | SNV | Missense_Mutation | rs141117966 | c.7C>T | p.Arg3Cys | p.R3C | P31358 | protein_coding | tolerated_low_confidence(0.06) | possibly_damaging(0.666) | TCGA-A6-5665-01 | Colorectum | colon adenocarcinoma | Female | >=65 | I/II | Unknown | Unknown | PD |
| CD52 | SNV | Missense_Mutation | novel | c.16T>C | p.Phe6Leu | p.F6L | P31358 | protein_coding | deleterious_low_confidence(0) | benign(0.058) | TCGA-B5-A1MX-01 | Endometrium | uterine corpus endometrioid carcinoma | Female | <65 | I/II | Hormone Therapy | megace | SD |
| CD52 | SNV | Missense_Mutation | rs570039509 | c.8G>A | p.Arg3His | p.R3H | P31358 | protein_coding | tolerated_low_confidence(0.11) | possibly_damaging(0.597) | TCGA-FI-A2D5-01 | Endometrium | uterine corpus endometrioid carcinoma | Female | <65 | III/IV | Chemotherapy | carboplatinum | PD |
| CD52 | SNV | Missense_Mutation | rs570039509 | c.8N>A | p.Arg3His | p.R3H | P31358 | protein_coding | tolerated_low_confidence(0.11) | possibly_damaging(0.597) | TCGA-44-A47F-01 | Lung | lung adenocarcinoma | Male | >=65 | I/II | Chemotherapy | alimta | CR |
| CD52 | SNV | Missense_Mutation | rs141117966 | c.7N>T | p.Arg3Cys | p.R3C | P31358 | protein_coding | tolerated_low_confidence(0.06) | possibly_damaging(0.666) | TCGA-CN-5373-01 | Oral cavity | head & neck squamous cell carcinoma | Female | <65 | I/II | Unknown | Unknown | SD |
| CD52 | SNV | Missense_Mutation | rs750981479 | c.128N>A | p.Gly43Glu | p.G43E | P31358 | protein_coding | deleterious_low_confidence(0) | benign(0.042) | TCGA-CV-A6JM-01 | Oral cavity | head & neck squamous cell carcinoma | Male | >=65 | I/II | Unknown | Unknown | PD |
| CD52 | SNV | Missense_Mutation | c.79N>C | p.Asn27His | p.N27H | P31358 | protein_coding | tolerated_low_confidence(0.14) | benign(0.307) | TCGA-BR-8680-01 | Stomach | stomach adenocarcinoma | Male | <65 | III/IV | Chemotherapy | oxaliplatin | CR |
| Page: 1 |
Top |
Related drugs of malignant transformation related genes |
| Identification of chemicals and drugs interact with genes involved in malignant transfromation |
| (DGIdb 4.0) |
| Entrez ID | Symbol | Category | Interaction Types | Drug Claim Name | Drug Name | PMIDs |
| 1043 | CD52 | DRUGGABLE GENOME | antibody | 178103376 | ALEMTUZUMAB | |
| 1043 | CD52 | DRUGGABLE GENOME | Alemtuzumab | ALEMTUZUMAB | ||
| 1043 | CD52 | DRUGGABLE GENOME | inhibitor | CHEMBL1201587 | ALEMTUZUMAB | |
| 1043 | CD52 | DRUGGABLE GENOME | antibody | ALEMTUZUMAB | ALEMTUZUMAB | |
| 1043 | CD52 | DRUGGABLE GENOME | CAMPATH | ALEMTUZUMAB | 8981930 | |
| 1043 | CD52 | DRUGGABLE GENOME | ALEMTUZUMAB | ALEMTUZUMAB | ||
| 1043 | CD52 | DRUGGABLE GENOME | ANDROGENS | 10737964 | ||
| 1043 | CD52 | DRUGGABLE GENOME | ALEMTUZUMAB | ALEMTUZUMAB | ||
| 1043 | CD52 | DRUGGABLE GENOME | GZ402668 |
| Page: 1 |

Copyright 2023-Present -The University of Texas Health Science Center at Houston |