
|
|||||
|
 | |
| |
| |
| |
| |
| |
|
Gene: CD47 |
Gene summary for CD47 |
| Gene information | Species | Human | Gene symbol | CD47 | Gene ID | 961 |
| Gene name | CD47 molecule | |
| Gene Alias | IAP | |
| Cytomap | 3q13.12 | |
| Gene Type | protein-coding | GO ID | GO:0001775 | UniProtAcc | Q08722 |
Top |
Malignant transformation analysis |
| Identification of the aberrant gene expression in precancerous and cancerous lesions by comparing the gene expression of stem-like cells in diseased tissues with normal stem cells |
| Entrez ID | Symbol | Replicates | Species | Organ | Tissue | Adj P-value | Log2FC | Malignancy |
| 961 | CD47 | GSM4909286 | Human | Breast | IDC | 3.35e-09 | -3.02e-01 | 0.1081 |
| 961 | CD47 | GSM4909287 | Human | Breast | IDC | 2.46e-08 | -4.43e-01 | 0.2057 |
| 961 | CD47 | GSM4909290 | Human | Breast | IDC | 8.36e-03 | -3.14e-01 | 0.2096 |
| 961 | CD47 | GSM4909291 | Human | Breast | IDC | 5.05e-03 | -3.77e-01 | 0.1753 |
| 961 | CD47 | GSM4909293 | Human | Breast | IDC | 2.14e-08 | -4.28e-01 | 0.1581 |
| 961 | CD47 | GSM4909294 | Human | Breast | IDC | 2.26e-19 | -5.63e-01 | 0.2022 |
| 961 | CD47 | GSM4909296 | Human | Breast | IDC | 5.38e-22 | -5.48e-01 | 0.1524 |
| 961 | CD47 | GSM4909297 | Human | Breast | IDC | 6.74e-17 | -3.44e-01 | 0.1517 |
| 961 | CD47 | GSM4909298 | Human | Breast | IDC | 8.09e-03 | -1.94e-01 | 0.1551 |
| 961 | CD47 | GSM4909301 | Human | Breast | IDC | 2.19e-20 | -5.49e-01 | 0.1577 |
| 961 | CD47 | GSM4909302 | Human | Breast | IDC | 3.77e-04 | -3.60e-01 | 0.1545 |
| 961 | CD47 | GSM4909304 | Human | Breast | IDC | 9.52e-04 | -3.57e-01 | 0.1636 |
| 961 | CD47 | GSM4909306 | Human | Breast | IDC | 1.94e-07 | -3.84e-01 | 0.1564 |
| 961 | CD47 | GSM4909307 | Human | Breast | IDC | 3.35e-19 | -5.68e-01 | 0.1569 |
| 961 | CD47 | GSM4909308 | Human | Breast | IDC | 4.65e-07 | -4.30e-01 | 0.158 |
| 961 | CD47 | GSM4909309 | Human | Breast | IDC | 1.16e-02 | -3.31e-01 | 0.0483 |
| 961 | CD47 | GSM4909311 | Human | Breast | IDC | 1.82e-38 | -6.43e-01 | 0.1534 |
| 961 | CD47 | GSM4909312 | Human | Breast | IDC | 1.37e-16 | -4.84e-01 | 0.1552 |
| 961 | CD47 | GSM4909313 | Human | Breast | IDC | 9.95e-04 | -3.50e-01 | 0.0391 |
| 961 | CD47 | GSM4909317 | Human | Breast | IDC | 9.95e-03 | -2.55e-01 | 0.1355 |
| Page: 1 2 3 4 5 6 7 8 9 10 11 |
| Tissue | Expression Dynamics | Abbreviation |
| Breast | 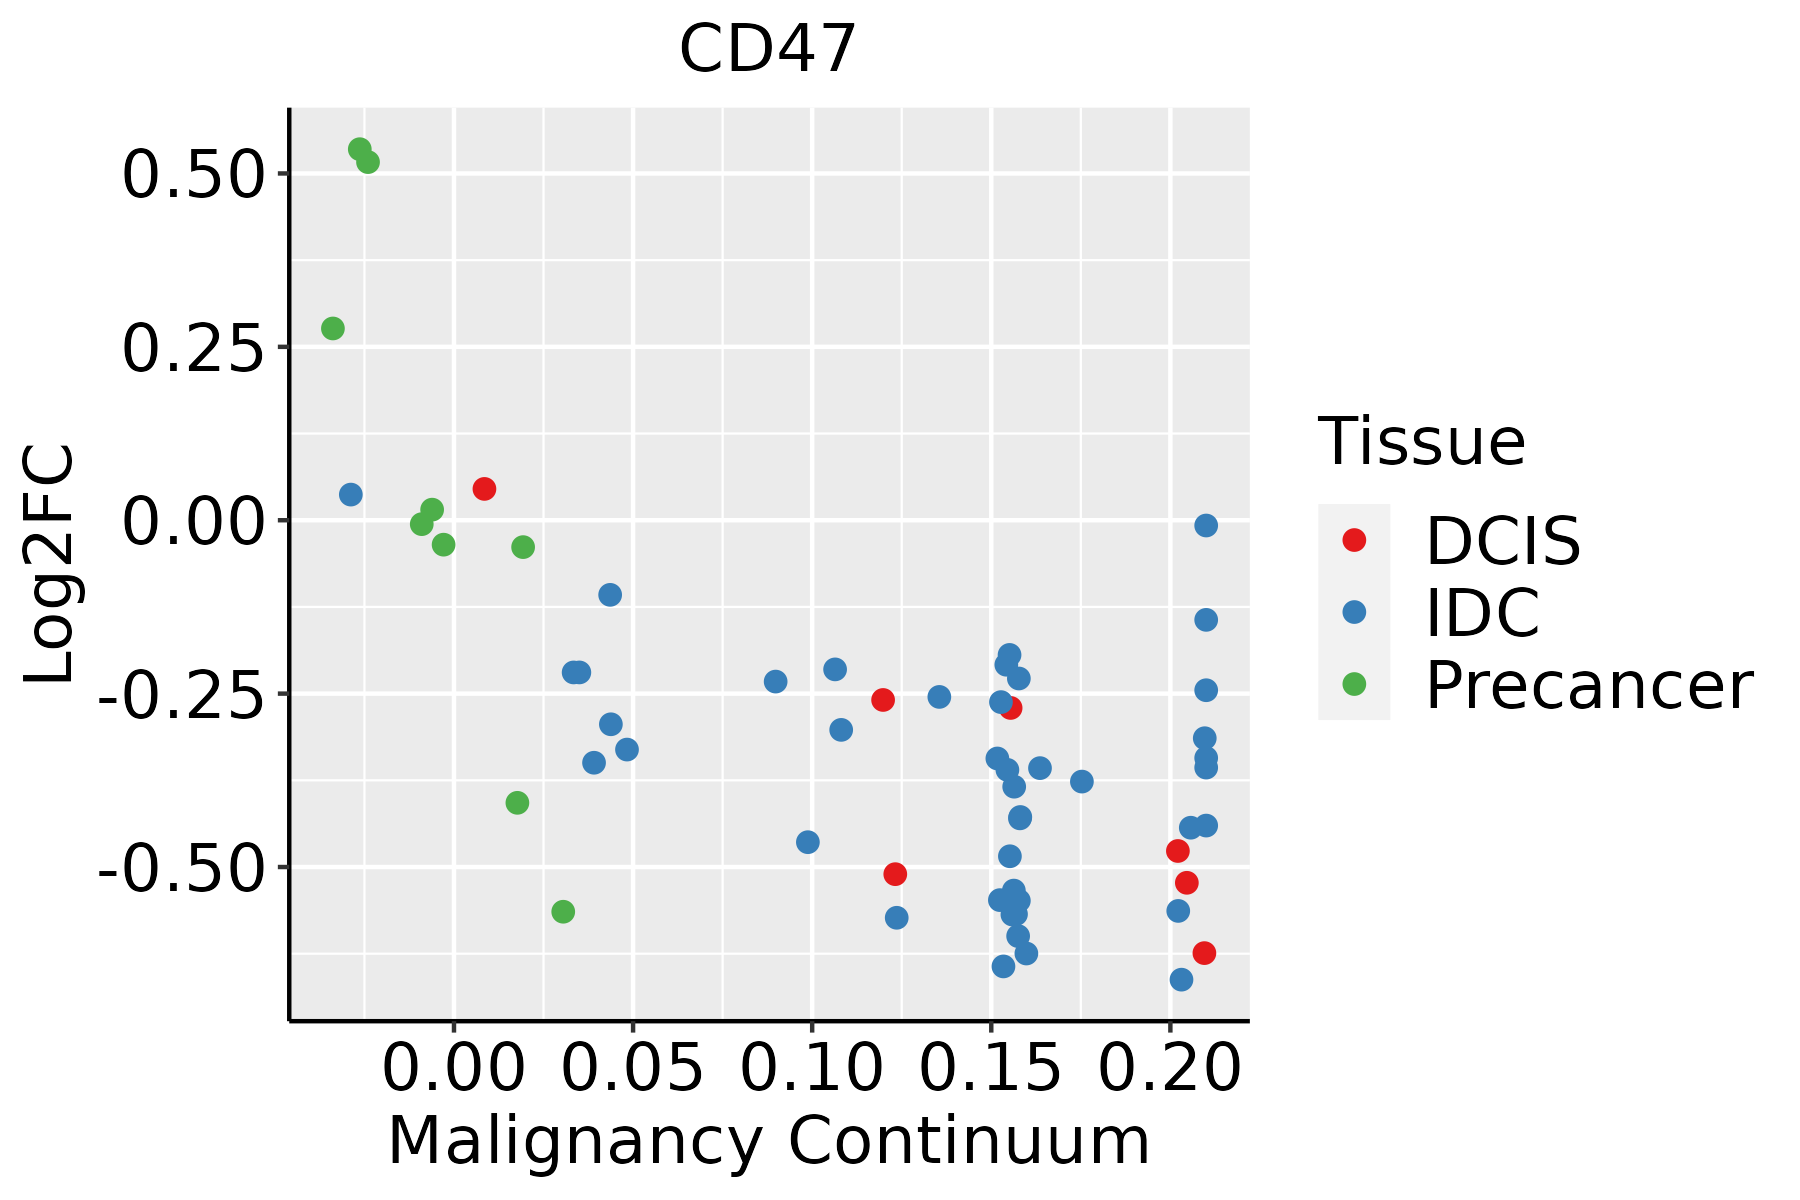 | IDC: Invasive ductal carcinoma |
| DCIS: Ductal carcinoma in situ | ||
| Precancer(BRCA1-mut): Precancerous lesion from BRCA1 mutation carriers | ||
| Cervix | 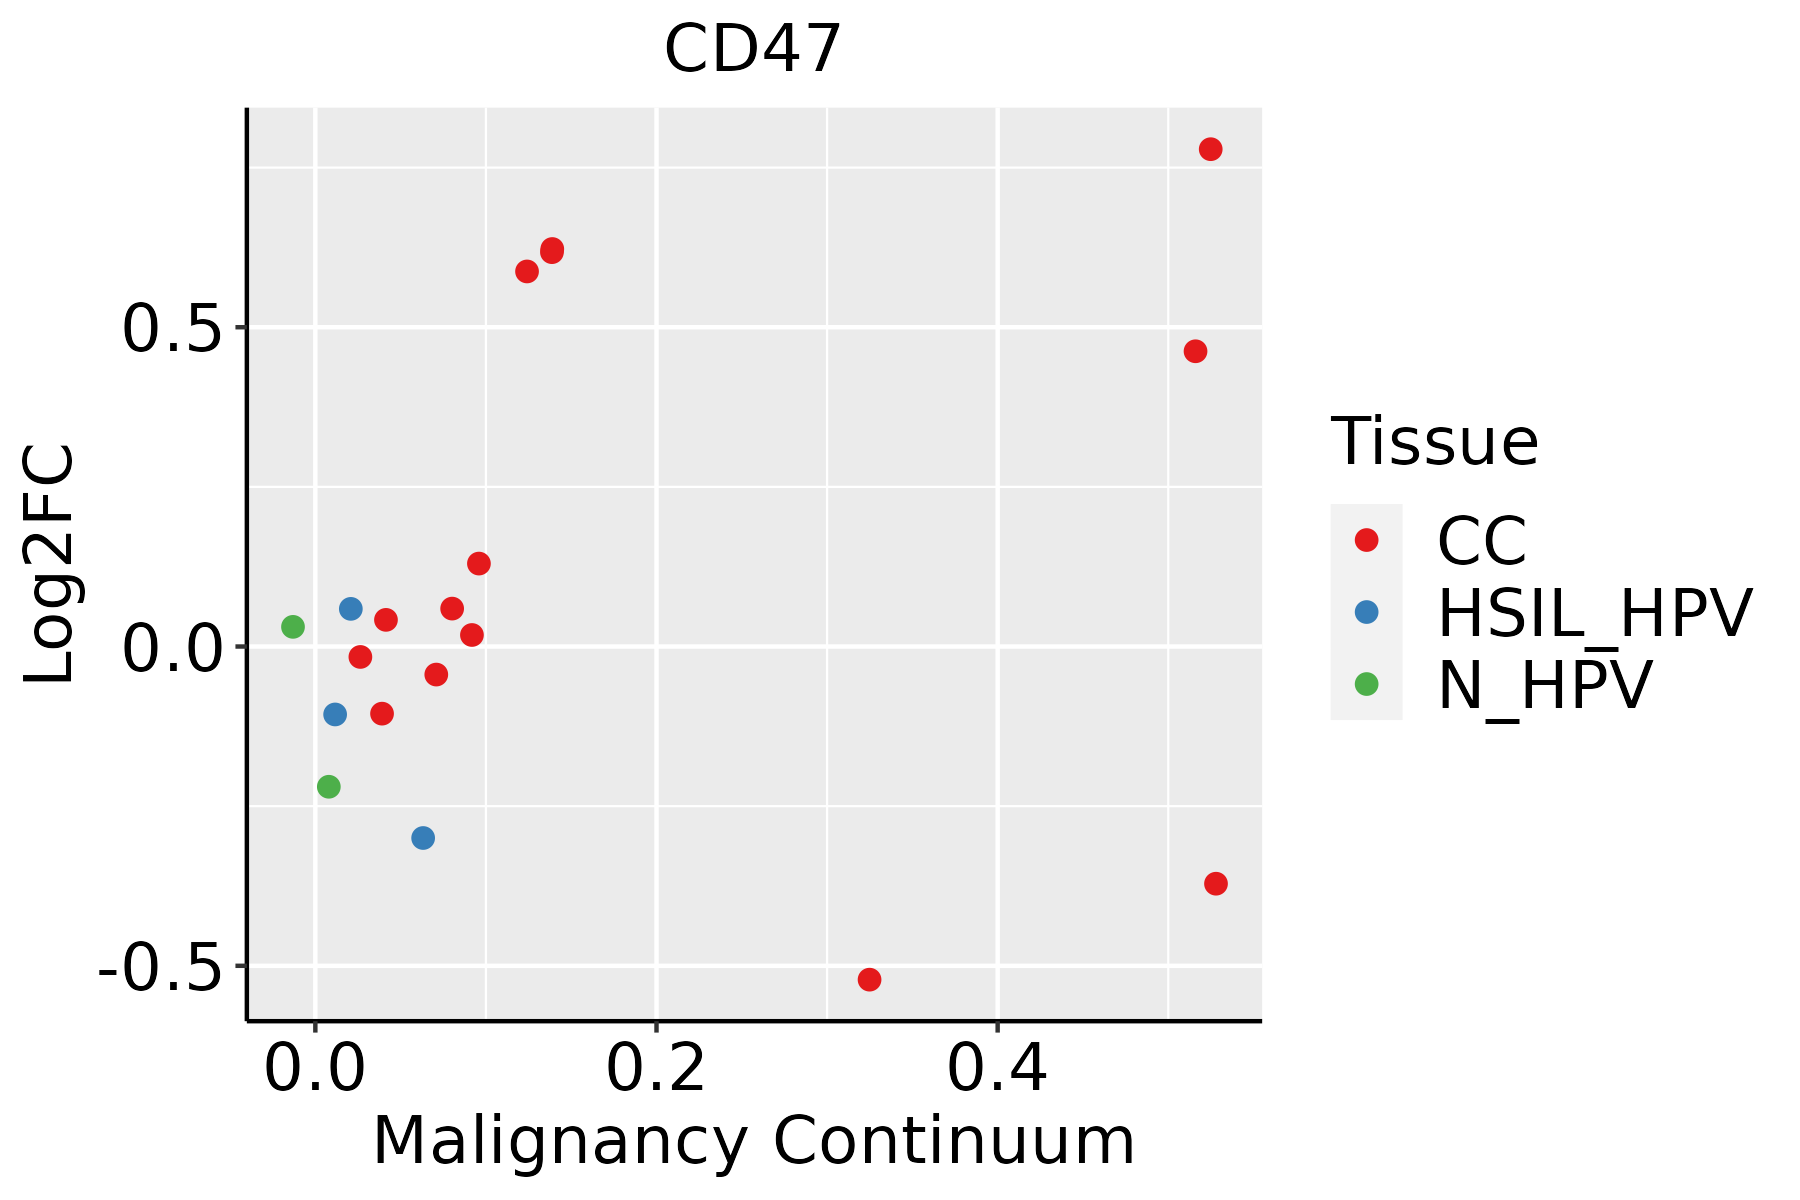 | CC: Cervix cancer |
| HSIL_HPV: HPV-infected high-grade squamous intraepithelial lesions | ||
| N_HPV: HPV-infected normal cervix | ||
| Endometrium | 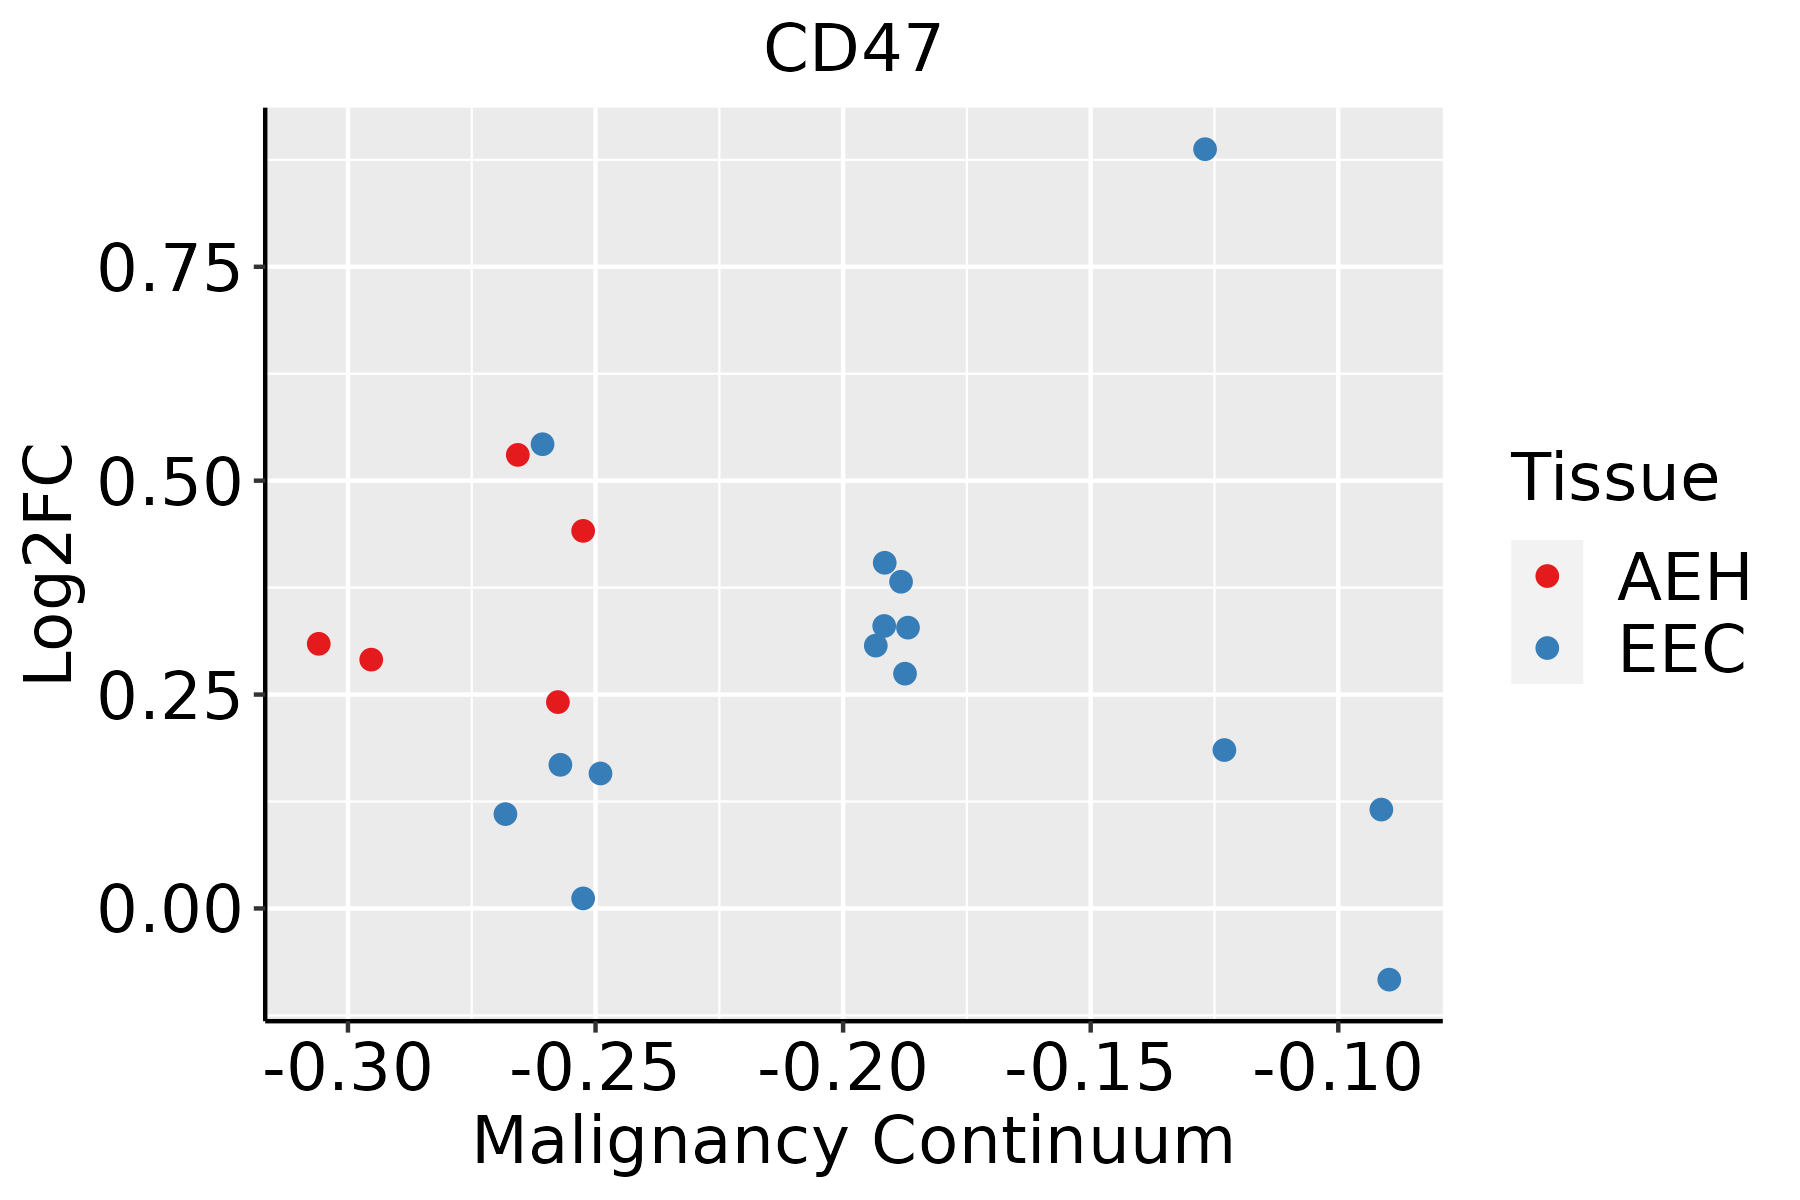 | AEH: Atypical endometrial hyperplasia |
| EEC: Endometrioid Cancer | ||
| Esophagus |  | ESCC: Esophageal squamous cell carcinoma |
| HGIN: High-grade intraepithelial neoplasias | ||
| LGIN: Low-grade intraepithelial neoplasias | ||
| Liver | 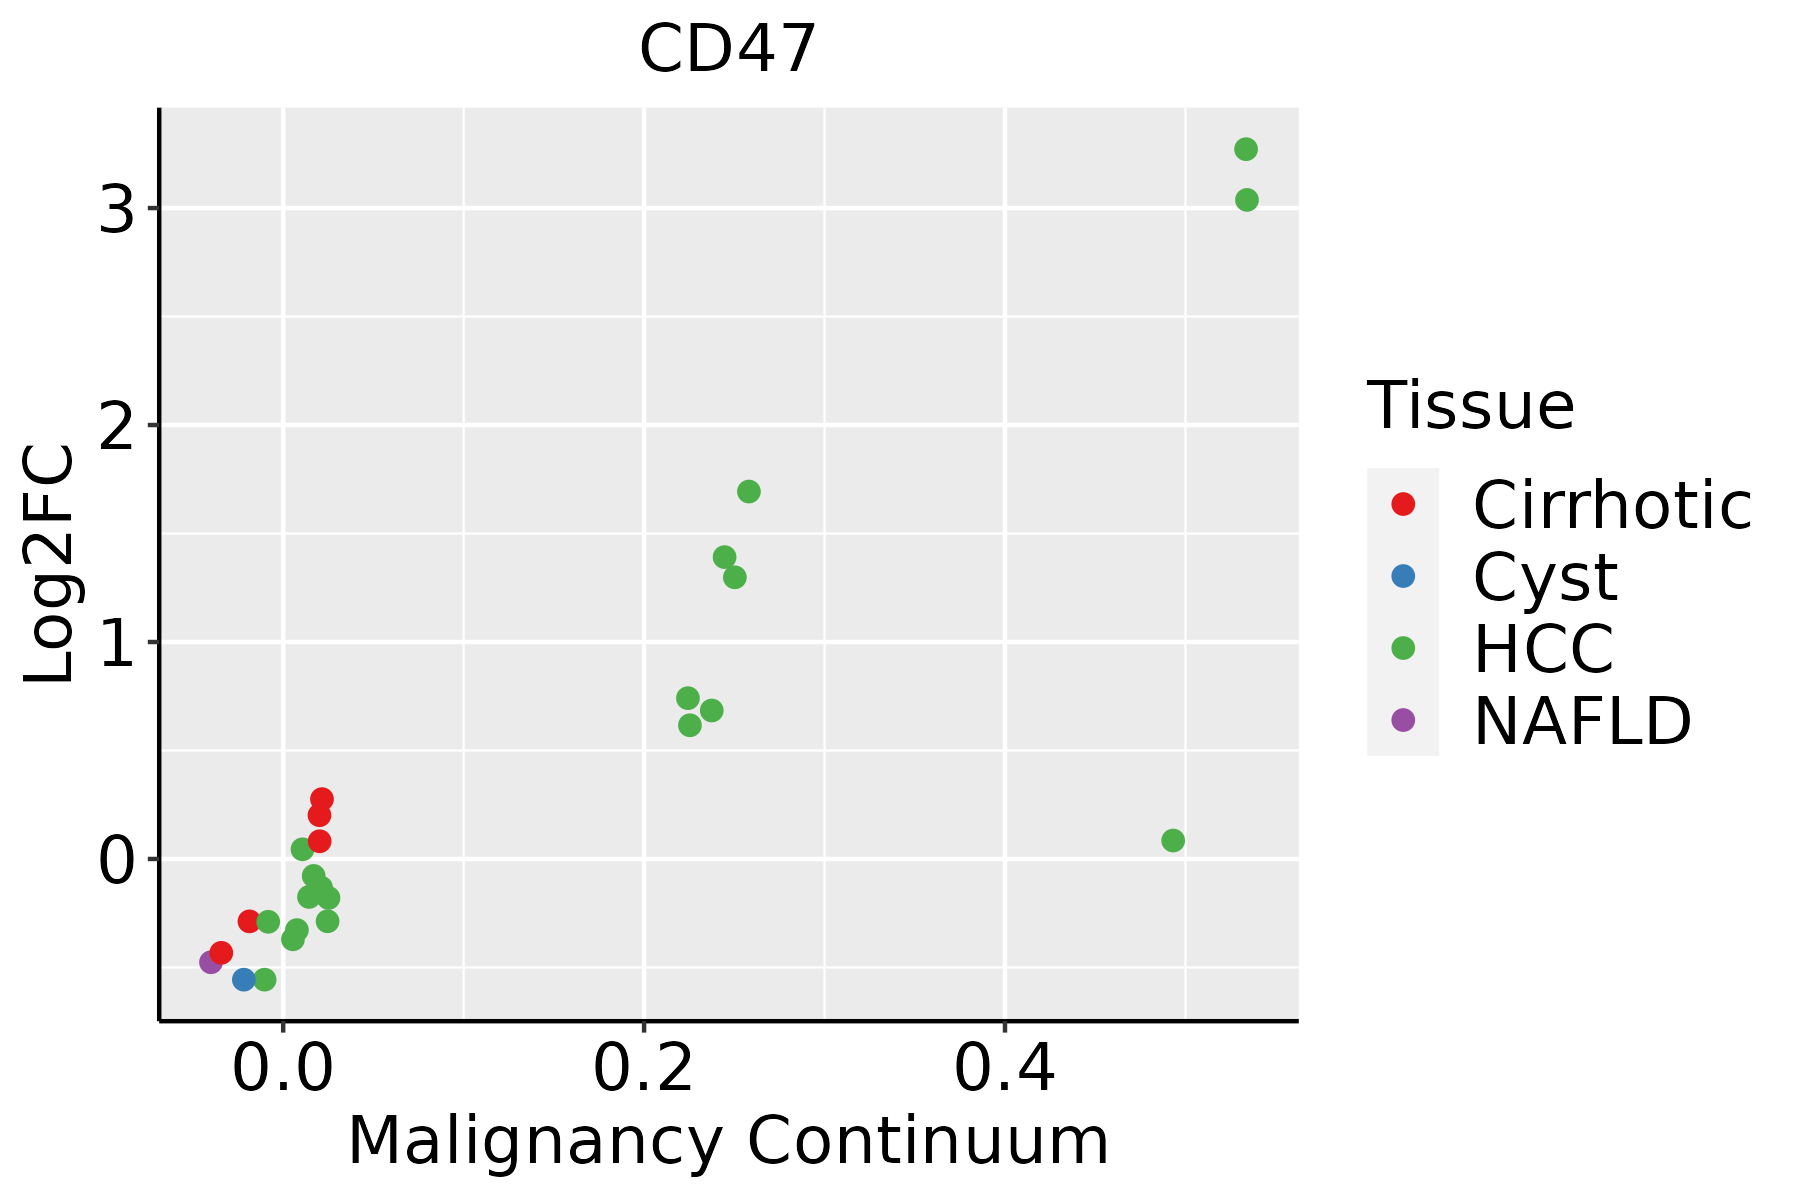 | HCC: Hepatocellular carcinoma |
| NAFLD: Non-alcoholic fatty liver disease | ||
| Oral Cavity | 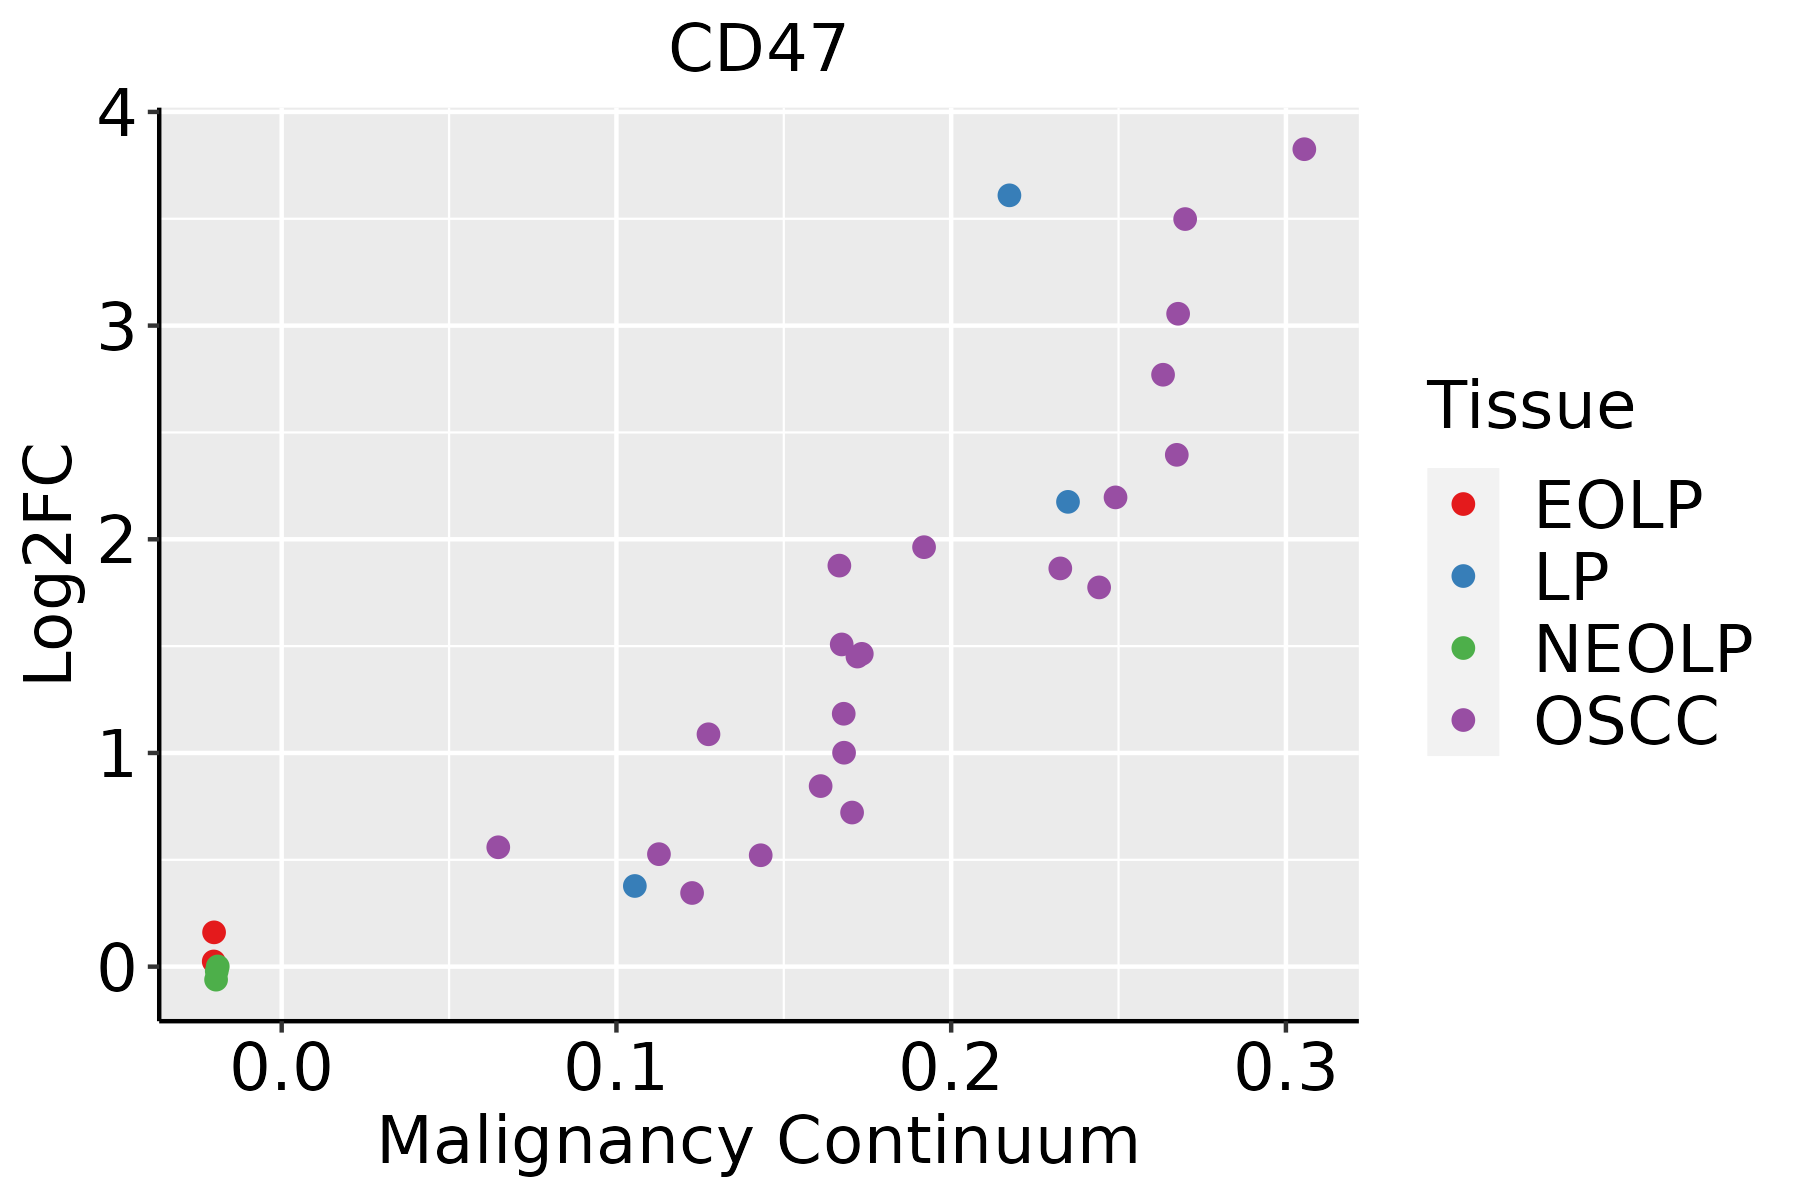 | EOLP: Erosive Oral lichen planus |
| LP: leukoplakia | ||
| NEOLP: Non-erosive oral lichen planus | ||
| OSCC: Oral squamous cell carcinoma | ||
| Prostate |  | BPH: Benign Prostatic Hyperplasia |
| Skin | 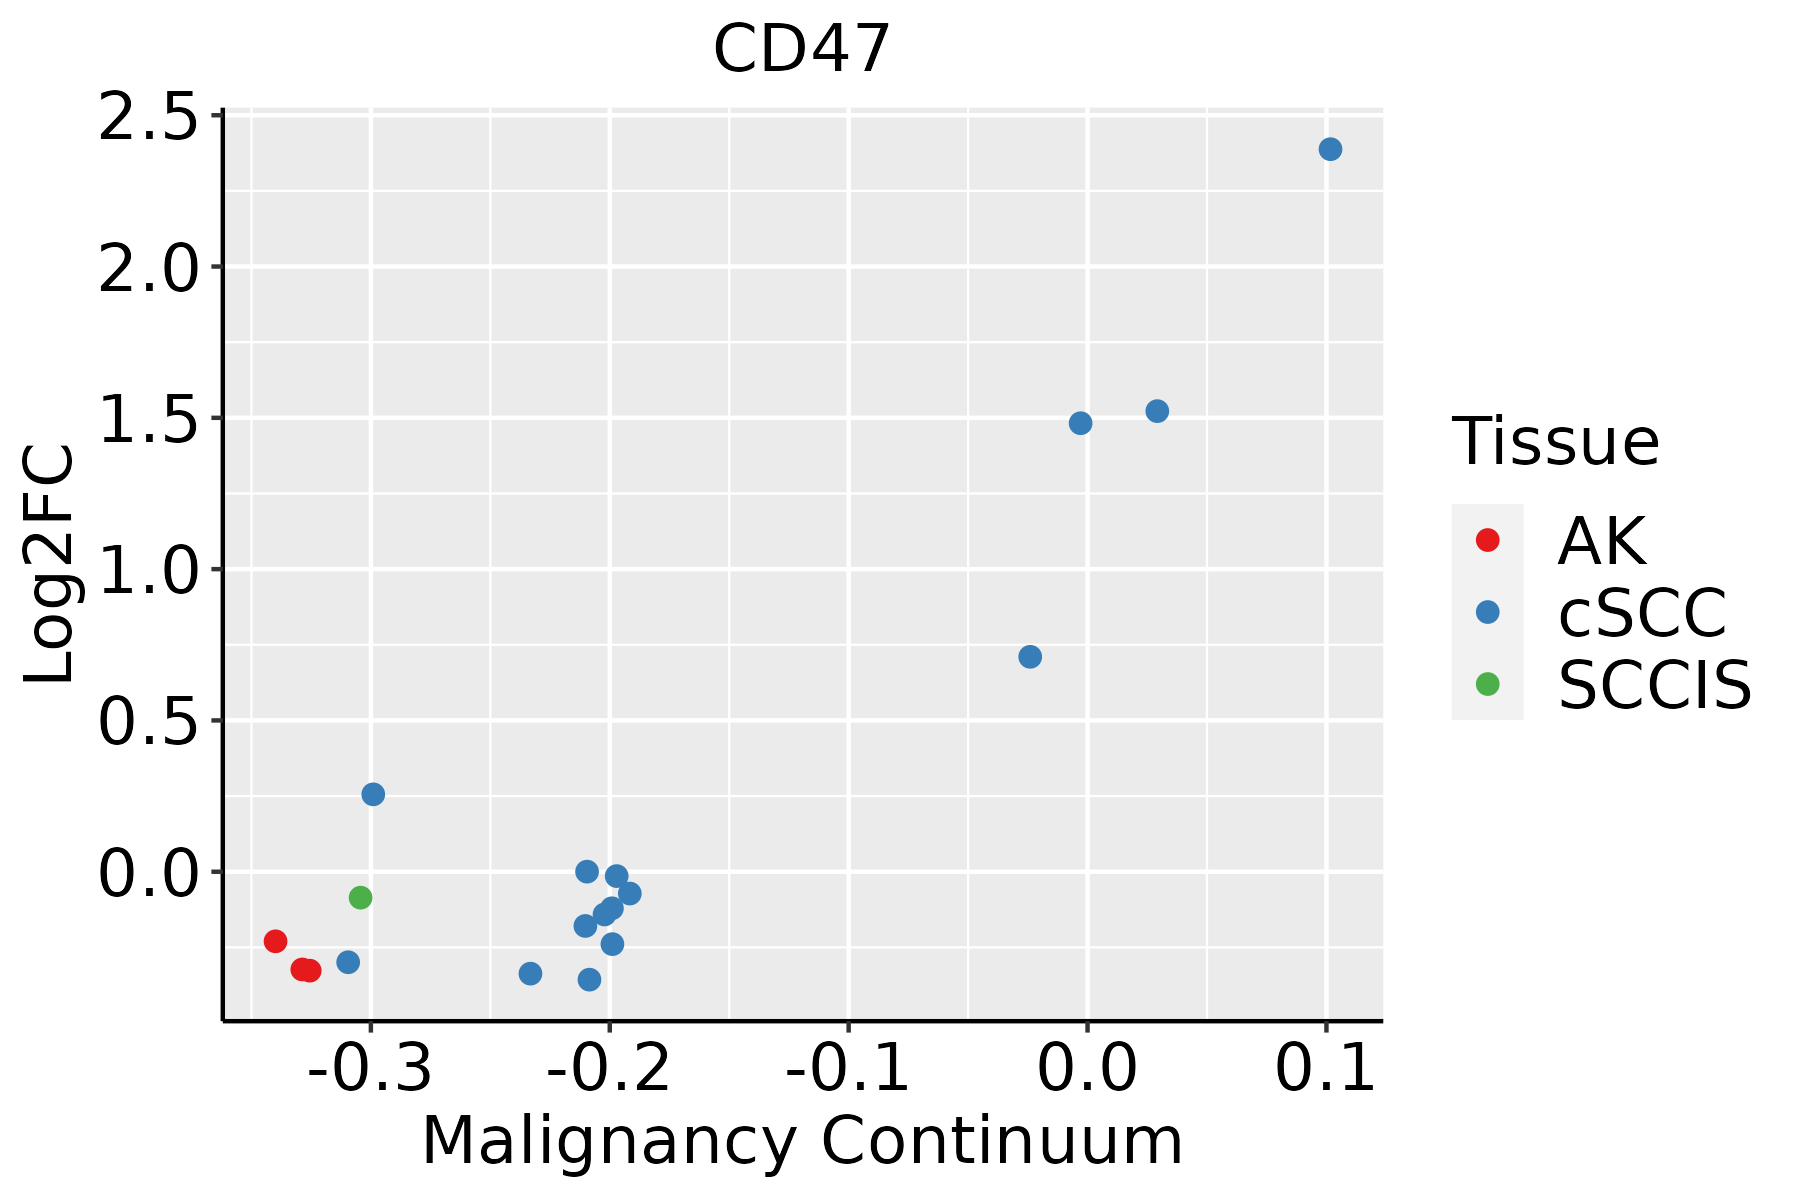 | AK: Actinic keratosis |
| cSCC: Cutaneous squamous cell carcinoma | ||
| SCCIS:squamous cell carcinoma in situ | ||
| Thyroid | 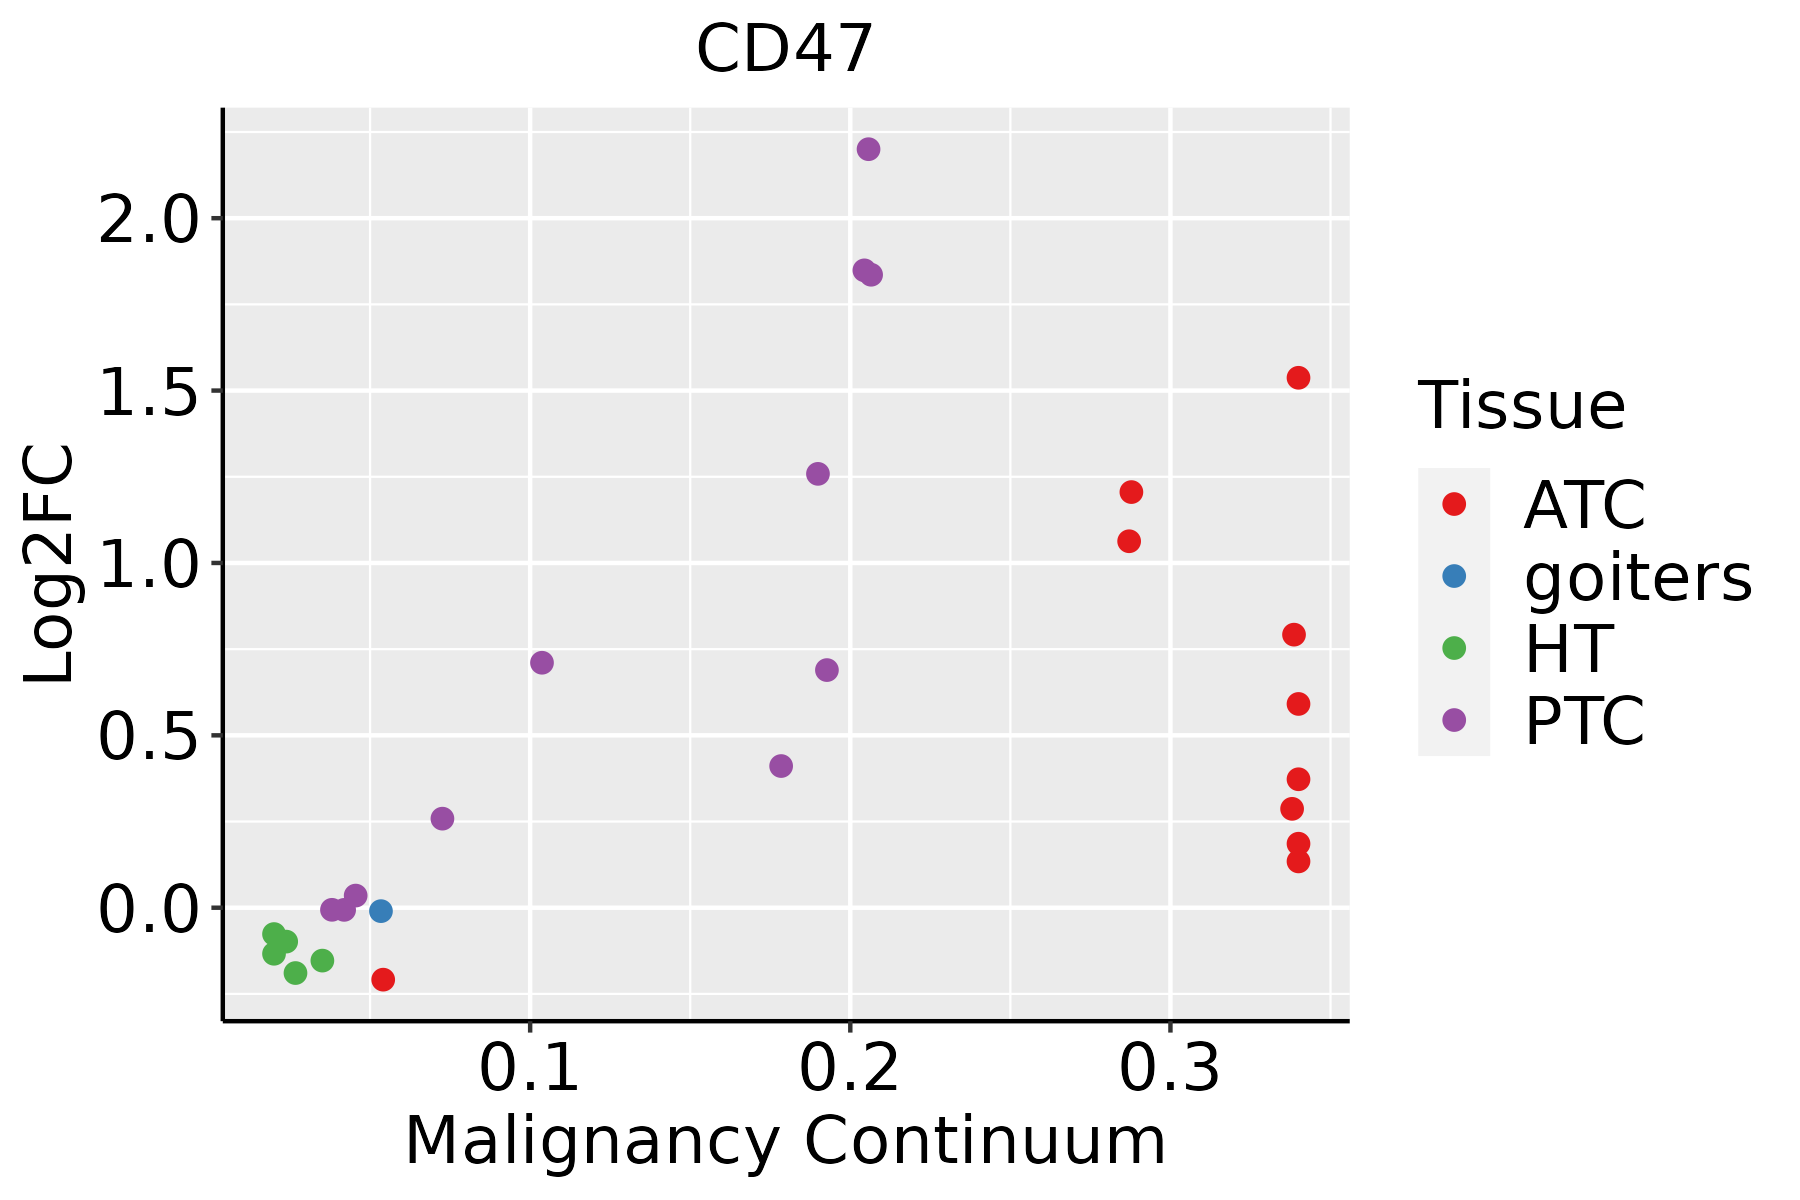 | ATC: Anaplastic thyroid cancer |
| HT: Hashimoto's thyroiditis | ||
| PTC: Papillary thyroid cancer |
| ∗log2FC in expression of this searched gene in stem-like cells from each diseased tissue sample relative to stem-like cells in normal samples in each tissue plotted against the malignancy continuum. Samples are colored based on if they are from different disease stage. |
Top |
Malignant transformation related pathway analysis |
| Find out the enriched GO biological processes and KEGG pathways involved in transition from healthy to precancer to cancer |
| Tissue | Disease Stage | Enriched GO biological Processes |
| Colorectum | AD |  |
| Colorectum | SER |  |
| Colorectum | MSS |  |
| Colorectum | MSI-H |  |
| Colorectum | FAP |  |
| ∗Top 15 enriched GO BP terms are showed in the bar plot of each disease state in each tissue. Each row represents a significant GO biological process which is colored according to the -log10(p.adjust). |
| Page: 1 2 3 4 5 6 7 8 9 |
| GO ID | Tissue | Disease Stage | Description | Gene Ratio | Bg Ratio | pvalue | p.adjust | Count |
| GO:00975297 | Breast | Precancer | myeloid leukocyte migration | 34/1080 | 220/18723 | 1.42e-07 | 7.82e-06 | 34 |
| GO:00509006 | Breast | Precancer | leukocyte migration | 47/1080 | 369/18723 | 2.82e-07 | 1.39e-05 | 47 |
| GO:00457859 | Breast | Precancer | positive regulation of cell adhesion | 52/1080 | 437/18723 | 5.74e-07 | 2.49e-05 | 52 |
| GO:00507293 | Breast | Precancer | positive regulation of inflammatory response | 23/1080 | 142/18723 | 6.51e-06 | 1.81e-04 | 23 |
| GO:0050727 | Breast | Precancer | regulation of inflammatory response | 44/1080 | 386/18723 | 1.26e-05 | 3.22e-04 | 44 |
| GO:00421107 | Breast | Precancer | T cell activation | 52/1080 | 487/18723 | 1.37e-05 | 3.42e-04 | 52 |
| GO:00508707 | Breast | Precancer | positive regulation of T cell activation | 29/1080 | 216/18723 | 1.94e-05 | 4.58e-04 | 29 |
| GO:19029059 | Breast | Precancer | positive regulation of supramolecular fiber organization | 28/1080 | 209/18723 | 2.79e-05 | 6.28e-04 | 28 |
| GO:00321034 | Breast | Precancer | positive regulation of response to external stimulus | 46/1080 | 427/18723 | 3.41e-05 | 7.40e-04 | 46 |
| GO:19029039 | Breast | Precancer | regulation of supramolecular fiber organization | 42/1080 | 383/18723 | 4.92e-05 | 1.04e-03 | 42 |
| GO:19030396 | Breast | Precancer | positive regulation of leukocyte cell-cell adhesion | 30/1080 | 239/18723 | 5.13e-05 | 1.07e-03 | 30 |
| GO:00313493 | Breast | Precancer | positive regulation of defense response | 33/1080 | 278/18723 | 6.79e-05 | 1.36e-03 | 33 |
| GO:00026856 | Breast | Precancer | regulation of leukocyte migration | 27/1080 | 210/18723 | 7.93e-05 | 1.54e-03 | 27 |
| GO:00508637 | Breast | Precancer | regulation of T cell activation | 37/1080 | 329/18723 | 8.04e-05 | 1.56e-03 | 37 |
| GO:00224098 | Breast | Precancer | positive regulation of cell-cell adhesion | 33/1080 | 284/18723 | 1.03e-04 | 1.89e-03 | 33 |
| GO:00071597 | Breast | Precancer | leukocyte cell-cell adhesion | 40/1080 | 371/18723 | 1.07e-04 | 1.94e-03 | 40 |
| GO:00329709 | Breast | Precancer | regulation of actin filament-based process | 42/1080 | 397/18723 | 1.11e-04 | 2.01e-03 | 42 |
| GO:00514959 | Breast | Precancer | positive regulation of cytoskeleton organization | 28/1080 | 226/18723 | 1.13e-04 | 2.04e-03 | 28 |
| GO:00224079 | Breast | Precancer | regulation of cell-cell adhesion | 45/1080 | 448/18723 | 2.12e-04 | 3.30e-03 | 45 |
| GO:19030377 | Breast | Precancer | regulation of leukocyte cell-cell adhesion | 36/1080 | 336/18723 | 2.61e-04 | 3.84e-03 | 36 |
| Page: 1 2 3 4 5 6 7 8 9 10 11 12 13 14 15 16 17 18 19 20 21 22 23 24 25 26 27 28 29 30 31 32 33 34 35 36 37 38 39 40 41 42 |
| Pathway ID | Tissue | Disease Stage | Description | Gene Ratio | Bg Ratio | pvalue | p.adjust | qvalue | Count |
| hsa045124 | Cervix | HSIL_HPV | ECM-receptor interaction | 12/459 | 89/8465 | 2.95e-03 | 1.88e-02 | 1.52e-02 | 12 |
| hsa0451211 | Cervix | HSIL_HPV | ECM-receptor interaction | 12/459 | 89/8465 | 2.95e-03 | 1.88e-02 | 1.52e-02 | 12 |
| hsa045125 | Prostate | BPH | ECM-receptor interaction | 28/1718 | 89/8465 | 8.33e-03 | 2.64e-02 | 1.64e-02 | 28 |
| hsa0451212 | Prostate | BPH | ECM-receptor interaction | 28/1718 | 89/8465 | 8.33e-03 | 2.64e-02 | 1.64e-02 | 28 |
| Page: 1 |
Top |
Cell-cell communication analysis |
| Identification of potential cell-cell interactions between two cell types and their ligand-receptor pairs for different disease states |
| Ligand | Receptor | LRpair | Pathway | Tissue | Disease Stage |
| THBS1 | CD47 | THBS1_CD47 | THBS | Breast | ADJ |
| THBS2 | CD47 | THBS2_CD47 | THBS | Breast | ADJ |
| THBS1 | CD47 | THBS1_CD47 | THBS | Breast | DCIS |
| THBS2 | CD47 | THBS2_CD47 | THBS | Breast | DCIS |
| THBS3 | CD47 | THBS3_CD47 | THBS | Breast | DCIS |
| THBS1 | CD47 | THBS1_CD47 | THBS | Breast | Healthy |
| THBS2 | CD47 | THBS2_CD47 | THBS | Breast | Healthy |
| THBS1 | CD47 | THBS1_CD47 | THBS | Breast | IDC |
| THBS2 | CD47 | THBS2_CD47 | THBS | Breast | IDC |
| COMP | CD47 | COMP_CD47 | THBS | Breast | IDC |
| THBS1 | CD47 | THBS1_CD47 | THBS | Breast | Precancer |
| THBS2 | CD47 | THBS2_CD47 | THBS | Breast | Precancer |
| THBS1 | CD47 | THBS1_CD47 | THBS | Cervix | ADJ |
| THBS2 | CD47 | THBS2_CD47 | THBS | Cervix | ADJ |
| THBS1 | CD47 | THBS1_CD47 | THBS | Cervix | CC |
| THBS2 | CD47 | THBS2_CD47 | THBS | Cervix | CC |
| THBS1 | CD47 | THBS1_CD47 | THBS | Cervix | Healthy |
| THBS2 | CD47 | THBS2_CD47 | THBS | Cervix | Healthy |
| THBS1 | CD47 | THBS1_CD47 | THBS | Cervix | Precancer |
| THBS2 | CD47 | THBS2_CD47 | THBS | Cervix | Precancer |
| Page: 1 |
Top |
Single-cell gene regulatory network inference analysis |
| Find out the significant the regulons (TFs) and the target genes of each regulon across cell types for different disease states |
| TF | Cell Type | Tissue | Disease Stage | Target Gene | RSS | Regulon Activity |
| ∗The dot plots of a searched regulon are shown for all cell subpopulations in each disease state of each tissue based on the regulon specific score inferred using pySCENIC and by calculating the average expression. |
| Page: 1 |
Top |
Somatic mutation of malignant transformation related genes |
| Annotation of somatic variants for genes involved in malignant transformation |
| Hugo Symbol | Variant Class | Variant Classification | dbSNP RS | HGVSc | HGVSp | HGVSp Short | SWISSPROT | BIOTYPE | SIFT | PolyPhen | Tumor Sample Barcode | Tissue | Histology | Sex | Age | Stage | Therapy Types | Drugs | Outcome |
| CD47 | SNV | Missense_Mutation | c.352N>C | p.Glu118Gln | p.E118Q | Q08722 | protein_coding | deleterious(0.03) | probably_damaging(0.998) | TCGA-AC-A23H-01 | Breast | breast invasive carcinoma | Female | >=65 | I/II | Unknown | Unknown | PD | |
| CD47 | SNV | Missense_Mutation | c.640N>C | p.Val214Leu | p.V214L | Q08722 | protein_coding | deleterious(0) | possibly_damaging(0.813) | TCGA-D8-A13Z-01 | Breast | breast invasive carcinoma | Female | <65 | I/II | Chemotherapy | doxorubicine | SD | |
| CD47 | SNV | Missense_Mutation | novel | c.922N>A | p.Glu308Lys | p.E308K | Q08722 | protein_coding | deleterious(0.03) | probably_damaging(0.991) | TCGA-C5-A1MH-01 | Cervix | cervical & endocervical cancer | Female | >=65 | III/IV | Chemotherapy | cisplatin | PD |
| CD47 | SNV | Missense_Mutation | novel | c.459N>G | p.Ile153Met | p.I153M | Q08722 | protein_coding | deleterious(0) | possibly_damaging(0.77) | TCGA-AA-3947-01 | Colorectum | colon adenocarcinoma | Female | <65 | I/II | Unknown | Unknown | SD |
| CD47 | SNV | Missense_Mutation | c.643A>T | p.Thr215Ser | p.T215S | Q08722 | protein_coding | deleterious(0) | benign(0.296) | TCGA-AA-A010-01 | Colorectum | colon adenocarcinoma | Female | <65 | I/II | Chemotherapy | folinic | CR | |
| CD47 | SNV | Missense_Mutation | c.942N>C | p.Lys314Asn | p.K314N | Q08722 | protein_coding | deleterious_low_confidence(0) | probably_damaging(0.996) | TCGA-AA-A022-01 | Colorectum | colon adenocarcinoma | Female | >=65 | I/II | Unknown | Unknown | SD | |
| CD47 | SNV | Missense_Mutation | novel | c.71N>C | p.Lys24Thr | p.K24T | Q08722 | protein_coding | tolerated(0.59) | benign(0.021) | TCGA-CA-6717-01 | Colorectum | colon adenocarcinoma | Male | <65 | I/II | Chemotherapy | oxaliplatin | CR |
| CD47 | SNV | Missense_Mutation | c.478T>C | p.Phe160Leu | p.F160L | Q08722 | protein_coding | tolerated(0.64) | benign(0.272) | TCGA-CL-4957-01 | Colorectum | rectum adenocarcinoma | Female | >=65 | III/IV | Chemotherapy | oxaliplatin | SD | |
| CD47 | SNV | Missense_Mutation | novel | c.692N>T | p.Ala231Val | p.A231V | Q08722 | protein_coding | tolerated(0.71) | benign(0.185) | TCGA-A5-A0G2-01 | Endometrium | uterine corpus endometrioid carcinoma | Female | <65 | III/IV | Unknown | Unknown | SD |
| CD47 | SNV | Missense_Mutation | rs754405285 | c.785N>T | p.Ala262Val | p.A262V | Q08722 | protein_coding | tolerated(0.07) | benign(0.012) | TCGA-AP-A059-01 | Endometrium | uterine corpus endometrioid carcinoma | Female | >=65 | I/II | Unknown | Unknown | SD |
| Page: 1 2 3 4 |
Top |
Related drugs of malignant transformation related genes |
| Identification of chemicals and drugs interact with genes involved in malignant transfromation |
| (DGIdb 4.0) |
| Entrez ID | Symbol | Category | Interaction Types | Drug Claim Name | Drug Name | PMIDs |
| 961 | CD47 | DRUGGABLE GENOME, EXTERNAL SIDE OF PLASMA MEMBRANE, CELL SURFACE | ABT-510 | ABT-510 | ||
| 961 | CD47 | DRUGGABLE GENOME, EXTERNAL SIDE OF PLASMA MEMBRANE, CELL SURFACE | ALX148 | ALX-148 | ||
| 961 | CD47 | DRUGGABLE GENOME, EXTERNAL SIDE OF PLASMA MEMBRANE, CELL SURFACE | TTI-621 | |||
| 961 | CD47 | DRUGGABLE GENOME, EXTERNAL SIDE OF PLASMA MEMBRANE, CELL SURFACE | CC-90002 | |||
| 961 | CD47 | DRUGGABLE GENOME, EXTERNAL SIDE OF PLASMA MEMBRANE, CELL SURFACE | Hu5F9-G4 | MAGROLIMAB |
| Page: 1 |

Copyright 2023-Present -The University of Texas Health Science Center at Houston |