
|
|||||
|
 | |
| |
| |
| |
| |
| |
|
Gene: CD44 |
Gene summary for CD44 |
| Gene information | Species | Human | Gene symbol | CD44 | Gene ID | 960 |
| Gene name | CD44 molecule (Indian blood group) | |
| Gene Alias | CDW44 | |
| Cytomap | 11p13 | |
| Gene Type | protein-coding | GO ID | GO:0000165 | UniProtAcc | P16070 |
Top |
Malignant transformation analysis |
| Identification of the aberrant gene expression in precancerous and cancerous lesions by comparing the gene expression of stem-like cells in diseased tissues with normal stem cells |
| Entrez ID | Symbol | Replicates | Species | Organ | Tissue | Adj P-value | Log2FC | Malignancy |
| 960 | CD44 | GSM4909285 | Human | Breast | IDC | 1.03e-17 | -5.71e-01 | 0.21 |
| 960 | CD44 | GSM4909286 | Human | Breast | IDC | 7.60e-10 | -1.17e-01 | 0.1081 |
| 960 | CD44 | GSM4909288 | Human | Breast | IDC | 4.98e-02 | -5.00e-01 | 0.0988 |
| 960 | CD44 | GSM4909291 | Human | Breast | IDC | 1.40e-12 | -6.15e-01 | 0.1753 |
| 960 | CD44 | GSM4909292 | Human | Breast | IDC | 2.72e-02 | -6.83e-01 | 0.1236 |
| 960 | CD44 | GSM4909293 | Human | Breast | IDC | 1.22e-09 | -4.57e-01 | 0.1581 |
| 960 | CD44 | GSM4909294 | Human | Breast | IDC | 1.34e-10 | -6.20e-01 | 0.2022 |
| 960 | CD44 | GSM4909295 | Human | Breast | IDC | 2.08e-02 | 3.57e-01 | 0.0898 |
| 960 | CD44 | GSM4909296 | Human | Breast | IDC | 6.36e-33 | -7.72e-01 | 0.1524 |
| 960 | CD44 | GSM4909297 | Human | Breast | IDC | 6.29e-09 | -3.67e-01 | 0.1517 |
| 960 | CD44 | GSM4909298 | Human | Breast | IDC | 1.28e-34 | 5.61e-01 | 0.1551 |
| 960 | CD44 | GSM4909311 | Human | Breast | IDC | 1.80e-35 | -7.12e-01 | 0.1534 |
| 960 | CD44 | GSM4909312 | Human | Breast | IDC | 2.01e-37 | -8.00e-01 | 0.1552 |
| 960 | CD44 | GSM4909316 | Human | Breast | IDC | 9.60e-06 | -5.96e-01 | 0.21 |
| 960 | CD44 | GSM4909317 | Human | Breast | IDC | 8.92e-03 | -3.41e-01 | 0.1355 |
| 960 | CD44 | GSM4909318 | Human | Breast | IDC | 4.72e-04 | -6.54e-01 | 0.2031 |
| 960 | CD44 | GSM4909319 | Human | Breast | IDC | 1.49e-42 | -6.29e-01 | 0.1563 |
| 960 | CD44 | GSM4909320 | Human | Breast | IDC | 1.09e-17 | -8.07e-01 | 0.1575 |
| 960 | CD44 | GSM4909321 | Human | Breast | IDC | 3.24e-28 | -7.02e-01 | 0.1559 |
| 960 | CD44 | ctrl6 | Human | Breast | Precancer | 4.22e-09 | 5.44e-01 | -0.0061 |
| Page: 1 2 3 4 5 6 7 8 9 10 11 12 13 |
| Tissue | Expression Dynamics | Abbreviation |
| Breast |  | IDC: Invasive ductal carcinoma |
| DCIS: Ductal carcinoma in situ | ||
| Precancer(BRCA1-mut): Precancerous lesion from BRCA1 mutation carriers | ||
| Cervix | 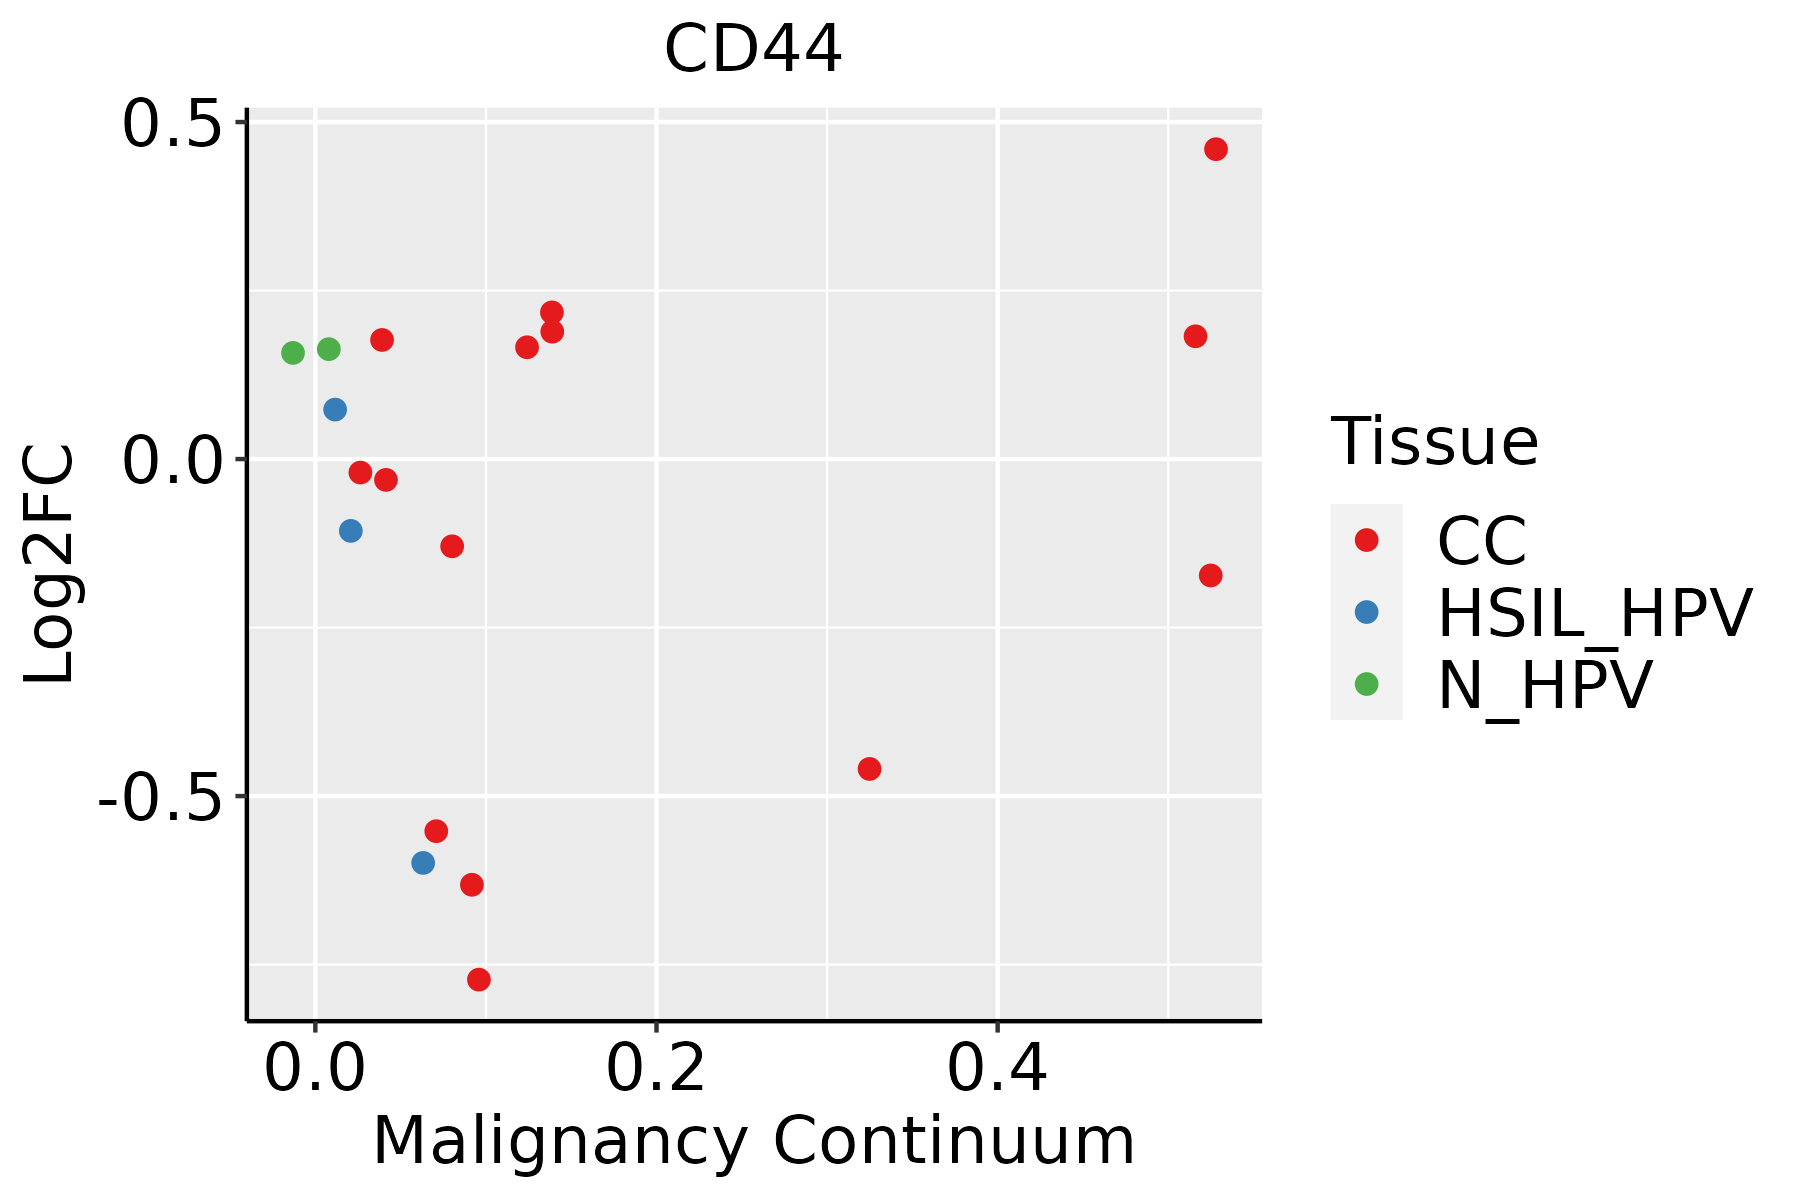 | CC: Cervix cancer |
| HSIL_HPV: HPV-infected high-grade squamous intraepithelial lesions | ||
| N_HPV: HPV-infected normal cervix | ||
| Colorectum (GSE201348) |  | FAP: Familial adenomatous polyposis |
| CRC: Colorectal cancer | ||
| Colorectum (HTA11) |  | AD: Adenomas |
| SER: Sessile serrated lesions | ||
| MSI-H: Microsatellite-high colorectal cancer | ||
| MSS: Microsatellite stable colorectal cancer | ||
| Endometrium | 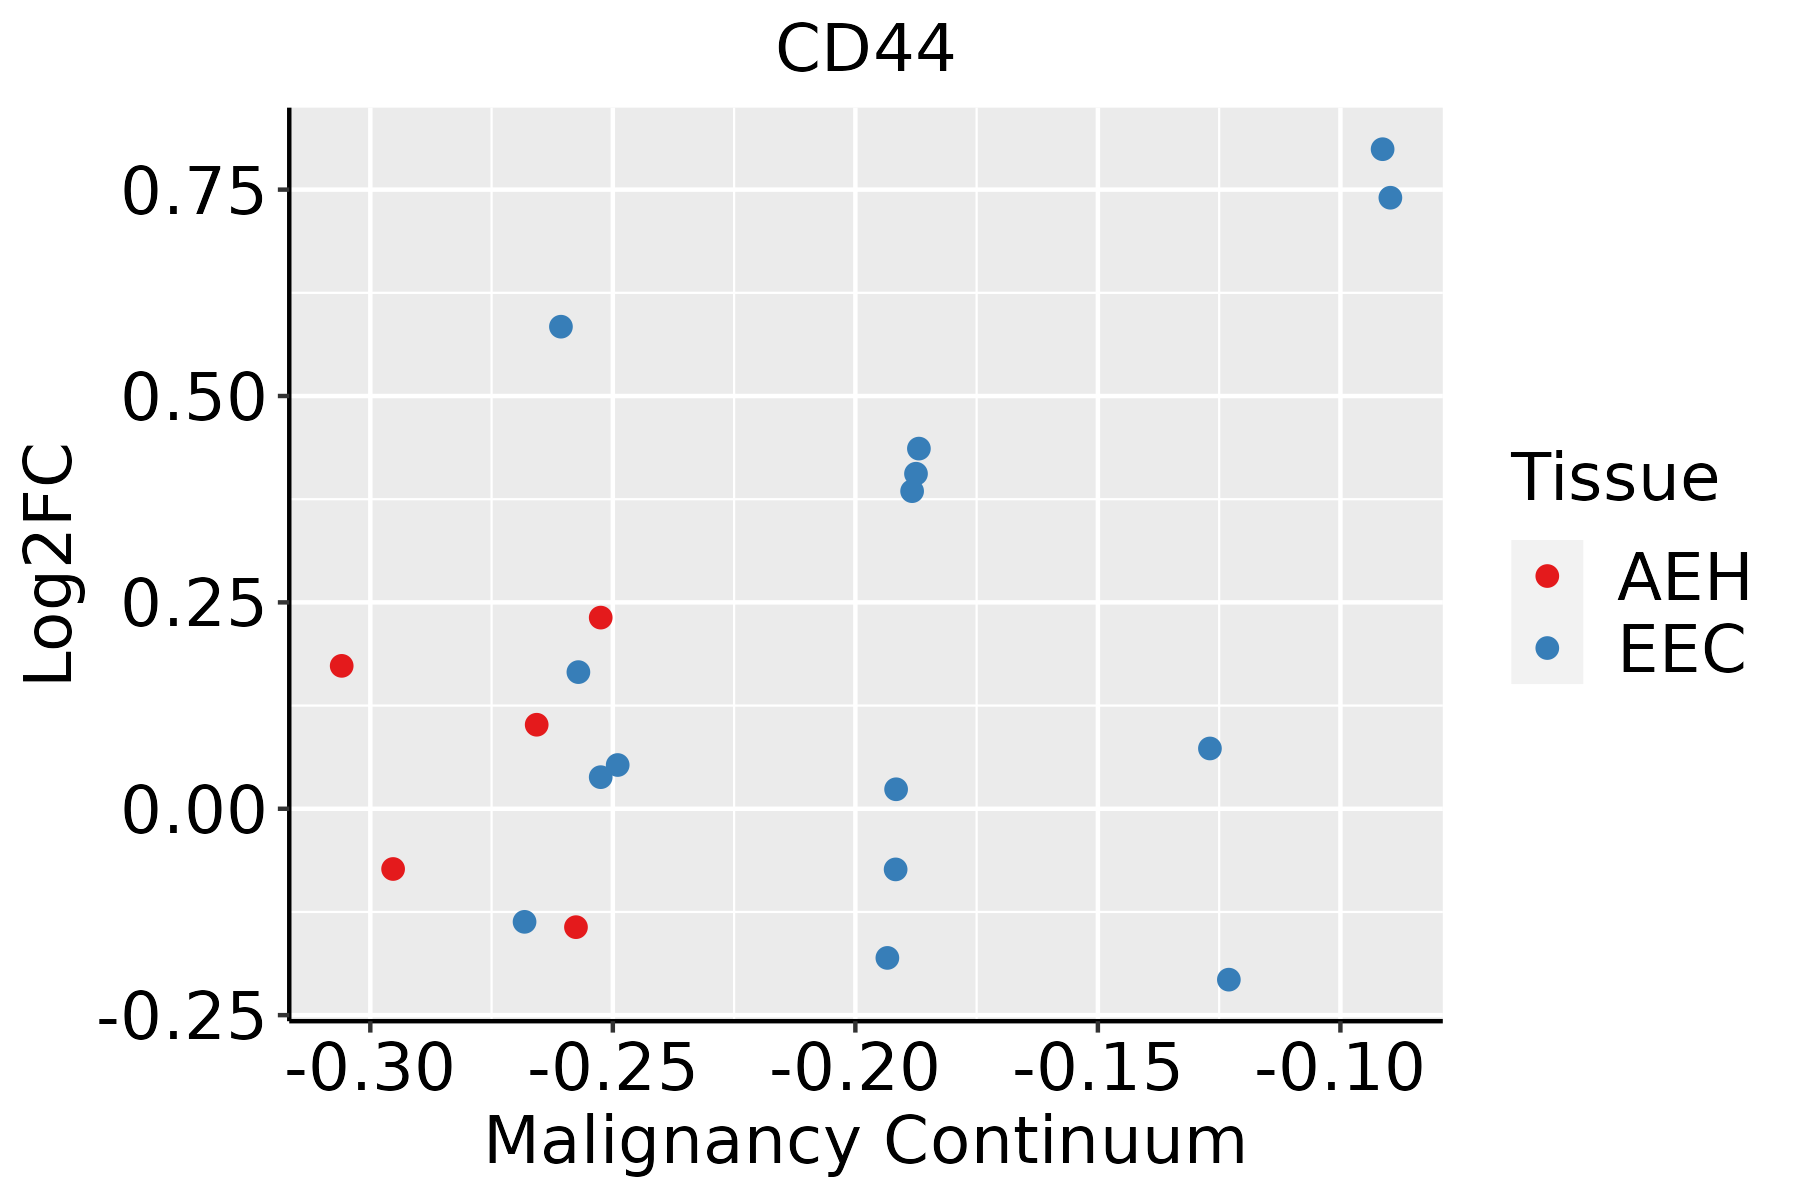 | AEH: Atypical endometrial hyperplasia |
| EEC: Endometrioid Cancer | ||
| Esophagus | 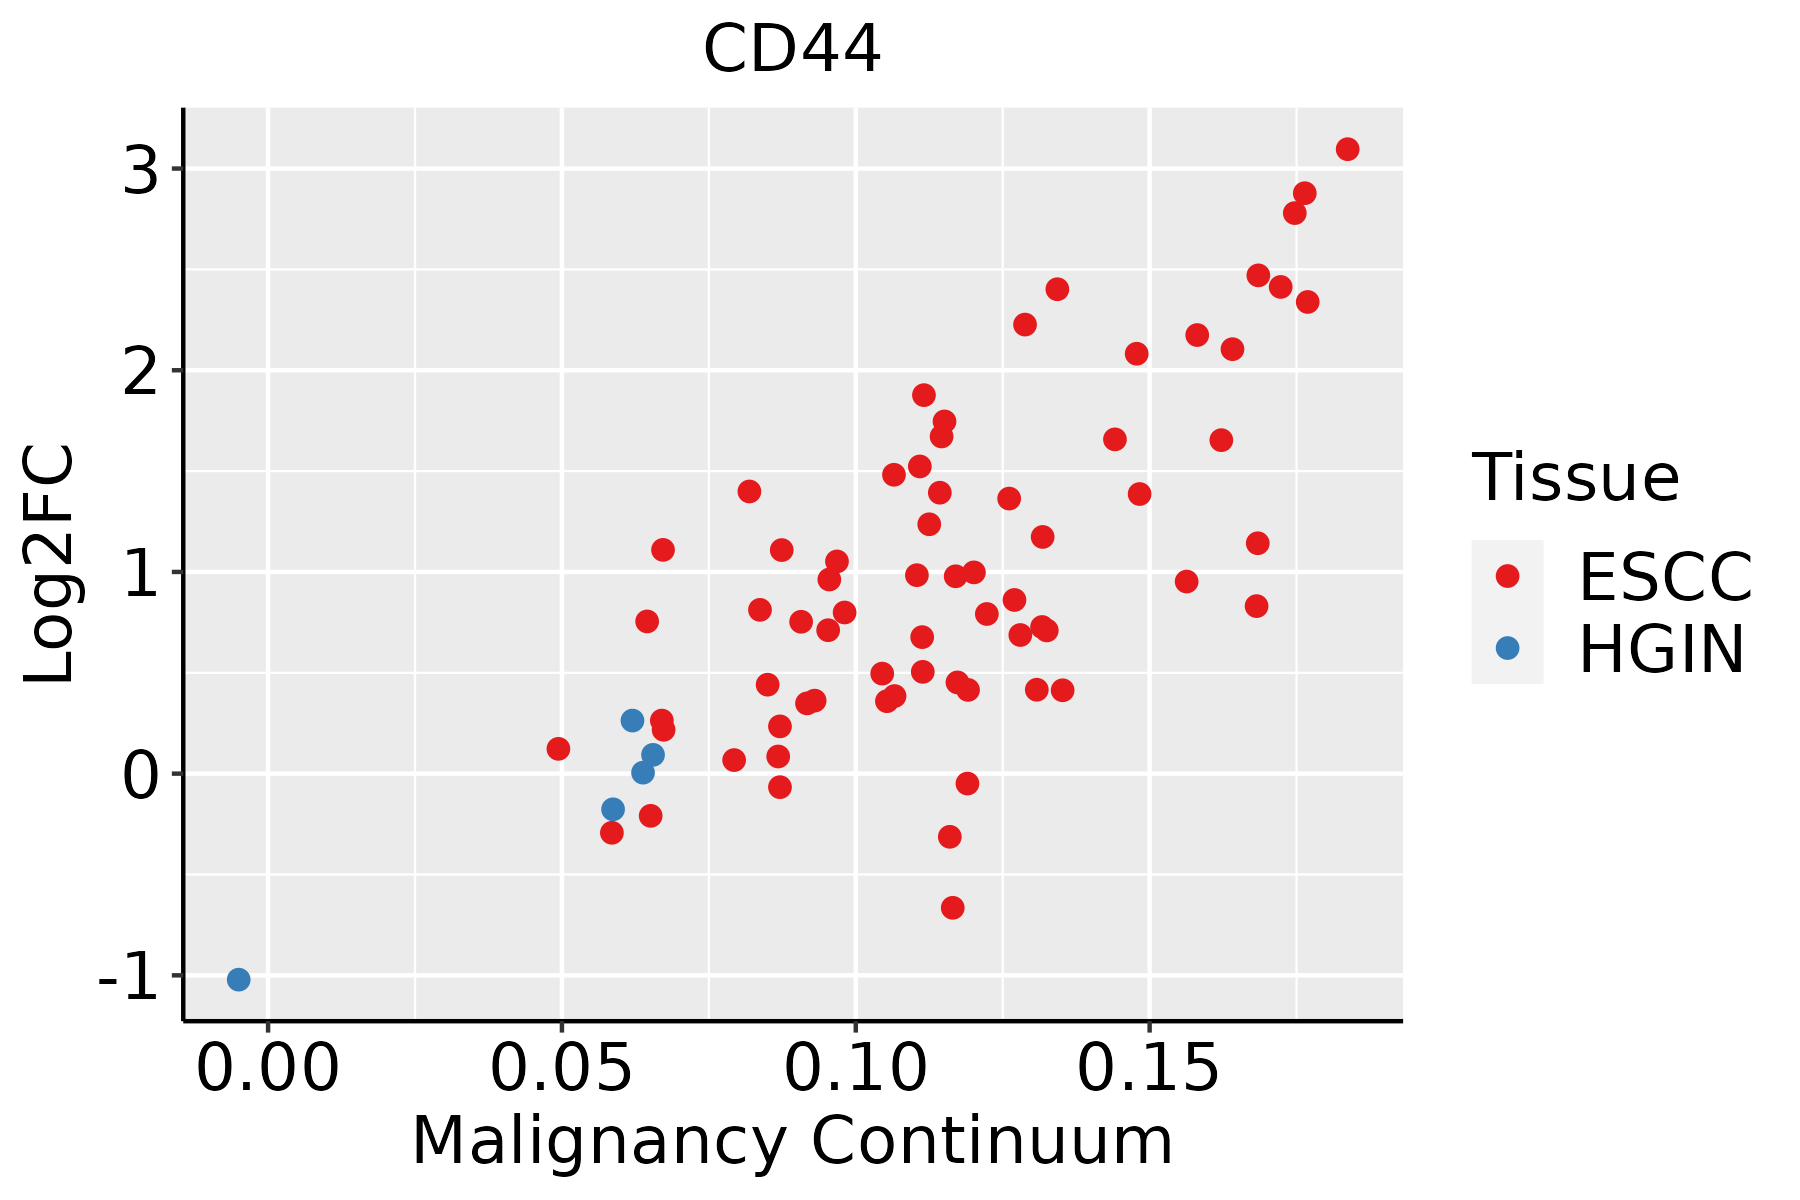 | ESCC: Esophageal squamous cell carcinoma |
| HGIN: High-grade intraepithelial neoplasias | ||
| LGIN: Low-grade intraepithelial neoplasias | ||
| Liver | 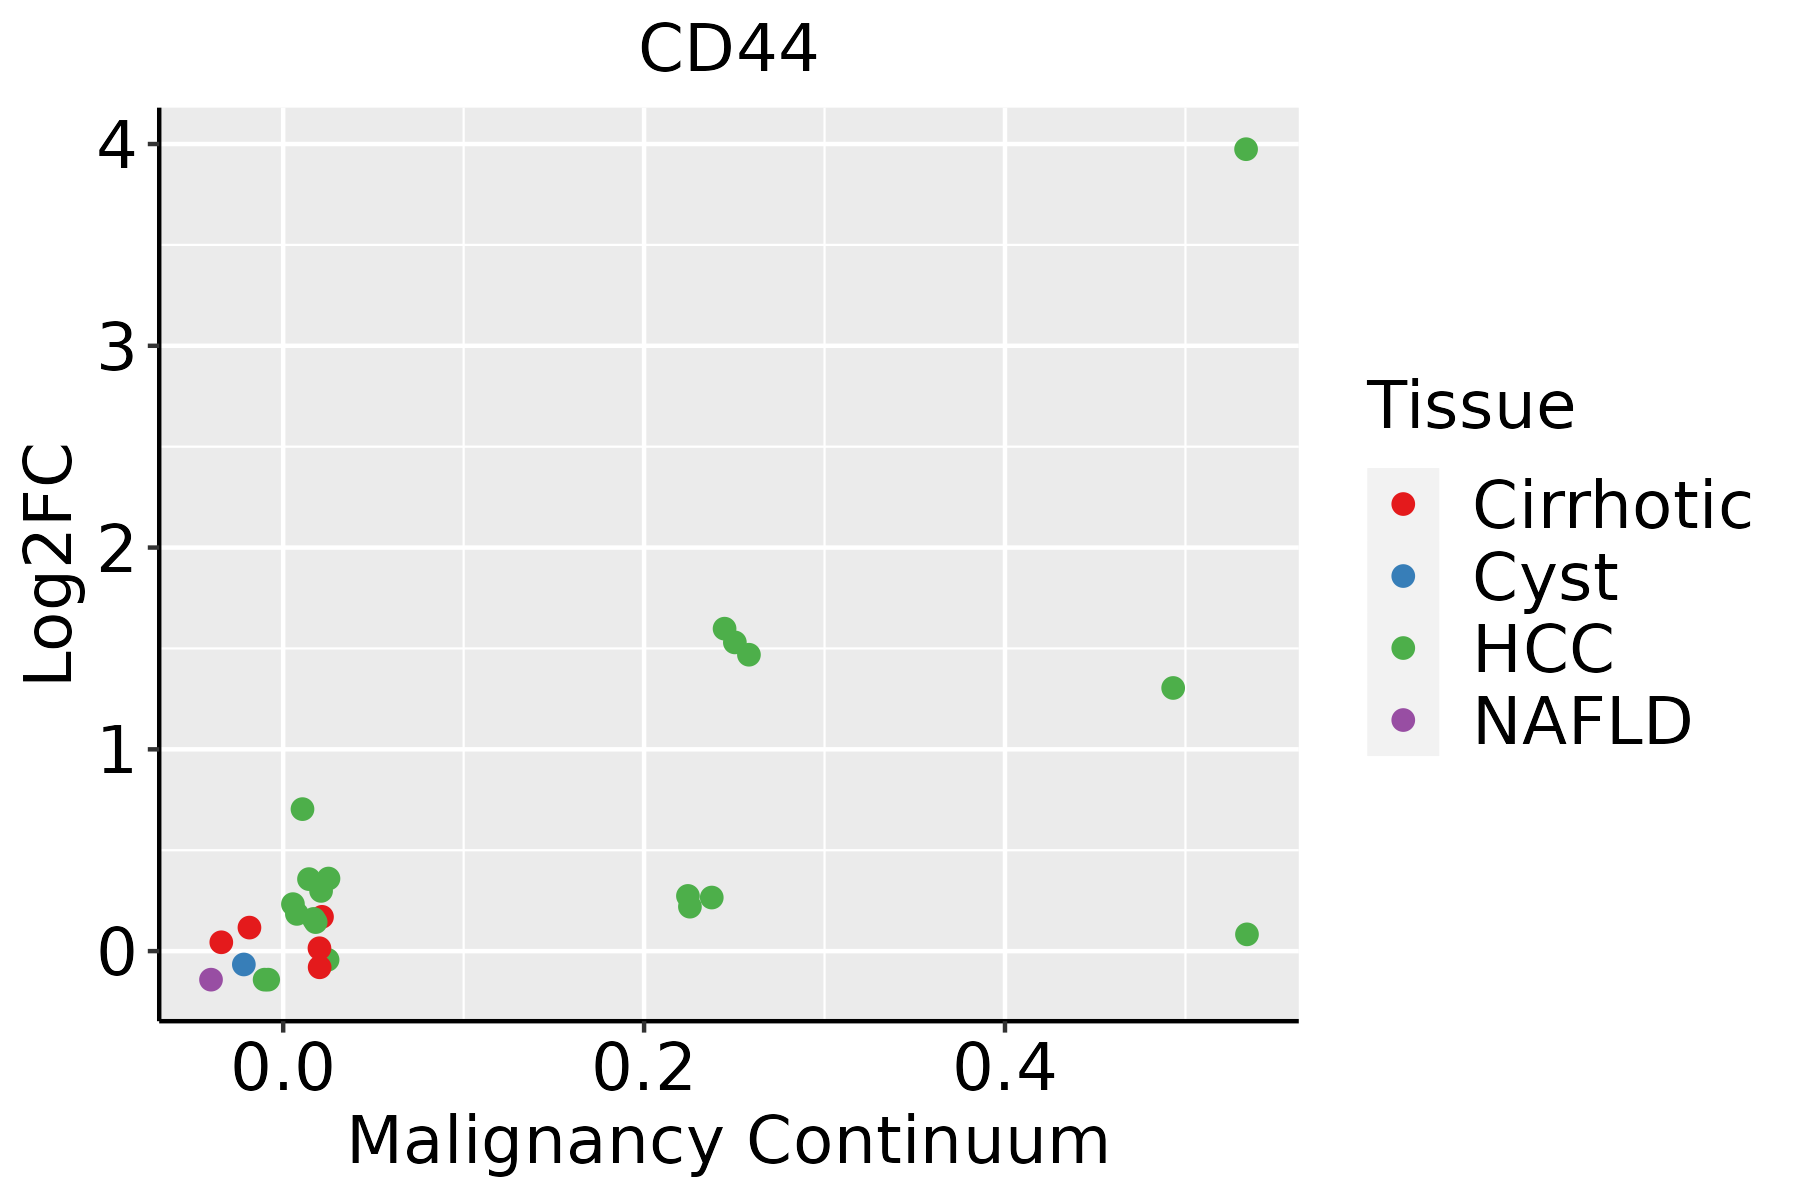 | HCC: Hepatocellular carcinoma |
| NAFLD: Non-alcoholic fatty liver disease | ||
| Lung |  | AAH: Atypical adenomatous hyperplasia |
| AIS: Adenocarcinoma in situ | ||
| IAC: Invasive lung adenocarcinoma | ||
| MIA: Minimally invasive adenocarcinoma | ||
| Oral Cavity | 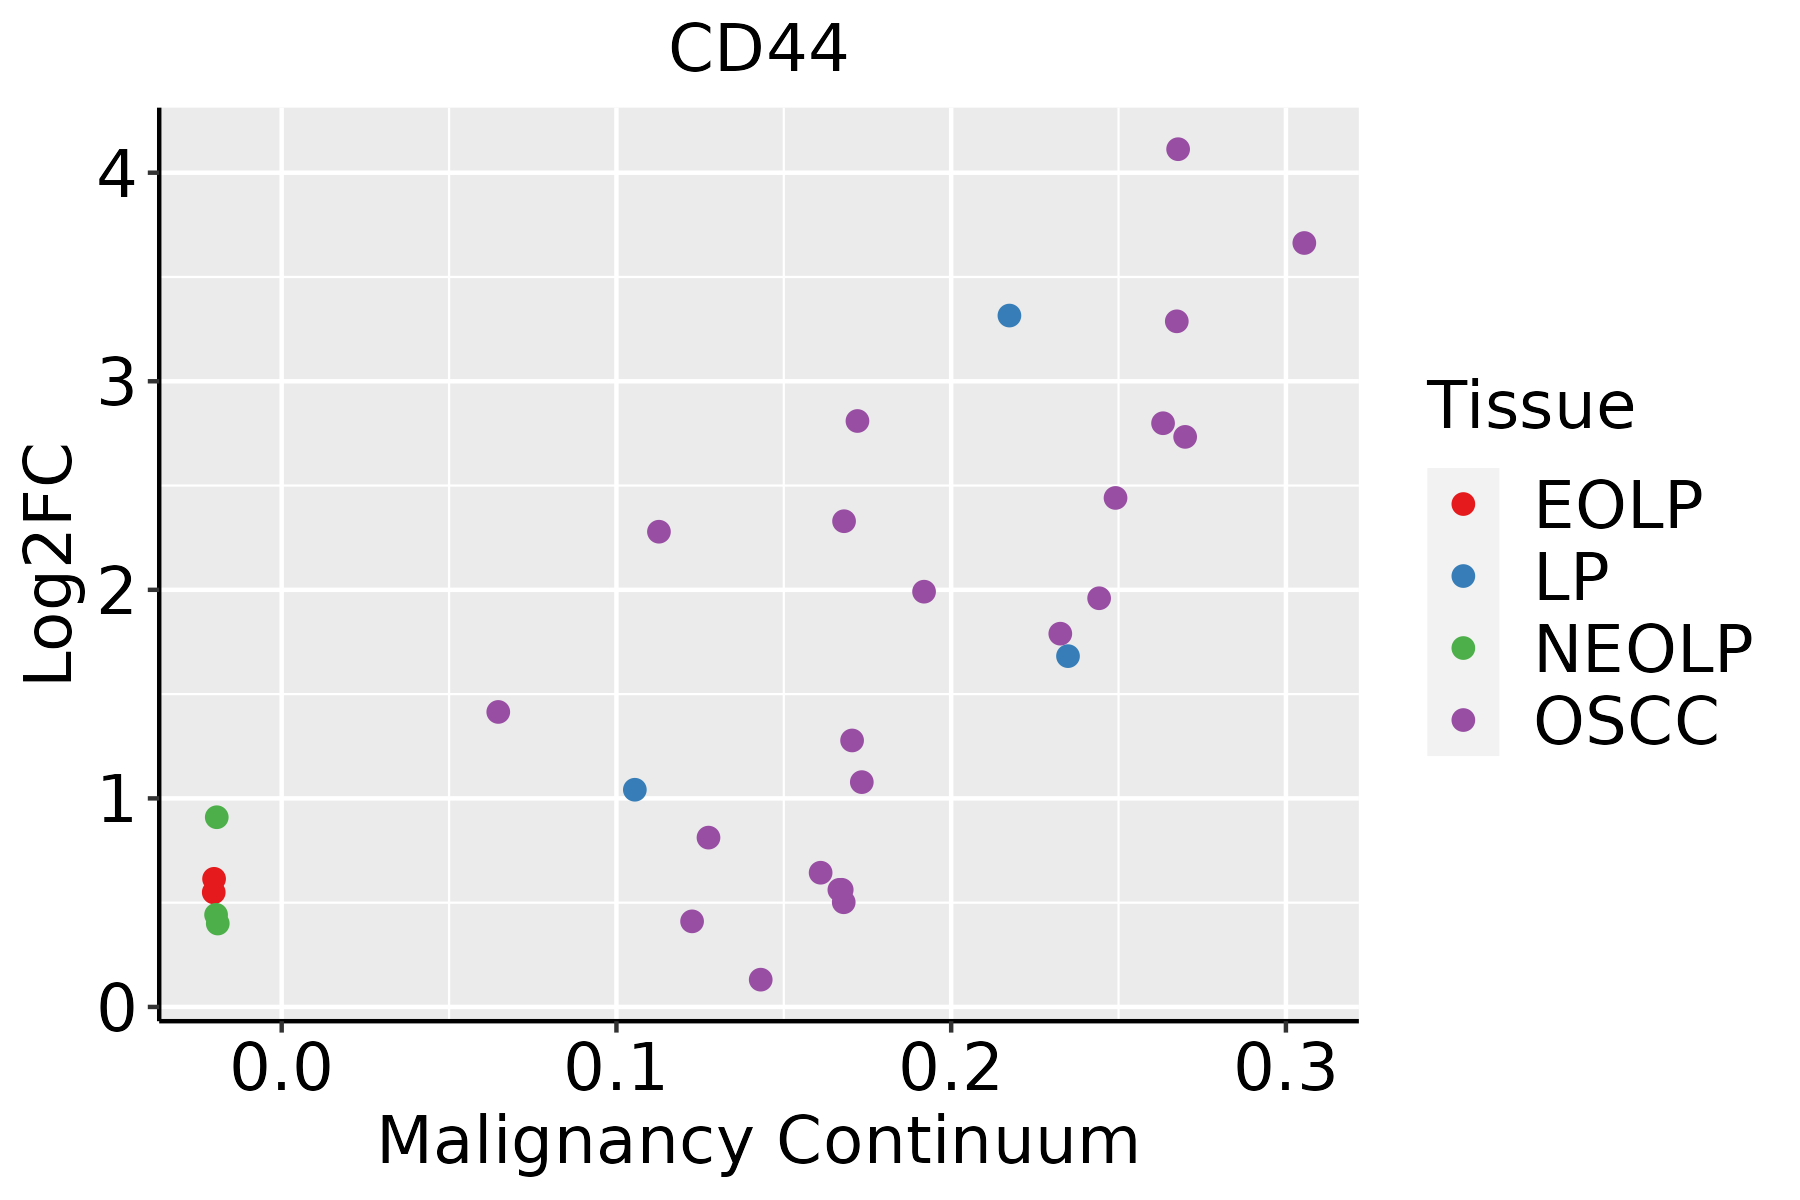 | EOLP: Erosive Oral lichen planus |
| LP: leukoplakia | ||
| NEOLP: Non-erosive oral lichen planus | ||
| OSCC: Oral squamous cell carcinoma | ||
| Prostate |  | BPH: Benign Prostatic Hyperplasia |
| Skin | 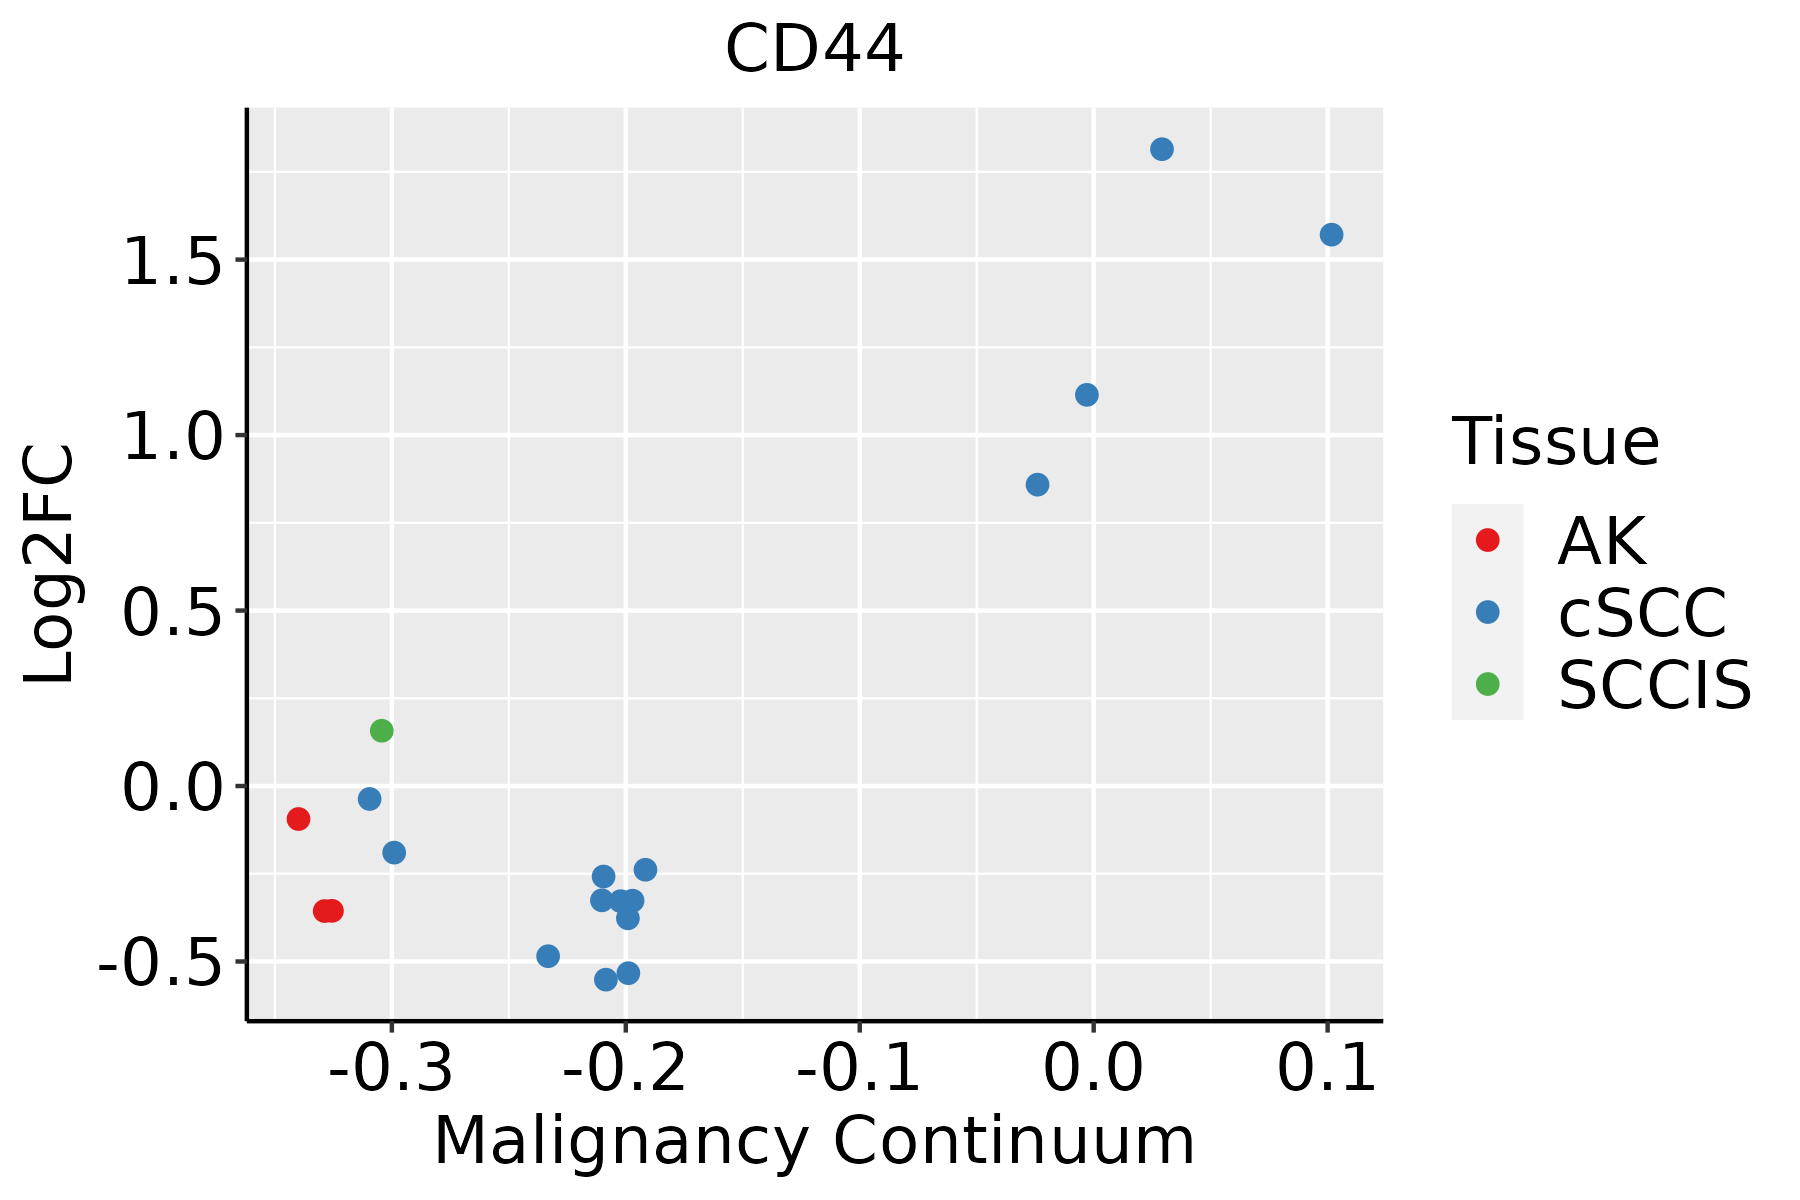 | AK: Actinic keratosis |
| cSCC: Cutaneous squamous cell carcinoma | ||
| SCCIS:squamous cell carcinoma in situ | ||
| Thyroid |  | ATC: Anaplastic thyroid cancer |
| HT: Hashimoto's thyroiditis | ||
| PTC: Papillary thyroid cancer |
| ∗log2FC in expression of this searched gene in stem-like cells from each diseased tissue sample relative to stem-like cells in normal samples in each tissue plotted against the malignancy continuum. Samples are colored based on if they are from different disease stage. |
Top |
Malignant transformation related pathway analysis |
| Find out the enriched GO biological processes and KEGG pathways involved in transition from healthy to precancer to cancer |
| Tissue | Disease Stage | Enriched GO biological Processes |
| Colorectum | AD |  |
| Colorectum | SER |  |
| Colorectum | MSS |  |
| Colorectum | MSI-H |  |
| Colorectum | FAP |  |
| ∗Top 15 enriched GO BP terms are showed in the bar plot of each disease state in each tissue. Each row represents a significant GO biological process which is colored according to the -log10(p.adjust). |
| Page: 1 2 3 4 5 6 7 8 9 |
| GO ID | Tissue | Disease Stage | Description | Gene Ratio | Bg Ratio | pvalue | p.adjust | Count |
| GO:00971939 | Breast | Precancer | intrinsic apoptotic signaling pathway | 59/1080 | 288/18723 | 8.07e-18 | 3.60e-15 | 59 |
| GO:20012339 | Breast | Precancer | regulation of apoptotic signaling pathway | 65/1080 | 356/18723 | 7.70e-17 | 3.17e-14 | 65 |
| GO:20012429 | Breast | Precancer | regulation of intrinsic apoptotic signaling pathway | 41/1080 | 164/18723 | 6.48e-16 | 2.31e-13 | 41 |
| GO:00525479 | Breast | Precancer | regulation of peptidase activity | 71/1080 | 461/18723 | 2.72e-14 | 6.94e-12 | 71 |
| GO:00525489 | Breast | Precancer | regulation of endopeptidase activity | 67/1080 | 432/18723 | 1.06e-13 | 2.36e-11 | 67 |
| GO:20001169 | Breast | Precancer | regulation of cysteine-type endopeptidase activity | 43/1080 | 235/18723 | 1.30e-11 | 1.83e-09 | 43 |
| GO:00432819 | Breast | Precancer | regulation of cysteine-type endopeptidase activity involved in apoptotic process | 40/1080 | 209/18723 | 1.59e-11 | 2.07e-09 | 40 |
| GO:20012349 | Breast | Precancer | negative regulation of apoptotic signaling pathway | 39/1080 | 224/18723 | 5.35e-10 | 4.77e-08 | 39 |
| GO:00458619 | Breast | Precancer | negative regulation of proteolysis | 50/1080 | 351/18723 | 2.99e-09 | 2.39e-07 | 50 |
| GO:20012439 | Breast | Precancer | negative regulation of intrinsic apoptotic signaling pathway | 23/1080 | 98/18723 | 5.82e-09 | 4.45e-07 | 23 |
| GO:00513468 | Breast | Precancer | negative regulation of hydrolase activity | 50/1080 | 379/18723 | 3.85e-08 | 2.34e-06 | 50 |
| GO:00104668 | Breast | Precancer | negative regulation of peptidase activity | 38/1080 | 262/18723 | 1.46e-07 | 7.82e-06 | 38 |
| GO:00109519 | Breast | Precancer | negative regulation of endopeptidase activity | 37/1080 | 252/18723 | 1.55e-07 | 8.05e-06 | 37 |
| GO:20001179 | Breast | Precancer | negative regulation of cysteine-type endopeptidase activity | 19/1080 | 86/18723 | 3.36e-07 | 1.58e-05 | 19 |
| GO:00457859 | Breast | Precancer | positive regulation of cell adhesion | 52/1080 | 437/18723 | 5.74e-07 | 2.49e-05 | 52 |
| GO:19017969 | Breast | Precancer | regulation of signal transduction by p53 class mediator | 19/1080 | 93/18723 | 1.20e-06 | 4.60e-05 | 19 |
| GO:00431548 | Breast | Precancer | negative regulation of cysteine-type endopeptidase activity involved in apoptotic process | 17/1080 | 78/18723 | 1.69e-06 | 6.08e-05 | 17 |
| GO:00723319 | Breast | Precancer | signal transduction by p53 class mediator | 26/1080 | 163/18723 | 2.23e-06 | 7.76e-05 | 26 |
| GO:00420609 | Breast | Precancer | wound healing | 48/1080 | 422/18723 | 5.48e-06 | 1.63e-04 | 48 |
| GO:00723328 | Breast | Precancer | intrinsic apoptotic signaling pathway by p53 class mediator | 16/1080 | 76/18723 | 5.49e-06 | 1.63e-04 | 16 |
| Page: 1 2 3 4 5 6 7 8 9 10 11 12 13 14 15 16 17 18 19 20 21 22 23 24 25 26 27 28 29 30 31 32 33 34 35 36 37 38 39 40 41 42 43 44 45 46 47 48 49 50 51 52 53 54 55 56 57 58 59 60 61 |
| Pathway ID | Tissue | Disease Stage | Description | Gene Ratio | Bg Ratio | pvalue | p.adjust | qvalue | Count |
| hsa0513118 | Breast | Precancer | Shigellosis | 44/684 | 247/8465 | 3.91e-07 | 6.86e-06 | 5.26e-06 | 44 |
| hsa0516918 | Breast | Precancer | Epstein-Barr virus infection | 35/684 | 202/8465 | 1.15e-05 | 1.26e-04 | 9.64e-05 | 35 |
| hsa0520514 | Breast | Precancer | Proteoglycans in cancer | 30/684 | 205/8465 | 1.00e-03 | 7.18e-03 | 5.50e-03 | 30 |
| hsa0513119 | Breast | Precancer | Shigellosis | 44/684 | 247/8465 | 3.91e-07 | 6.86e-06 | 5.26e-06 | 44 |
| hsa0516919 | Breast | Precancer | Epstein-Barr virus infection | 35/684 | 202/8465 | 1.15e-05 | 1.26e-04 | 9.64e-05 | 35 |
| hsa0520515 | Breast | Precancer | Proteoglycans in cancer | 30/684 | 205/8465 | 1.00e-03 | 7.18e-03 | 5.50e-03 | 30 |
| hsa0516922 | Breast | IDC | Epstein-Barr virus infection | 45/867 | 202/8465 | 3.16e-07 | 6.05e-06 | 4.52e-06 | 45 |
| hsa0520523 | Breast | IDC | Proteoglycans in cancer | 42/867 | 205/8465 | 7.69e-06 | 9.99e-05 | 7.48e-05 | 42 |
| hsa0513124 | Breast | IDC | Shigellosis | 47/867 | 247/8465 | 1.78e-05 | 2.00e-04 | 1.49e-04 | 47 |
| hsa0516932 | Breast | IDC | Epstein-Barr virus infection | 45/867 | 202/8465 | 3.16e-07 | 6.05e-06 | 4.52e-06 | 45 |
| hsa0520533 | Breast | IDC | Proteoglycans in cancer | 42/867 | 205/8465 | 7.69e-06 | 9.99e-05 | 7.48e-05 | 42 |
| hsa0513134 | Breast | IDC | Shigellosis | 47/867 | 247/8465 | 1.78e-05 | 2.00e-04 | 1.49e-04 | 47 |
| hsa0516941 | Breast | DCIS | Epstein-Barr virus infection | 46/846 | 202/8465 | 5.60e-08 | 1.13e-06 | 8.33e-07 | 46 |
| hsa0513144 | Breast | DCIS | Shigellosis | 46/846 | 247/8465 | 2.06e-05 | 2.38e-04 | 1.75e-04 | 46 |
| hsa0520542 | Breast | DCIS | Proteoglycans in cancer | 39/846 | 205/8465 | 5.36e-05 | 5.58e-04 | 4.11e-04 | 39 |
| hsa0516951 | Breast | DCIS | Epstein-Barr virus infection | 46/846 | 202/8465 | 5.60e-08 | 1.13e-06 | 8.33e-07 | 46 |
| hsa0513154 | Breast | DCIS | Shigellosis | 46/846 | 247/8465 | 2.06e-05 | 2.38e-04 | 1.75e-04 | 46 |
| hsa0520552 | Breast | DCIS | Proteoglycans in cancer | 39/846 | 205/8465 | 5.36e-05 | 5.58e-04 | 4.11e-04 | 39 |
| hsa0513120 | Cervix | CC | Shigellosis | 69/1267 | 247/8465 | 7.64e-08 | 1.03e-06 | 6.10e-07 | 69 |
| hsa0520516 | Cervix | CC | Proteoglycans in cancer | 60/1267 | 205/8465 | 9.13e-08 | 1.18e-06 | 7.00e-07 | 60 |
| Page: 1 2 3 4 5 6 7 |
Top |
Cell-cell communication analysis |
| Identification of potential cell-cell interactions between two cell types and their ligand-receptor pairs for different disease states |
| Ligand | Receptor | LRpair | Pathway | Tissue | Disease Stage |
| MIF | CD74_CD44 | MIF_CD74_CD44 | MIF | Breast | ADJ |
| COL1A1 | CD44 | COL1A1_CD44 | COLLAGEN | Breast | ADJ |
| COL1A2 | CD44 | COL1A2_CD44 | COLLAGEN | Breast | ADJ |
| COL4A1 | CD44 | COL4A1_CD44 | COLLAGEN | Breast | ADJ |
| COL4A2 | CD44 | COL4A2_CD44 | COLLAGEN | Breast | ADJ |
| COL6A1 | CD44 | COL6A1_CD44 | COLLAGEN | Breast | ADJ |
| COL6A2 | CD44 | COL6A2_CD44 | COLLAGEN | Breast | ADJ |
| COL6A3 | CD44 | COL6A3_CD44 | COLLAGEN | Breast | ADJ |
| LAMA2 | CD44 | LAMA2_CD44 | LAMININ | Breast | ADJ |
| LAMA4 | CD44 | LAMA4_CD44 | LAMININ | Breast | ADJ |
| LAMB2 | CD44 | LAMB2_CD44 | LAMININ | Breast | ADJ |
| LAMB3 | CD44 | LAMB3_CD44 | LAMININ | Breast | ADJ |
| LAMC1 | CD44 | LAMC1_CD44 | LAMININ | Breast | ADJ |
| LAMC2 | CD44 | LAMC2_CD44 | LAMININ | Breast | ADJ |
| SELE | CD44 | SELE_CD44 | SELE | Breast | ADJ |
| LGALS9 | CD44 | LGALS9_CD44 | GALECTIN | Breast | ADJ |
| FN1 | CD44 | FN1_CD44 | FN1 | Breast | ADJ |
| COL1A1 | CD44 | COL1A1_CD44 | COLLAGEN | Breast | DCIS |
| COL1A2 | CD44 | COL1A2_CD44 | COLLAGEN | Breast | DCIS |
| COL4A1 | CD44 | COL4A1_CD44 | COLLAGEN | Breast | DCIS |
| Page: 1 |
Top |
Single-cell gene regulatory network inference analysis |
| Find out the significant the regulons (TFs) and the target genes of each regulon across cell types for different disease states |
| TF | Cell Type | Tissue | Disease Stage | Target Gene | RSS | Regulon Activity |
| ∗The dot plots of a searched regulon are shown for all cell subpopulations in each disease state of each tissue based on the regulon specific score inferred using pySCENIC and by calculating the average expression. |
| Page: 1 |
Top |
Somatic mutation of malignant transformation related genes |
| Annotation of somatic variants for genes involved in malignant transformation |
| Hugo Symbol | Variant Class | Variant Classification | dbSNP RS | HGVSc | HGVSp | HGVSp Short | SWISSPROT | BIOTYPE | SIFT | PolyPhen | Tumor Sample Barcode | Tissue | Histology | Sex | Age | Stage | Therapy Types | Drugs | Outcome |
| CD44 | SNV | Missense_Mutation | c.106G>A | p.Val36Met | p.V36M | P16070 | protein_coding | deleterious(0) | probably_damaging(0.995) | TCGA-A2-A0ET-01 | Breast | breast invasive carcinoma | Female | <65 | III/IV | Chemotherapy | cytoxan | SD | |
| CD44 | SNV | Missense_Mutation | novel | c.1934C>T | p.Pro645Leu | p.P645L | P16070 | protein_coding | deleterious(0) | possibly_damaging(0.541) | TCGA-B6-A0I9-01 | Breast | breast invasive carcinoma | Female | <65 | III/IV | Unknown | Unknown | PD |
| CD44 | SNV | Missense_Mutation | c.829G>C | p.Glu277Gln | p.E277Q | P16070 | protein_coding | tolerated(0.18) | benign(0.32) | TCGA-D8-A143-01 | Breast | breast invasive carcinoma | Female | <65 | I/II | Chemotherapy | doxorubicin | SD | |
| CD44 | insertion | Nonsense_Mutation | novel | c.1935_1936insATCATATAATCTCAATGCAATAAATAATCAA | p.Gln646IlefsTer3 | p.Q646Ifs*3 | P16070 | protein_coding | TCGA-B6-A0I9-01 | Breast | breast invasive carcinoma | Female | <65 | III/IV | Unknown | Unknown | PD | ||
| CD44 | deletion | Frame_Shift_Del | c.1454_1461delCAAATCCA | p.Ala485GlufsTer22 | p.A485Efs*22 | P16070 | protein_coding | TCGA-C8-A1HJ-01 | Breast | breast invasive carcinoma | Female | <65 | I/II | Unknown | Unknown | SD | |||
| CD44 | SNV | Missense_Mutation | novel | c.476N>C | p.Gly159Ala | p.G159A | P16070 | protein_coding | deleterious(0) | probably_damaging(0.987) | TCGA-DG-A2KM-01 | Cervix | cervical & endocervical cancer | Female | <65 | I/II | Chemotherapy | cisplatin | SD |
| CD44 | SNV | Missense_Mutation | c.1521N>C | p.Gln507His | p.Q507H | P16070 | protein_coding | deleterious(0.02) | possibly_damaging(0.707) | TCGA-FU-A23K-01 | Cervix | cervical & endocervical cancer | Female | <65 | III/IV | Unknown | Unknown | SD | |
| CD44 | SNV | Missense_Mutation | rs371026548 | c.1289C>T | p.Ser430Leu | p.S430L | P16070 | protein_coding | deleterious(0.02) | benign(0.154) | TCGA-IR-A3LA-01 | Cervix | cervical & endocervical cancer | Female | <65 | I/II | Chemotherapy | cisplatin | CR |
| CD44 | SNV | Missense_Mutation | novel | c.1790N>C | p.Asn597Thr | p.N597T | P16070 | protein_coding | deleterious(0.01) | benign(0.025) | TCGA-VS-A9U5-01 | Cervix | cervical & endocervical cancer | Female | <65 | I/II | Chemotherapy | cisplatin | CR |
| CD44 | SNV | Missense_Mutation | c.92N>T | p.Ala31Val | p.A31V | P16070 | protein_coding | deleterious(0) | benign(0.329) | TCGA-AA-A01I-01 | Colorectum | colon adenocarcinoma | Male | >=65 | I/II | Unknown | Unknown | SD |
| Page: 1 2 3 4 5 6 7 |
Top |
Related drugs of malignant transformation related genes |
| Identification of chemicals and drugs interact with genes involved in malignant transfromation |
| (DGIdb 4.0) |
| Entrez ID | Symbol | Category | Interaction Types | Drug Claim Name | Drug Name | PMIDs |
| 960 | CD44 | DRUGGABLE GENOME, CELL SURFACE | GENTAMICIN | GENTAMICIN | 14967965 | |
| 960 | CD44 | DRUGGABLE GENOME, CELL SURFACE | MPA | PROGESTERONE | 11605071 | |
| 960 | CD44 | DRUGGABLE GENOME, CELL SURFACE | RG7356 | 25762343 | ||
| 960 | CD44 | DRUGGABLE GENOME, CELL SURFACE | TUMOR NECROSIS FACTOR | 12867430 | ||
| 960 | CD44 | DRUGGABLE GENOME, CELL SURFACE | GP-120 | 7539755 | ||
| 960 | CD44 | DRUGGABLE GENOME, CELL SURFACE | INTERFERON GAMMA | 11369659 | ||
| 960 | CD44 | DRUGGABLE GENOME, CELL SURFACE | HYALURONAN | HYALURONAN | ||
| 960 | CD44 | DRUGGABLE GENOME, CELL SURFACE | MOMETASONE FUROATE | 12877820 | ||
| 960 | CD44 | DRUGGABLE GENOME, CELL SURFACE | A-6 | |||
| 960 | CD44 | DRUGGABLE GENOME, CELL SURFACE | BIWA 4 |
| Page: 1 |

Copyright 2023-Present -The University of Texas Health Science Center at Houston |