
|
|||||
|
 | |
| |
| |
| |
| |
| |
|
Gene: CD3D |
Gene summary for CD3D |
| Gene information | Species | Human | Gene symbol | CD3D | Gene ID | 915 |
| Gene name | CD3d molecule | |
| Gene Alias | CD3-DELTA | |
| Cytomap | 11q23.3 | |
| Gene Type | protein-coding | GO ID | GO:0001775 | UniProtAcc | B0YIY4 |
Top |
Malignant transformation analysis |
| Identification of the aberrant gene expression in precancerous and cancerous lesions by comparing the gene expression of stem-like cells in diseased tissues with normal stem cells |
| Entrez ID | Symbol | Replicates | Species | Organ | Tissue | Adj P-value | Log2FC | Malignancy |
| 915 | CD3D | LZE4T | Human | Esophagus | ESCC | 4.26e-14 | 7.46e-01 | 0.0811 |
| 915 | CD3D | LZE7T | Human | Esophagus | ESCC | 4.63e-13 | 1.11e+00 | 0.0667 |
| 915 | CD3D | LZE8T | Human | Esophagus | ESCC | 2.06e-05 | 7.11e-01 | 0.067 |
| 915 | CD3D | LZE6T | Human | Esophagus | ESCC | 1.39e-21 | 1.63e+00 | 0.0845 |
| 915 | CD3D | C21 | Human | Oral cavity | OSCC | 1.61e-21 | 1.04e+00 | 0.2678 |
| 915 | CD3D | C30 | Human | Oral cavity | OSCC | 1.73e-06 | 5.86e-01 | 0.3055 |
| 915 | CD3D | C38 | Human | Oral cavity | OSCC | 1.90e-14 | 2.46e+00 | 0.172 |
| 915 | CD3D | C46 | Human | Oral cavity | OSCC | 3.41e-12 | 3.61e-01 | 0.1673 |
| 915 | CD3D | C57 | Human | Oral cavity | OSCC | 7.12e-03 | 3.73e-01 | 0.1679 |
| 915 | CD3D | C06 | Human | Oral cavity | OSCC | 1.60e-04 | 1.22e+00 | 0.2699 |
| 915 | CD3D | C07 | Human | Oral cavity | OSCC | 1.17e-07 | 8.78e-01 | 0.2491 |
| 915 | CD3D | C08 | Human | Oral cavity | OSCC | 6.34e-06 | 2.84e-01 | 0.1919 |
| 915 | CD3D | C09 | Human | Oral cavity | OSCC | 2.14e-05 | 3.01e-01 | 0.1431 |
| 915 | CD3D | LN22 | Human | Oral cavity | OSCC | 1.75e-06 | 1.34e+00 | 0.1733 |
| 915 | CD3D | LN46 | Human | Oral cavity | OSCC | 1.56e-08 | 5.11e-01 | 0.1666 |
| 915 | CD3D | LP15 | Human | Oral cavity | LP | 2.61e-02 | 7.26e-01 | 0.2174 |
| Page: 1 |
| Tissue | Expression Dynamics | Abbreviation |
| Esophagus | 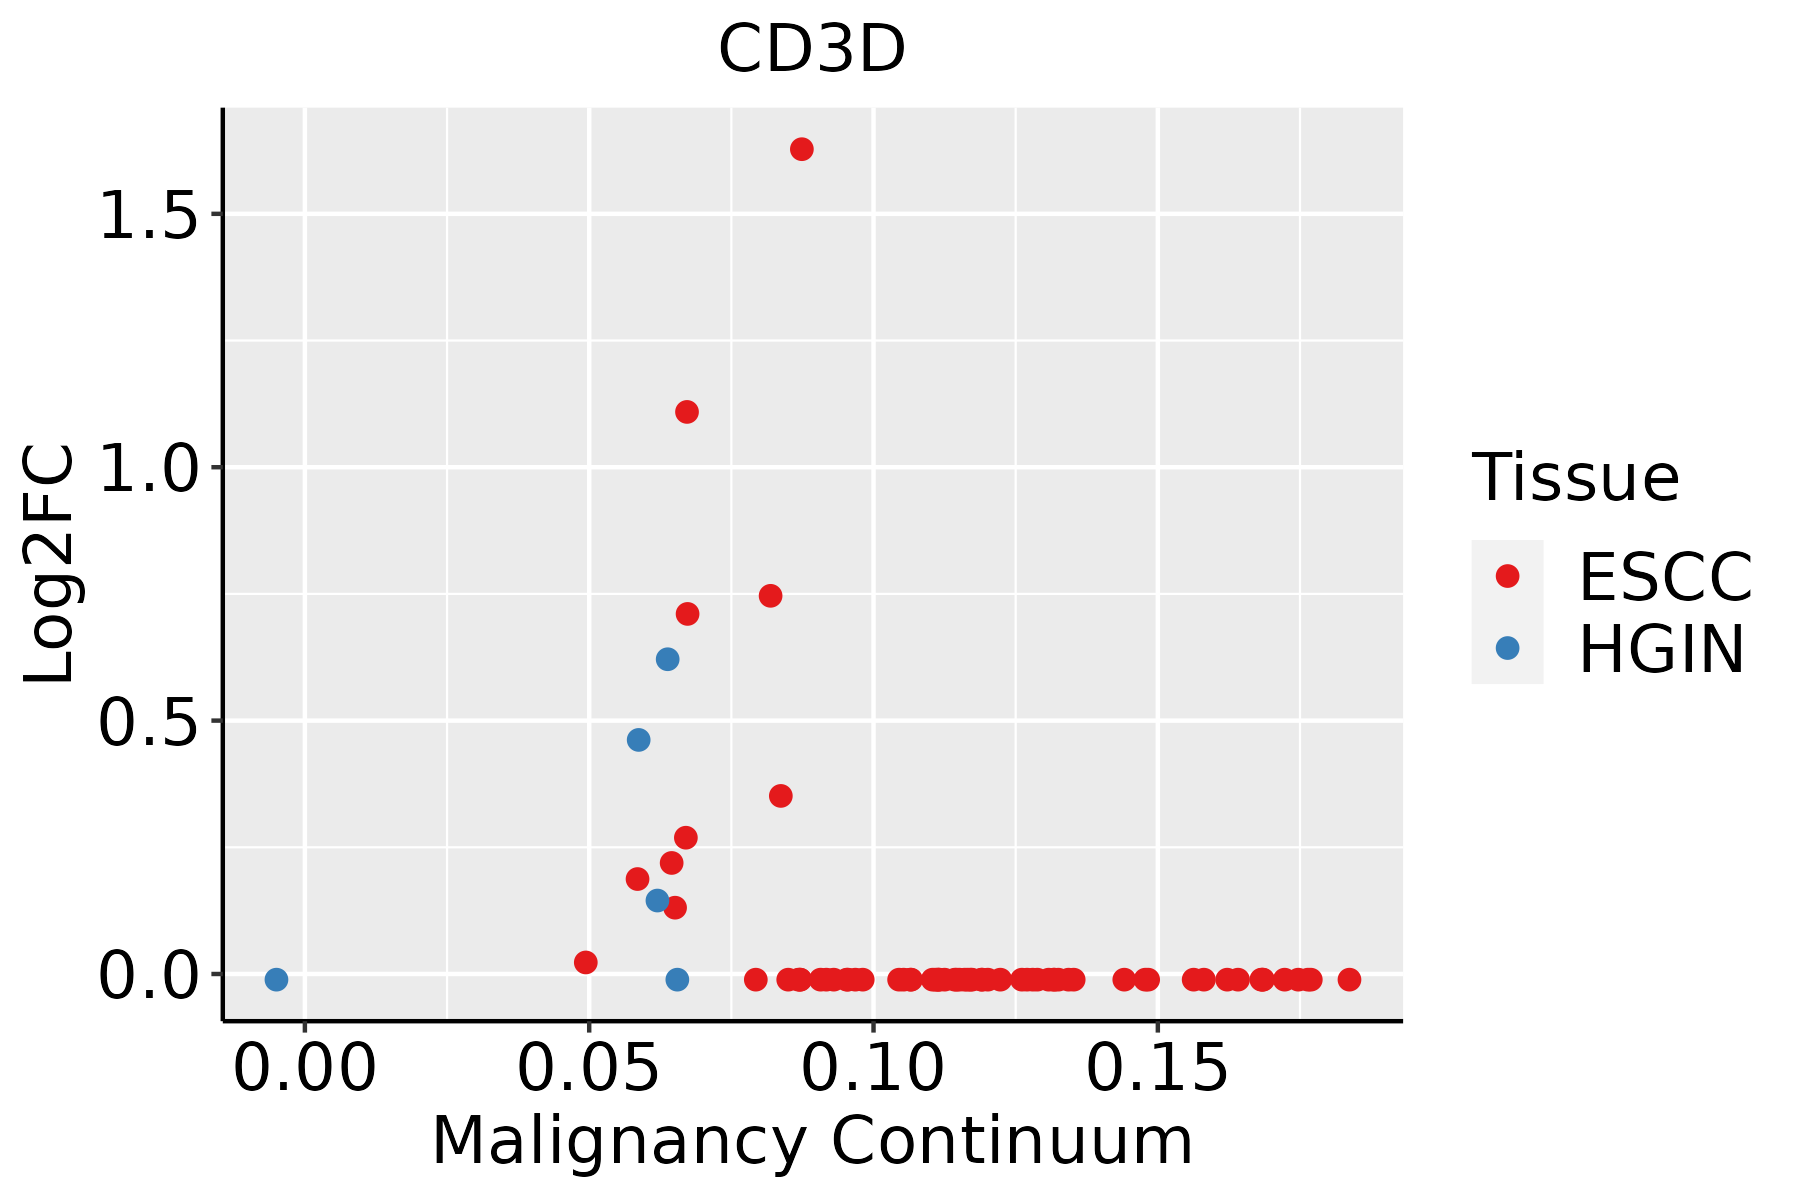 | ESCC: Esophageal squamous cell carcinoma |
| HGIN: High-grade intraepithelial neoplasias | ||
| LGIN: Low-grade intraepithelial neoplasias | ||
| Oral Cavity |  | EOLP: Erosive Oral lichen planus |
| LP: leukoplakia | ||
| NEOLP: Non-erosive oral lichen planus | ||
| OSCC: Oral squamous cell carcinoma |
| ∗log2FC in expression of this searched gene in stem-like cells from each diseased tissue sample relative to stem-like cells in normal samples in each tissue plotted against the malignancy continuum. Samples are colored based on if they are from different disease stage. |
Top |
Malignant transformation related pathway analysis |
| Find out the enriched GO biological processes and KEGG pathways involved in transition from healthy to precancer to cancer |
| Tissue | Disease Stage | Enriched GO biological Processes |
| Colorectum | AD |  |
| Colorectum | SER |  |
| Colorectum | MSS |  |
| Colorectum | MSI-H |  |
| Colorectum | FAP |  |
| ∗Top 15 enriched GO BP terms are showed in the bar plot of each disease state in each tissue. Each row represents a significant GO biological process which is colored according to the -log10(p.adjust). |
| Page: 1 2 3 4 5 6 7 8 9 |
| GO ID | Tissue | Disease Stage | Description | Gene Ratio | Bg Ratio | pvalue | p.adjust | Count |
| GO:004211018 | Esophagus | ESCC | T cell activation | 256/8552 | 487/18723 | 1.18e-03 | 5.87e-03 | 256 |
| GO:19031317 | Esophagus | ESCC | mononuclear cell differentiation | 226/8552 | 426/18723 | 1.20e-03 | 5.88e-03 | 226 |
| GO:00302176 | Esophagus | ESCC | T cell differentiation | 137/8552 | 257/18723 | 8.09e-03 | 2.87e-02 | 137 |
| GO:00300984 | Esophagus | ESCC | lymphocyte differentiation | 192/8552 | 374/18723 | 1.52e-02 | 4.93e-02 | 192 |
| GO:004211016 | Oral cavity | OSCC | T cell activation | 245/7305 | 487/18723 | 2.00e-07 | 3.22e-06 | 245 |
| GO:19031316 | Oral cavity | OSCC | mononuclear cell differentiation | 210/7305 | 426/18723 | 8.44e-06 | 9.02e-05 | 210 |
| GO:00300983 | Oral cavity | OSCC | lymphocyte differentiation | 179/7305 | 374/18723 | 2.74e-04 | 1.74e-03 | 179 |
| GO:00302175 | Oral cavity | OSCC | T cell differentiation | 126/7305 | 257/18723 | 6.51e-04 | 3.66e-03 | 126 |
| GO:00330771 | Oral cavity | OSCC | T cell differentiation in thymus | 42/7305 | 75/18723 | 2.09e-03 | 9.63e-03 | 42 |
| GO:004211017 | Oral cavity | LP | T cell activation | 146/4623 | 487/18723 | 4.13e-03 | 2.66e-02 | 146 |
| Page: 1 |
| Pathway ID | Tissue | Disease Stage | Description | Gene Ratio | Bg Ratio | pvalue | p.adjust | qvalue | Count |
| hsa05166211 | Esophagus | ESCC | Human T-cell leukemia virus 1 infection | 164/4205 | 222/8465 | 8.13e-14 | 2.09e-12 | 1.07e-12 | 164 |
| hsa05169210 | Esophagus | ESCC | Epstein-Barr virus infection | 151/4205 | 202/8465 | 1.55e-13 | 3.45e-12 | 1.77e-12 | 151 |
| hsa05170210 | Esophagus | ESCC | Human immunodeficiency virus 1 infection | 147/4205 | 212/8465 | 3.37e-09 | 3.53e-08 | 1.81e-08 | 147 |
| hsa051629 | Esophagus | ESCC | Measles | 90/4205 | 139/8465 | 2.16e-04 | 7.87e-04 | 4.03e-04 | 90 |
| hsa052356 | Esophagus | ESCC | PD-L1 expression and PD-1 checkpoint pathway in cancer | 58/4205 | 89/8465 | 2.19e-03 | 6.16e-03 | 3.16e-03 | 58 |
| hsa051425 | Esophagus | ESCC | Chagas disease | 65/4205 | 102/8465 | 2.81e-03 | 7.59e-03 | 3.89e-03 | 65 |
| hsa046599 | Esophagus | ESCC | Th17 cell differentiation | 68/4205 | 108/8465 | 3.53e-03 | 9.30e-03 | 4.76e-03 | 68 |
| hsa046585 | Esophagus | ESCC | Th1 and Th2 cell differentiation | 58/4205 | 92/8465 | 6.49e-03 | 1.60e-02 | 8.19e-03 | 58 |
| hsa046607 | Esophagus | ESCC | T cell receptor signaling pathway | 63/4205 | 104/8465 | 1.60e-02 | 3.60e-02 | 1.84e-02 | 63 |
| hsa05166310 | Esophagus | ESCC | Human T-cell leukemia virus 1 infection | 164/4205 | 222/8465 | 8.13e-14 | 2.09e-12 | 1.07e-12 | 164 |
| hsa0516937 | Esophagus | ESCC | Epstein-Barr virus infection | 151/4205 | 202/8465 | 1.55e-13 | 3.45e-12 | 1.77e-12 | 151 |
| hsa0517038 | Esophagus | ESCC | Human immunodeficiency virus 1 infection | 147/4205 | 212/8465 | 3.37e-09 | 3.53e-08 | 1.81e-08 | 147 |
| hsa0516213 | Esophagus | ESCC | Measles | 90/4205 | 139/8465 | 2.16e-04 | 7.87e-04 | 4.03e-04 | 90 |
| hsa0523511 | Esophagus | ESCC | PD-L1 expression and PD-1 checkpoint pathway in cancer | 58/4205 | 89/8465 | 2.19e-03 | 6.16e-03 | 3.16e-03 | 58 |
| hsa0514213 | Esophagus | ESCC | Chagas disease | 65/4205 | 102/8465 | 2.81e-03 | 7.59e-03 | 3.89e-03 | 65 |
| hsa0465914 | Esophagus | ESCC | Th17 cell differentiation | 68/4205 | 108/8465 | 3.53e-03 | 9.30e-03 | 4.76e-03 | 68 |
| hsa0465812 | Esophagus | ESCC | Th1 and Th2 cell differentiation | 58/4205 | 92/8465 | 6.49e-03 | 1.60e-02 | 8.19e-03 | 58 |
| hsa0466013 | Esophagus | ESCC | T cell receptor signaling pathway | 63/4205 | 104/8465 | 1.60e-02 | 3.60e-02 | 1.84e-02 | 63 |
| hsa0516928 | Oral cavity | OSCC | Epstein-Barr virus infection | 144/3704 | 202/8465 | 1.08e-15 | 3.60e-14 | 1.83e-14 | 144 |
| hsa0516630 | Oral cavity | OSCC | Human T-cell leukemia virus 1 infection | 150/3704 | 222/8465 | 3.68e-13 | 7.26e-12 | 3.70e-12 | 150 |
| Page: 1 2 3 |
Top |
Cell-cell communication analysis |
| Identification of potential cell-cell interactions between two cell types and their ligand-receptor pairs for different disease states |
| Ligand | Receptor | LRpair | Pathway | Tissue | Disease Stage |
| Page: 1 |
Top |
Single-cell gene regulatory network inference analysis |
| Find out the significant the regulons (TFs) and the target genes of each regulon across cell types for different disease states |
| TF | Cell Type | Tissue | Disease Stage | Target Gene | RSS | Regulon Activity |
| ∗The dot plots of a searched regulon are shown for all cell subpopulations in each disease state of each tissue based on the regulon specific score inferred using pySCENIC and by calculating the average expression. |
| Page: 1 |
Top |
Somatic mutation of malignant transformation related genes |
| Annotation of somatic variants for genes involved in malignant transformation |
| Hugo Symbol | Variant Class | Variant Classification | dbSNP RS | HGVSc | HGVSp | HGVSp Short | SWISSPROT | BIOTYPE | SIFT | PolyPhen | Tumor Sample Barcode | Tissue | Histology | Sex | Age | Stage | Therapy Types | Drugs | Outcome |
| CD3D | SNV | Missense_Mutation | novel | c.466N>A | p.Asp156Asn | p.D156N | P04234 | protein_coding | tolerated(0.39) | benign(0.022) | TCGA-C5-A902-01 | Cervix | cervical & endocervical cancer | Female | <65 | I/II | Chemotherapy | cisplatin | SD |
| CD3D | SNV | Missense_Mutation | rs149264725 | c.187C>T | p.Arg63Cys | p.R63C | P04234 | protein_coding | tolerated(0.19) | benign(0.003) | TCGA-F5-6814-01 | Colorectum | rectum adenocarcinoma | Male | <65 | I/II | Unknown | Unknown | SD |
| CD3D | SNV | Missense_Mutation | novel | c.389N>T | p.Thr130Ile | p.T130I | P04234 | protein_coding | deleterious(0.04) | benign(0.307) | TCGA-A5-A0G2-01 | Endometrium | uterine corpus endometrioid carcinoma | Female | <65 | III/IV | Unknown | Unknown | SD |
| CD3D | SNV | Missense_Mutation | rs201889742 | c.247N>A | p.Glu83Lys | p.E83K | P04234 | protein_coding | tolerated(0.35) | benign(0) | TCGA-A5-A0G2-01 | Endometrium | uterine corpus endometrioid carcinoma | Female | <65 | III/IV | Unknown | Unknown | SD |
| CD3D | SNV | Missense_Mutation | c.431N>A | p.Arg144Lys | p.R144K | P04234 | protein_coding | tolerated(1) | benign(0) | TCGA-BG-A0VW-01 | Endometrium | uterine corpus endometrioid carcinoma | Female | >=65 | I/II | Unknown | Unknown | SD | |
| CD3D | SNV | Missense_Mutation | rs764062454 | c.349N>T | p.Leu117Phe | p.L117F | P04234 | protein_coding | tolerated(0.85) | benign(0.354) | TCGA-BS-A0UF-01 | Endometrium | uterine corpus endometrioid carcinoma | Female | >=65 | I/II | Unknown | Unknown | SD |
| CD3D | SNV | Missense_Mutation | rs370657743 | c.69N>T | p.Lys23Asn | p.K23N | P04234 | protein_coding | deleterious(0.03) | benign(0.079) | TCGA-BS-A0UF-01 | Endometrium | uterine corpus endometrioid carcinoma | Female | >=65 | I/II | Unknown | Unknown | SD |
| CD3D | SNV | Missense_Mutation | rs547344580 | c.412N>A | p.Asp138Asn | p.D138N | P04234 | protein_coding | deleterious(0.03) | benign(0.044) | TCGA-DF-A2KU-01 | Endometrium | uterine corpus endometrioid carcinoma | Female | Unknown | I/II | Unknown | Unknown | SD |
| CD3D | SNV | Missense_Mutation | novel | c.469N>T | p.Asp157Tyr | p.D157Y | P04234 | protein_coding | deleterious(0.02) | probably_damaging(0.998) | TCGA-EO-A22R-01 | Endometrium | uterine corpus endometrioid carcinoma | Female | <65 | I/II | Unknown | Unknown | SD |
| CD3D | SNV | Missense_Mutation | rs547344580 | c.412G>A | p.Asp138Asn | p.D138N | P04234 | protein_coding | deleterious(0.03) | benign(0.044) | TCGA-FI-A2D5-01 | Endometrium | uterine corpus endometrioid carcinoma | Female | <65 | III/IV | Chemotherapy | carboplatinum | PD |
| Page: 1 2 |
Top |
Related drugs of malignant transformation related genes |
| Identification of chemicals and drugs interact with genes involved in malignant transfromation |
| (DGIdb 4.0) |
| Entrez ID | Symbol | Category | Interaction Types | Drug Claim Name | Drug Name | PMIDs |
| 915 | CD3D | DRUGGABLE GENOME, EXTERNAL SIDE OF PLASMA MEMBRANE, KINASE | NI-0401 | FORALUMAB | ||
| 915 | CD3D | DRUGGABLE GENOME, EXTERNAL SIDE OF PLASMA MEMBRANE, KINASE | MUROMONAB | MUROMONAB-CD3 | ||
| 915 | CD3D | DRUGGABLE GENOME, EXTERNAL SIDE OF PLASMA MEMBRANE, KINASE | CHEMBL1742992 | BLINATUMOMAB | ||
| 915 | CD3D | DRUGGABLE GENOME, EXTERNAL SIDE OF PLASMA MEMBRANE, KINASE | CATUMAXOMAB | CATUMAXOMAB | ||
| 915 | CD3D | DRUGGABLE GENOME, EXTERNAL SIDE OF PLASMA MEMBRANE, KINASE | MT-103 | BLINATUMOMAB | ||
| 915 | CD3D | DRUGGABLE GENOME, EXTERNAL SIDE OF PLASMA MEMBRANE, KINASE | MT110 | SOLITOMAB | ||
| 915 | CD3D | DRUGGABLE GENOME, EXTERNAL SIDE OF PLASMA MEMBRANE, KINASE | ANTI-CD3 MONOCLONAL ANTIBODY | |||
| 915 | CD3D | DRUGGABLE GENOME, EXTERNAL SIDE OF PLASMA MEMBRANE, KINASE | inhibitor | CHEMBL1201608 | MUROMONAB-CD3 | |
| 915 | CD3D | DRUGGABLE GENOME, EXTERNAL SIDE OF PLASMA MEMBRANE, KINASE | inhibitor | CHEMBL2109252 | FORALUMAB | |
| 915 | CD3D | DRUGGABLE GENOME, EXTERNAL SIDE OF PLASMA MEMBRANE, KINASE | OTELIXIZUMAB | OTELIXIZUMAB |
| Page: 1 2 |

Copyright 2023-Present -The University of Texas Health Science Center at Houston |