
|
|||||
|
 | |
| |
| |
| |
| |
| |
|
Gene: CD38 |
Gene summary for CD38 |
| Gene information | Species | Human | Gene symbol | CD38 | Gene ID | 952 |
| Gene name | CD38 molecule | |
| Gene Alias | ADPRC 1 | |
| Cytomap | 4p15.32 | |
| Gene Type | protein-coding | GO ID | GO:0000003 | UniProtAcc | B4E006 |
Top |
Malignant transformation analysis |
| Identification of the aberrant gene expression in precancerous and cancerous lesions by comparing the gene expression of stem-like cells in diseased tissues with normal stem cells |
| Entrez ID | Symbol | Replicates | Species | Organ | Tissue | Adj P-value | Log2FC | Malignancy |
| 952 | CD38 | C38 | Human | Oral cavity | OSCC | 5.76e-03 | 4.96e-01 | 0.172 |
| 952 | CD38 | C46 | Human | Oral cavity | OSCC | 4.24e-07 | 3.44e-01 | 0.1673 |
| 952 | CD38 | C06 | Human | Oral cavity | OSCC | 2.72e-05 | 8.59e-01 | 0.2699 |
| 952 | CD38 | C08 | Human | Oral cavity | OSCC | 3.19e-24 | 5.19e-01 | 0.1919 |
| 952 | CD38 | LN46 | Human | Oral cavity | OSCC | 1.31e-04 | 5.32e-01 | 0.1666 |
| 952 | CD38 | LP15 | Human | Oral cavity | LP | 4.62e-03 | 7.74e-01 | 0.2174 |
| 952 | CD38 | EOLP-1 | Human | Oral cavity | EOLP | 8.30e-07 | 2.97e-01 | -0.0202 |
| 952 | CD38 | SYSMH1 | Human | Oral cavity | OSCC | 1.66e-10 | 1.75e-01 | 0.1127 |
| Page: 1 |
| Tissue | Expression Dynamics | Abbreviation |
| Oral Cavity | 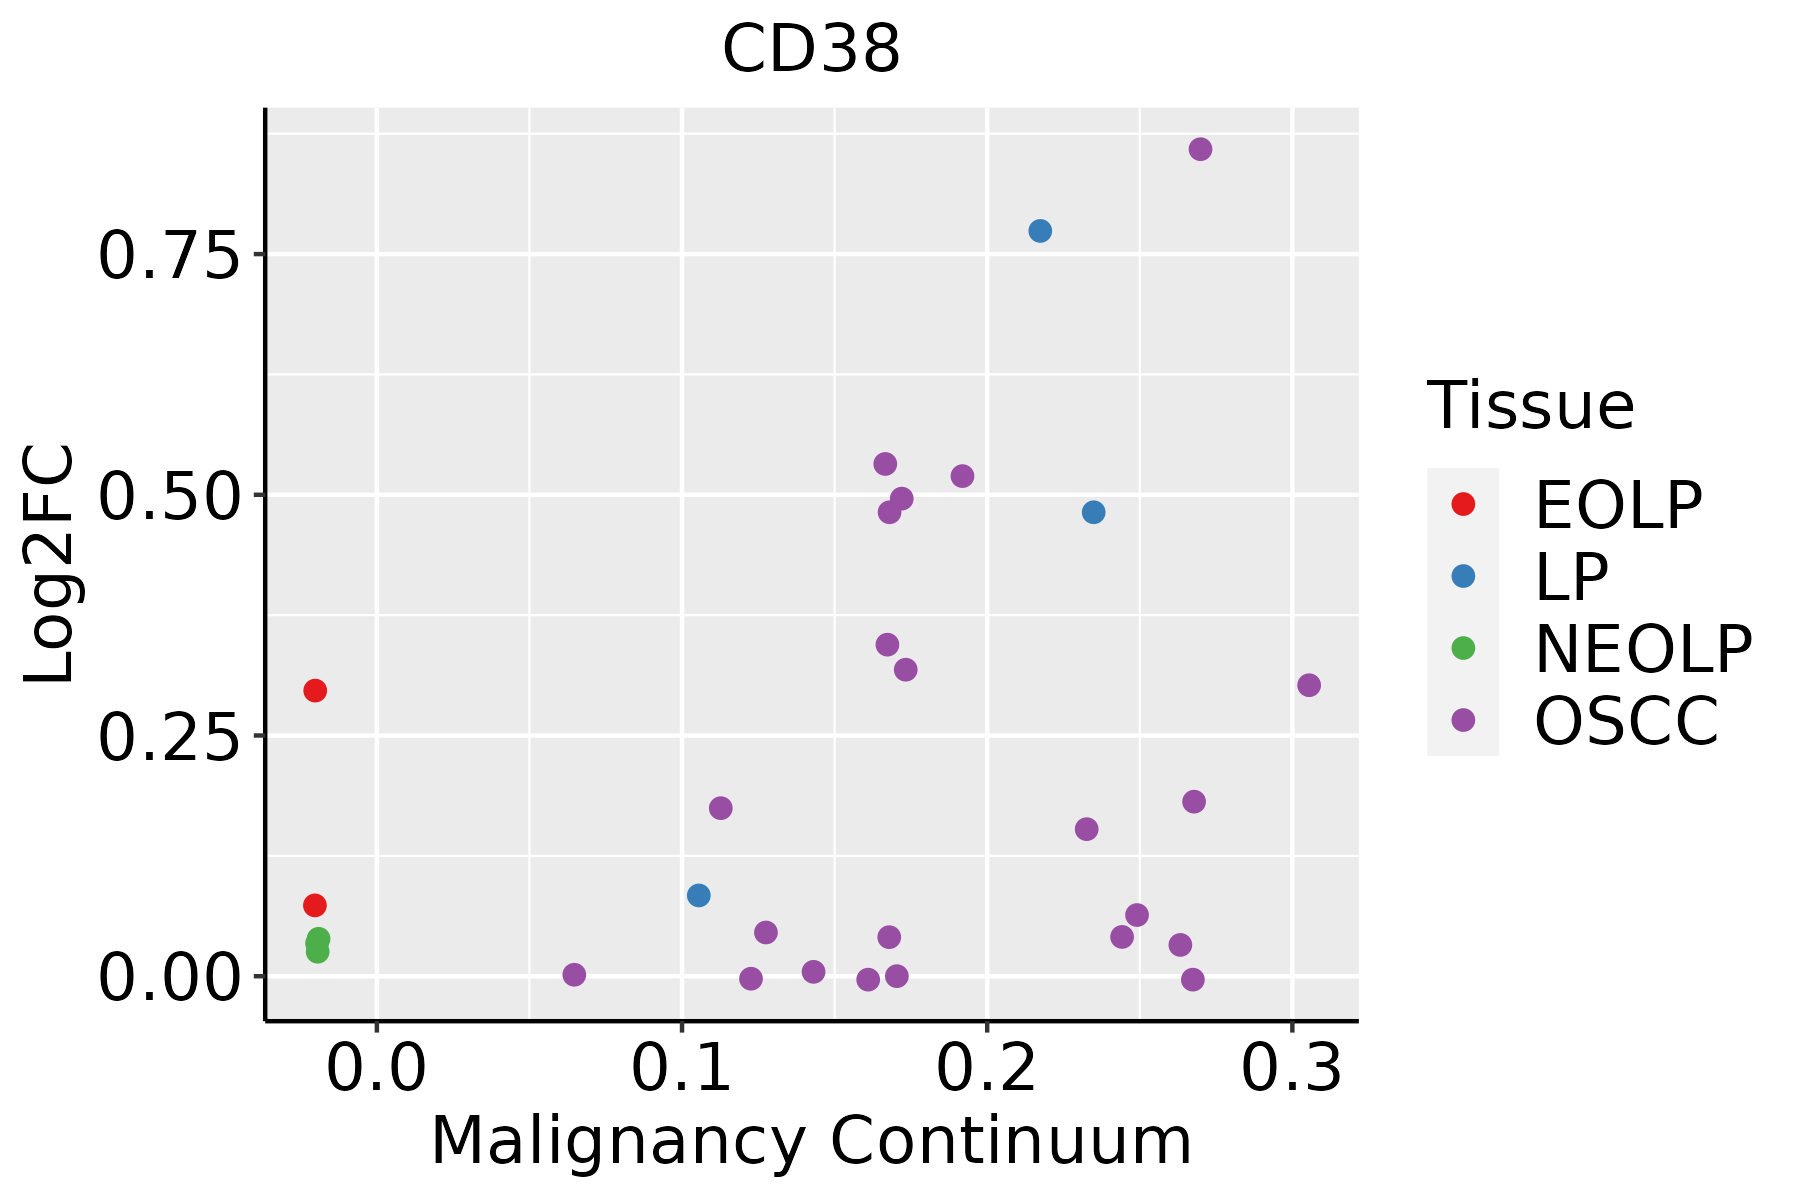 | EOLP: Erosive Oral lichen planus |
| LP: leukoplakia | ||
| NEOLP: Non-erosive oral lichen planus | ||
| OSCC: Oral squamous cell carcinoma |
| ∗log2FC in expression of this searched gene in stem-like cells from each diseased tissue sample relative to stem-like cells in normal samples in each tissue plotted against the malignancy continuum. Samples are colored based on if they are from different disease stage. |
Top |
Malignant transformation related pathway analysis |
| Find out the enriched GO biological processes and KEGG pathways involved in transition from healthy to precancer to cancer |
| Tissue | Disease Stage | Enriched GO biological Processes |
| Colorectum | AD |  |
| Colorectum | SER |  |
| Colorectum | MSS |  |
| Colorectum | MSI-H |  |
| Colorectum | FAP |  |
| ∗Top 15 enriched GO BP terms are showed in the bar plot of each disease state in each tissue. Each row represents a significant GO biological process which is colored according to the -log10(p.adjust). |
| Page: 1 2 3 4 5 6 7 8 9 |
| GO ID | Tissue | Disease Stage | Description | Gene Ratio | Bg Ratio | pvalue | p.adjust | Count |
| GO:000697920 | Oral cavity | OSCC | response to oxidative stress | 273/7305 | 446/18723 | 8.35e-22 | 1.65e-19 | 273 |
| GO:190495119 | Oral cavity | OSCC | positive regulation of establishment of protein localization | 196/7305 | 319/18723 | 2.89e-16 | 2.20e-14 | 196 |
| GO:005122219 | Oral cavity | OSCC | positive regulation of protein transport | 187/7305 | 303/18723 | 7.37e-16 | 5.49e-14 | 187 |
| GO:001604917 | Oral cavity | OSCC | cell growth | 268/7305 | 482/18723 | 6.55e-14 | 3.51e-12 | 268 |
| GO:007048219 | Oral cavity | OSCC | response to oxygen levels | 200/7305 | 347/18723 | 1.17e-12 | 5.13e-11 | 200 |
| GO:000155816 | Oral cavity | OSCC | regulation of cell growth | 228/7305 | 414/18723 | 1.74e-11 | 6.09e-10 | 228 |
| GO:000166619 | Oral cavity | OSCC | response to hypoxia | 177/7305 | 307/18723 | 2.21e-11 | 7.50e-10 | 177 |
| GO:003629319 | Oral cavity | OSCC | response to decreased oxygen levels | 182/7305 | 322/18723 | 1.14e-10 | 3.41e-09 | 182 |
| GO:004854520 | Oral cavity | OSCC | response to steroid hormone | 186/7305 | 339/18723 | 1.86e-09 | 4.42e-08 | 186 |
| GO:190165419 | Oral cavity | OSCC | response to ketone | 114/7305 | 194/18723 | 1.82e-08 | 3.60e-07 | 114 |
| GO:00303079 | Oral cavity | OSCC | positive regulation of cell growth | 92/7305 | 166/18723 | 1.27e-05 | 1.29e-04 | 92 |
| GO:00323559 | Oral cavity | OSCC | response to estradiol | 79/7305 | 141/18723 | 3.01e-05 | 2.76e-04 | 79 |
| GO:000941018 | Oral cavity | OSCC | response to xenobiotic stimulus | 222/7305 | 462/18723 | 4.00e-05 | 3.48e-04 | 222 |
| GO:00325707 | Oral cavity | OSCC | response to progesterone | 26/7305 | 37/18723 | 1.15e-04 | 8.35e-04 | 26 |
| GO:001097510 | Oral cavity | OSCC | regulation of neuron projection development | 210/7305 | 445/18723 | 2.35e-04 | 1.52e-03 | 210 |
| GO:00075657 | Oral cavity | OSCC | female pregnancy | 98/7305 | 193/18723 | 5.66e-04 | 3.27e-03 | 98 |
| GO:000930610 | Oral cavity | OSCC | protein secretion | 169/7305 | 359/18723 | 1.04e-03 | 5.34e-03 | 169 |
| GO:003559210 | Oral cavity | OSCC | establishment of protein localization to extracellular region | 169/7305 | 360/18723 | 1.21e-03 | 6.08e-03 | 169 |
| GO:00716929 | Oral cavity | OSCC | protein localization to extracellular region | 172/7305 | 368/18723 | 1.40e-03 | 6.79e-03 | 172 |
| GO:004592710 | Oral cavity | OSCC | positive regulation of growth | 125/7305 | 259/18723 | 1.44e-03 | 6.97e-03 | 125 |
| Page: 1 2 3 4 5 |
| Pathway ID | Tissue | Disease Stage | Description | Gene Ratio | Bg Ratio | pvalue | p.adjust | qvalue | Count |
| hsa049219 | Oral cavity | EOLP | Oxytocin signaling pathway | 36/1218 | 154/8465 | 1.79e-03 | 6.08e-03 | 3.58e-03 | 36 |
| hsa0492112 | Oral cavity | EOLP | Oxytocin signaling pathway | 36/1218 | 154/8465 | 1.79e-03 | 6.08e-03 | 3.58e-03 | 36 |
| Page: 1 |
Top |
Cell-cell communication analysis |
| Identification of potential cell-cell interactions between two cell types and their ligand-receptor pairs for different disease states |
| Ligand | Receptor | LRpair | Pathway | Tissue | Disease Stage |
| Page: 1 |
Top |
Single-cell gene regulatory network inference analysis |
| Find out the significant the regulons (TFs) and the target genes of each regulon across cell types for different disease states |
| TF | Cell Type | Tissue | Disease Stage | Target Gene | RSS | Regulon Activity |
| ∗The dot plots of a searched regulon are shown for all cell subpopulations in each disease state of each tissue based on the regulon specific score inferred using pySCENIC and by calculating the average expression. |
| Page: 1 |
Top |
Somatic mutation of malignant transformation related genes |
| Annotation of somatic variants for genes involved in malignant transformation |
| Hugo Symbol | Variant Class | Variant Classification | dbSNP RS | HGVSc | HGVSp | HGVSp Short | SWISSPROT | BIOTYPE | SIFT | PolyPhen | Tumor Sample Barcode | Tissue | Histology | Sex | Age | Stage | Therapy Types | Drugs | Outcome |
| CD38 | SNV | Missense_Mutation | c.353N>A | p.Pro118His | p.P118H | P28907 | protein_coding | deleterious(0.03) | probably_damaging(0.995) | TCGA-A8-A07L-01 | Breast | breast invasive carcinoma | Female | <65 | III/IV | Chemotherapy | CR | ||
| CD38 | SNV | Missense_Mutation | novel | c.475T>G | p.Trp159Gly | p.W159G | P28907 | protein_coding | deleterious(0) | probably_damaging(1) | TCGA-AN-A046-01 | Breast | breast invasive carcinoma | Female | >=65 | I/II | Unknown | Unknown | SD |
| CD38 | SNV | Missense_Mutation | c.239N>C | p.Val80Ala | p.V80A | P28907 | protein_coding | tolerated(0.06) | benign(0.076) | TCGA-E2-A15S-01 | Breast | breast invasive carcinoma | Female | <65 | I/II | Chemotherapy | doxorubicin | SD | |
| CD38 | SNV | Missense_Mutation | novel | c.59G>A | p.Arg20Lys | p.R20K | P28907 | protein_coding | tolerated(0.53) | benign(0.006) | TCGA-C5-A8YR-01 | Cervix | cervical & endocervical cancer | Female | <65 | I/II | Unknown | Unknown | PD |
| CD38 | SNV | Missense_Mutation | c.473N>A | p.Thr158Lys | p.T158K | P28907 | protein_coding | tolerated(0.54) | benign(0.005) | TCGA-A6-2686-01 | Colorectum | colon adenocarcinoma | Female | >=65 | I/II | Unknown | Unknown | SD | |
| CD38 | SNV | Missense_Mutation | c.139N>T | p.Arg47Cys | p.R47C | P28907 | protein_coding | tolerated(0.05) | benign(0.279) | TCGA-CK-4951-01 | Colorectum | colon adenocarcinoma | Female | >=65 | I/II | Unknown | Unknown | PD | |
| CD38 | SNV | Missense_Mutation | c.131N>T | p.Pro44Leu | p.P44L | P28907 | protein_coding | tolerated(0.67) | benign(0) | TCGA-CM-6172-01 | Colorectum | colon adenocarcinoma | Female | >=65 | III/IV | Ancillary | leucovorin | SD | |
| CD38 | SNV | Missense_Mutation | novel | c.650N>G | p.Asp217Gly | p.D217G | P28907 | protein_coding | tolerated(0.4) | benign(0.036) | TCGA-AG-A002-01 | Colorectum | rectum adenocarcinoma | Male | <65 | I/II | Unknown | Unknown | SD |
| CD38 | SNV | Missense_Mutation | c.353C>A | p.Pro118His | p.P118H | P28907 | protein_coding | deleterious(0.03) | probably_damaging(0.995) | TCGA-AJ-A2QO-01 | Endometrium | uterine corpus endometrioid carcinoma | Female | >=65 | I/II | Unknown | Unknown | SD | |
| CD38 | SNV | Missense_Mutation | novel | c.814N>A | p.Gln272Lys | p.Q272K | P28907 | protein_coding | tolerated(1) | benign(0) | TCGA-AJ-A5DW-01 | Endometrium | uterine corpus endometrioid carcinoma | Female | <65 | I/II | Unknown | Unknown | SD |
| Page: 1 2 3 4 |
Top |
Related drugs of malignant transformation related genes |
| Identification of chemicals and drugs interact with genes involved in malignant transfromation |
| (DGIdb 4.0) |
| Entrez ID | Symbol | Category | Interaction Types | Drug Claim Name | Drug Name | PMIDs |
| 952 | CD38 | CELL SURFACE, DRUGGABLE GENOME | CART-38 cells | |||
| 952 | CD38 | CELL SURFACE, DRUGGABLE GENOME | CD38-specific gene-engineered T cells | |||
| 952 | CD38 | CELL SURFACE, DRUGGABLE GENOME | MOR-202 | |||
| 952 | CD38 | CELL SURFACE, DRUGGABLE GENOME | antibody | 178103967 | DARATUMUMAB | |
| 952 | CD38 | CELL SURFACE, DRUGGABLE GENOME | antibody | 252827377 | ISATUXIMAB | |
| 952 | CD38 | CELL SURFACE, DRUGGABLE GENOME | CAR-T cells targeting CD38 | |||
| 952 | CD38 | CELL SURFACE, DRUGGABLE GENOME | Anti-CD38 CAR-T cells | |||
| 952 | CD38 | CELL SURFACE, DRUGGABLE GENOME | CD38 CAR T cells | |||
| 952 | CD38 | CELL SURFACE, DRUGGABLE GENOME | SAR650984 | |||
| 952 | CD38 | CELL SURFACE, DRUGGABLE GENOME | 4SCAR19 and 4SCAR38 |
| Page: 1 2 |

Copyright 2023-Present -The University of Texas Health Science Center at Houston |