
|
|||||
|
 | |
| |
| |
| |
| |
| |
|
Gene: CD36 |
Gene summary for CD36 |
| Gene information | Species | Human | Gene symbol | CD36 | Gene ID | 948 |
| Gene name | CD36 molecule | |
| Gene Alias | BDPLT10 | |
| Cytomap | 7q21.11 | |
| Gene Type | protein-coding | GO ID | GO:0000122 | UniProtAcc | A4D1B1 |
Top |
Malignant transformation analysis |
| Identification of the aberrant gene expression in precancerous and cancerous lesions by comparing the gene expression of stem-like cells in diseased tissues with normal stem cells |
| Entrez ID | Symbol | Replicates | Species | Organ | Tissue | Adj P-value | Log2FC | Malignancy |
| 948 | CD36 | HCC1_Meng | Human | Liver | HCC | 2.42e-72 | 2.49e-01 | 0.0246 |
| 948 | CD36 | HCC1 | Human | Liver | HCC | 1.37e-08 | 5.11e+00 | 0.5336 |
| 948 | CD36 | HCC2 | Human | Liver | HCC | 2.74e-17 | 2.87e+00 | 0.5341 |
| 948 | CD36 | Pt13.a | Human | Liver | HCC | 5.63e-18 | 6.22e-01 | 0.021 |
| 948 | CD36 | Pt13.b | Human | Liver | HCC | 1.11e-32 | 1.10e+00 | 0.0251 |
| 948 | CD36 | Pt13.c | Human | Liver | HCC | 1.34e-09 | 7.38e-01 | 0.0076 |
| Page: 1 |
| Tissue | Expression Dynamics | Abbreviation |
| Liver | 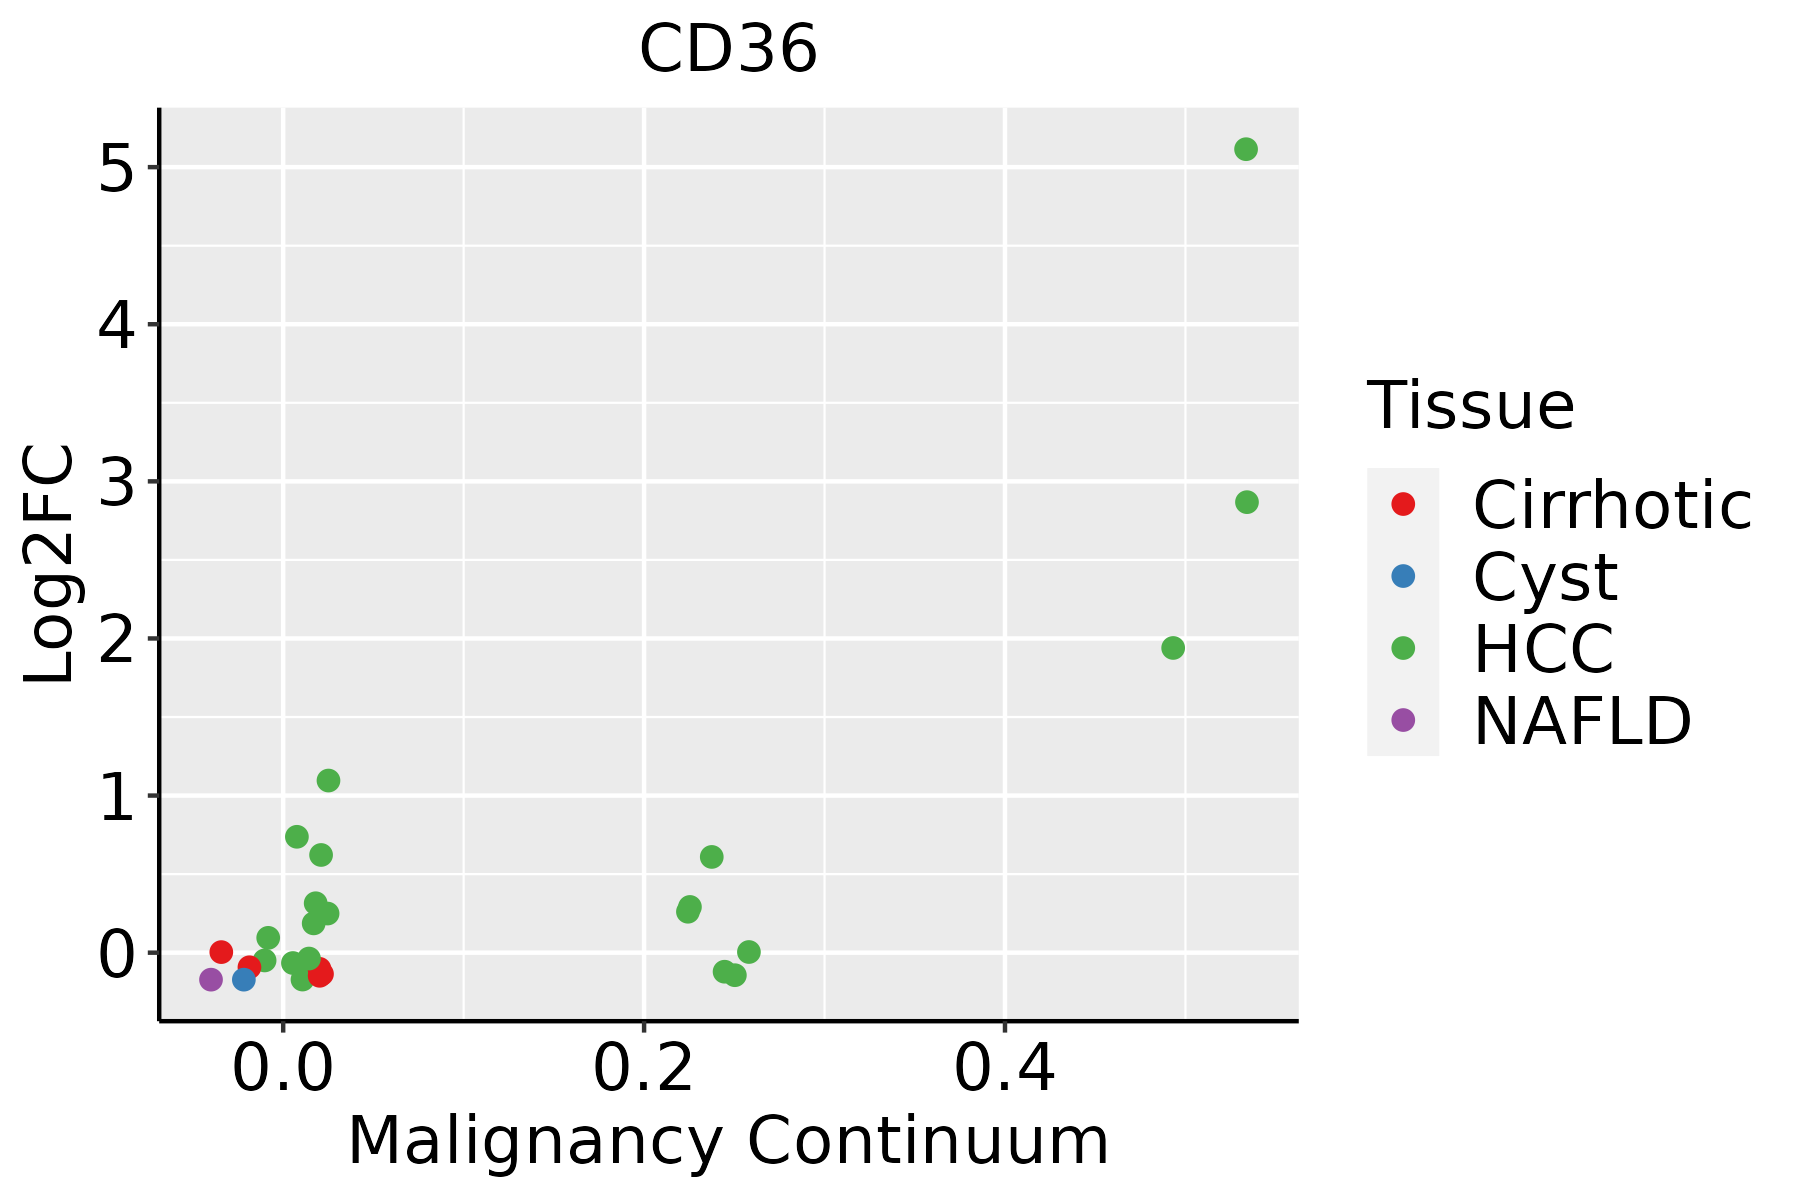 | HCC: Hepatocellular carcinoma |
| NAFLD: Non-alcoholic fatty liver disease |
| ∗log2FC in expression of this searched gene in stem-like cells from each diseased tissue sample relative to stem-like cells in normal samples in each tissue plotted against the malignancy continuum. Samples are colored based on if they are from different disease stage. |
Top |
Malignant transformation related pathway analysis |
| Find out the enriched GO biological processes and KEGG pathways involved in transition from healthy to precancer to cancer |
| Tissue | Disease Stage | Enriched GO biological Processes |
| Colorectum | AD |  |
| Colorectum | SER |  |
| Colorectum | MSS |  |
| Colorectum | MSI-H |  |
| Colorectum | FAP |  |
| ∗Top 15 enriched GO BP terms are showed in the bar plot of each disease state in each tissue. Each row represents a significant GO biological process which is colored according to the -log10(p.adjust). |
| Page: 1 2 3 4 5 6 7 8 9 |
| GO ID | Tissue | Disease Stage | Description | Gene Ratio | Bg Ratio | pvalue | p.adjust | Count |
| GO:007259422 | Liver | HCC | establishment of protein localization to organelle | 299/7958 | 422/18723 | 1.06e-32 | 6.10e-30 | 299 |
| GO:003238621 | Liver | HCC | regulation of intracellular transport | 231/7958 | 337/18723 | 1.99e-22 | 3.40e-20 | 231 |
| GO:000691322 | Liver | HCC | nucleocytoplasmic transport | 208/7958 | 301/18723 | 5.51e-21 | 8.12e-19 | 208 |
| GO:005116922 | Liver | HCC | nuclear transport | 208/7958 | 301/18723 | 5.51e-21 | 8.12e-19 | 208 |
| GO:003315721 | Liver | HCC | regulation of intracellular protein transport | 165/7958 | 229/18723 | 8.37e-20 | 1.15e-17 | 165 |
| GO:000697922 | Liver | HCC | response to oxidative stress | 281/7958 | 446/18723 | 9.75e-19 | 1.24e-16 | 281 |
| GO:003450421 | Liver | HCC | protein localization to nucleus | 194/7958 | 290/18723 | 2.84e-17 | 2.85e-15 | 194 |
| GO:004325422 | Liver | HCC | regulation of protein-containing complex assembly | 264/7958 | 428/18723 | 5.47e-16 | 4.39e-14 | 264 |
| GO:006219722 | Liver | HCC | cellular response to chemical stress | 216/7958 | 337/18723 | 6.86e-16 | 5.44e-14 | 216 |
| GO:000663122 | Liver | HCC | fatty acid metabolic process | 238/7958 | 390/18723 | 8.24e-14 | 4.84e-12 | 238 |
| GO:001703811 | Liver | HCC | protein import | 140/7958 | 206/18723 | 1.12e-13 | 6.46e-12 | 140 |
| GO:003459922 | Liver | HCC | cellular response to oxidative stress | 183/7958 | 288/18723 | 3.65e-13 | 1.93e-11 | 183 |
| GO:004682221 | Liver | HCC | regulation of nucleocytoplasmic transport | 81/7958 | 106/18723 | 1.11e-12 | 5.52e-11 | 81 |
| GO:000030222 | Liver | HCC | response to reactive oxygen species | 144/7958 | 222/18723 | 1.24e-11 | 5.09e-10 | 144 |
| GO:003133412 | Liver | HCC | positive regulation of protein-containing complex assembly | 150/7958 | 237/18723 | 7.35e-11 | 2.63e-09 | 150 |
| GO:190018012 | Liver | HCC | regulation of protein localization to nucleus | 95/7958 | 136/18723 | 9.26e-11 | 3.26e-09 | 95 |
| GO:190165321 | Liver | HCC | cellular response to peptide | 211/7958 | 359/18723 | 2.86e-10 | 9.63e-09 | 211 |
| GO:003461412 | Liver | HCC | cellular response to reactive oxygen species | 102/7958 | 155/18723 | 3.70e-09 | 9.89e-08 | 102 |
| GO:005117011 | Liver | HCC | import into nucleus | 102/7958 | 159/18723 | 2.78e-08 | 6.39e-07 | 102 |
| GO:00066066 | Liver | HCC | protein import into nucleus | 99/7958 | 155/18723 | 6.12e-08 | 1.28e-06 | 99 |
| Page: 1 2 3 4 5 6 |
| Pathway ID | Tissue | Disease Stage | Description | Gene Ratio | Bg Ratio | pvalue | p.adjust | qvalue | Count |
| hsa0541522 | Liver | HCC | Diabetic cardiomyopathy | 151/4020 | 203/8465 | 2.72e-15 | 1.01e-13 | 5.63e-14 | 151 |
| hsa0493121 | Liver | HCC | Insulin resistance | 77/4020 | 108/8465 | 3.89e-07 | 4.46e-06 | 2.48e-06 | 77 |
| hsa049794 | Liver | HCC | Cholesterol metabolism | 41/4020 | 51/8465 | 1.33e-06 | 1.35e-05 | 7.49e-06 | 41 |
| hsa0415241 | Liver | HCC | AMPK signaling pathway | 77/4020 | 121/8465 | 2.32e-04 | 1.11e-03 | 6.18e-04 | 77 |
| hsa0414521 | Liver | HCC | Phagosome | 93/4020 | 152/8465 | 4.27e-04 | 1.88e-03 | 1.05e-03 | 93 |
| hsa049202 | Liver | HCC | Adipocytokine signaling pathway | 45/4020 | 69/8465 | 2.19e-03 | 7.55e-03 | 4.20e-03 | 45 |
| hsa033204 | Liver | HCC | PPAR signaling pathway | 48/4020 | 75/8465 | 2.83e-03 | 9.37e-03 | 5.21e-03 | 48 |
| hsa0541742 | Liver | HCC | Lipid and atherosclerosis | 118/4020 | 215/8465 | 1.66e-02 | 3.92e-02 | 2.18e-02 | 118 |
| hsa0541532 | Liver | HCC | Diabetic cardiomyopathy | 151/4020 | 203/8465 | 2.72e-15 | 1.01e-13 | 5.63e-14 | 151 |
| hsa0493131 | Liver | HCC | Insulin resistance | 77/4020 | 108/8465 | 3.89e-07 | 4.46e-06 | 2.48e-06 | 77 |
| hsa049795 | Liver | HCC | Cholesterol metabolism | 41/4020 | 51/8465 | 1.33e-06 | 1.35e-05 | 7.49e-06 | 41 |
| hsa0415251 | Liver | HCC | AMPK signaling pathway | 77/4020 | 121/8465 | 2.32e-04 | 1.11e-03 | 6.18e-04 | 77 |
| hsa0414531 | Liver | HCC | Phagosome | 93/4020 | 152/8465 | 4.27e-04 | 1.88e-03 | 1.05e-03 | 93 |
| hsa049203 | Liver | HCC | Adipocytokine signaling pathway | 45/4020 | 69/8465 | 2.19e-03 | 7.55e-03 | 4.20e-03 | 45 |
| hsa033205 | Liver | HCC | PPAR signaling pathway | 48/4020 | 75/8465 | 2.83e-03 | 9.37e-03 | 5.21e-03 | 48 |
| hsa0541752 | Liver | HCC | Lipid and atherosclerosis | 118/4020 | 215/8465 | 1.66e-02 | 3.92e-02 | 2.18e-02 | 118 |
| Page: 1 |
Top |
Cell-cell communication analysis |
| Identification of potential cell-cell interactions between two cell types and their ligand-receptor pairs for different disease states |
| Ligand | Receptor | LRpair | Pathway | Tissue | Disease Stage |
| THBS1 | CD36 | THBS1_CD36 | THBS | Breast | DCIS |
| THBS2 | CD36 | THBS2_CD36 | THBS | Breast | DCIS |
| THBS3 | CD36 | THBS3_CD36 | THBS | Breast | DCIS |
| THBS1 | CD36 | THBS1_CD36 | THBS | Breast | Healthy |
| THBS2 | CD36 | THBS2_CD36 | THBS | Breast | Healthy |
| THBS1 | CD36 | THBS1_CD36 | THBS | Breast | IDC |
| THBS2 | CD36 | THBS2_CD36 | THBS | Breast | IDC |
| COMP | CD36 | COMP_CD36 | THBS | Breast | IDC |
| THBS1 | CD36 | THBS1_CD36 | THBS | Breast | Precancer |
| THBS2 | CD36 | THBS2_CD36 | THBS | Breast | Precancer |
| THBS1 | CD36 | THBS1_CD36 | THBS | CRC | ADJ |
| THBS1 | CD36 | THBS1_CD36 | THBS | CRC | CRC |
| THBS2 | CD36 | THBS2_CD36 | THBS | CRC | CRC |
| THBS1 | CD36 | THBS1_CD36 | THBS | CRC | FAP |
| THBS1 | CD36 | THBS1_CD36 | THBS | Endometrium | ADJ |
| THBS1 | CD36 | THBS1_CD36 | THBS | Endometrium | AEH |
| THBS2 | CD36 | THBS2_CD36 | THBS | Endometrium | AEH |
| THBS1 | CD36 | THBS1_CD36 | THBS | Endometrium | EEC |
| THBS2 | CD36 | THBS2_CD36 | THBS | Endometrium | EEC |
| THBS1 | CD36 | THBS1_CD36 | THBS | Esophagus | ESCC |
| Page: 1 |
Top |
Single-cell gene regulatory network inference analysis |
| Find out the significant the regulons (TFs) and the target genes of each regulon across cell types for different disease states |
| TF | Cell Type | Tissue | Disease Stage | Target Gene | RSS | Regulon Activity |
| ∗The dot plots of a searched regulon are shown for all cell subpopulations in each disease state of each tissue based on the regulon specific score inferred using pySCENIC and by calculating the average expression. |
| Page: 1 |
Top |
Somatic mutation of malignant transformation related genes |
| Annotation of somatic variants for genes involved in malignant transformation |
| Hugo Symbol | Variant Class | Variant Classification | dbSNP RS | HGVSc | HGVSp | HGVSp Short | SWISSPROT | BIOTYPE | SIFT | PolyPhen | Tumor Sample Barcode | Tissue | Histology | Sex | Age | Stage | Therapy Types | Drugs | Outcome |
| CD36 | SNV | Missense_Mutation | rs750187438 | c.1006N>A | p.Gly336Arg | p.G336R | P16671 | protein_coding | deleterious(0.04) | benign(0.358) | TCGA-AC-A23H-01 | Breast | breast invasive carcinoma | Female | >=65 | I/II | Unknown | Unknown | PD |
| CD36 | SNV | Missense_Mutation | rs138937215 | c.844G>A | p.Asp282Asn | p.D282N | P16671 | protein_coding | deleterious(0.01) | benign(0.072) | TCGA-AN-A046-01 | Breast | breast invasive carcinoma | Female | >=65 | I/II | Unknown | Unknown | SD |
| CD36 | SNV | Missense_Mutation | rs187500047 | c.1157N>A | p.Arg386Gln | p.R386Q | P16671 | protein_coding | deleterious(0.01) | possibly_damaging(0.831) | TCGA-AN-A0AK-01 | Breast | breast invasive carcinoma | Female | >=65 | I/II | Unknown | Unknown | SD |
| CD36 | SNV | Missense_Mutation | c.122N>T | p.Gln41Leu | p.Q41L | P16671 | protein_coding | deleterious(0) | benign(0.029) | TCGA-BH-A0E7-01 | Breast | breast invasive carcinoma | Female | >=65 | I/II | Hormone Therapy | arimidex | SD | |
| CD36 | SNV | Missense_Mutation | novel | c.970N>A | p.Ser324Thr | p.S324T | P16671 | protein_coding | tolerated(0.4) | benign(0.124) | TCGA-LL-A5YP-01 | Breast | breast invasive carcinoma | Female | <65 | I/II | Chemotherapy | cytoxan | SD |
| CD36 | SNV | Missense_Mutation | c.922N>A | p.Asp308Asn | p.D308N | P16671 | protein_coding | deleterious(0.02) | probably_damaging(0.963) | TCGA-JW-A5VL-01 | Cervix | cervical & endocervical cancer | Female | <65 | I/II | Unknown | Unknown | SD | |
| CD36 | SNV | Missense_Mutation | c.798N>A | p.Phe266Leu | p.F266L | P16671 | protein_coding | tolerated(0.1) | probably_damaging(0.999) | TCGA-A6-6141-01 | Colorectum | colon adenocarcinoma | Male | <65 | I/II | Chemotherapy | 5-fu | SD | |
| CD36 | SNV | Missense_Mutation | c.404T>C | p.Phe135Ser | p.F135S | P16671 | protein_coding | tolerated(0.06) | benign(0.403) | TCGA-AA-3939-01 | Colorectum | colon adenocarcinoma | Male | >=65 | I/II | Unknown | Unknown | SD | |
| CD36 | SNV | Missense_Mutation | c.1117N>G | p.Ile373Val | p.I373V | P16671 | protein_coding | tolerated(1) | benign(0.001) | TCGA-AZ-6598-01 | Colorectum | colon adenocarcinoma | Female | >=65 | I/II | Unknown | Unknown | SD | |
| CD36 | SNV | Missense_Mutation | novel | c.883C>A | p.Leu295Ile | p.L295I | P16671 | protein_coding | tolerated(0.16) | possibly_damaging(0.772) | TCGA-CA-6717-01 | Colorectum | colon adenocarcinoma | Male | <65 | I/II | Chemotherapy | oxaliplatin | CR |
| Page: 1 2 3 4 5 6 7 |
Top |
Related drugs of malignant transformation related genes |
| Identification of chemicals and drugs interact with genes involved in malignant transfromation |
| (DGIdb 4.0) |
| Entrez ID | Symbol | Category | Interaction Types | Drug Claim Name | Drug Name | PMIDs |
| 948 | CD36 | CELL SURFACE, EXTERNAL SIDE OF PLASMA MEMBRANE, TRANSPORTER, DRUGGABLE GENOME, CLINICALLY ACTIONABLE | antagonist | 404859035 | ||
| 948 | CD36 | CELL SURFACE, EXTERNAL SIDE OF PLASMA MEMBRANE, TRANSPORTER, DRUGGABLE GENOME, CLINICALLY ACTIONABLE | ABT-510 | ABT-510 |
| Page: 1 |

Copyright 2023-Present -The University of Texas Health Science Center at Houston |