
|
|||||
|
 | |
| |
| |
| |
| |
| |
|
Gene: CD320 |
Gene summary for CD320 |
| Gene information | Species | Human | Gene symbol | CD320 | Gene ID | 51293 |
| Gene name | CD320 molecule | |
| Gene Alias | 8D6 | |
| Cytomap | 19p13.2 | |
| Gene Type | protein-coding | GO ID | GO:0001775 | UniProtAcc | Q9NPF0 |
Top |
Malignant transformation analysis |
| Identification of the aberrant gene expression in precancerous and cancerous lesions by comparing the gene expression of stem-like cells in diseased tissues with normal stem cells |
| Entrez ID | Symbol | Replicates | Species | Organ | Tissue | Adj P-value | Log2FC | Malignancy |
| 51293 | CD320 | LZE4T | Human | Esophagus | ESCC | 2.65e-13 | 5.10e-01 | 0.0811 |
| 51293 | CD320 | LZE7T | Human | Esophagus | ESCC | 1.85e-25 | 1.55e+00 | 0.0667 |
| 51293 | CD320 | LZE22D1 | Human | Esophagus | HGIN | 1.07e-02 | 1.34e-01 | 0.0595 |
| 51293 | CD320 | LZE22T | Human | Esophagus | ESCC | 1.91e-07 | 3.48e-01 | 0.068 |
| 51293 | CD320 | LZE24T | Human | Esophagus | ESCC | 1.28e-06 | 3.48e-01 | 0.0596 |
| 51293 | CD320 | LZE21T | Human | Esophagus | ESCC | 2.31e-04 | 6.25e-01 | 0.0655 |
| 51293 | CD320 | LZE6T | Human | Esophagus | ESCC | 9.21e-09 | 4.99e-01 | 0.0845 |
| 51293 | CD320 | P1T-E | Human | Esophagus | ESCC | 2.78e-05 | 3.48e-01 | 0.0875 |
| 51293 | CD320 | P2T-E | Human | Esophagus | ESCC | 1.35e-15 | 3.44e-01 | 0.1177 |
| 51293 | CD320 | P4T-E | Human | Esophagus | ESCC | 1.80e-41 | 1.24e+00 | 0.1323 |
| 51293 | CD320 | P5T-E | Human | Esophagus | ESCC | 1.15e-31 | 7.29e-01 | 0.1327 |
| 51293 | CD320 | P8T-E | Human | Esophagus | ESCC | 2.75e-08 | 4.10e-01 | 0.0889 |
| 51293 | CD320 | P9T-E | Human | Esophagus | ESCC | 2.52e-31 | 9.06e-01 | 0.1131 |
| 51293 | CD320 | P10T-E | Human | Esophagus | ESCC | 4.02e-62 | 1.30e+00 | 0.116 |
| 51293 | CD320 | P11T-E | Human | Esophagus | ESCC | 4.14e-14 | 7.69e-01 | 0.1426 |
| 51293 | CD320 | P12T-E | Human | Esophagus | ESCC | 1.21e-37 | 7.46e-01 | 0.1122 |
| 51293 | CD320 | P15T-E | Human | Esophagus | ESCC | 6.03e-25 | 6.23e-01 | 0.1149 |
| 51293 | CD320 | P16T-E | Human | Esophagus | ESCC | 2.03e-36 | 8.54e-01 | 0.1153 |
| 51293 | CD320 | P17T-E | Human | Esophagus | ESCC | 1.60e-25 | 1.09e+00 | 0.1278 |
| 51293 | CD320 | P19T-E | Human | Esophagus | ESCC | 2.56e-14 | 1.01e+00 | 0.1662 |
| Page: 1 2 3 4 5 6 |
| Tissue | Expression Dynamics | Abbreviation |
| Esophagus | 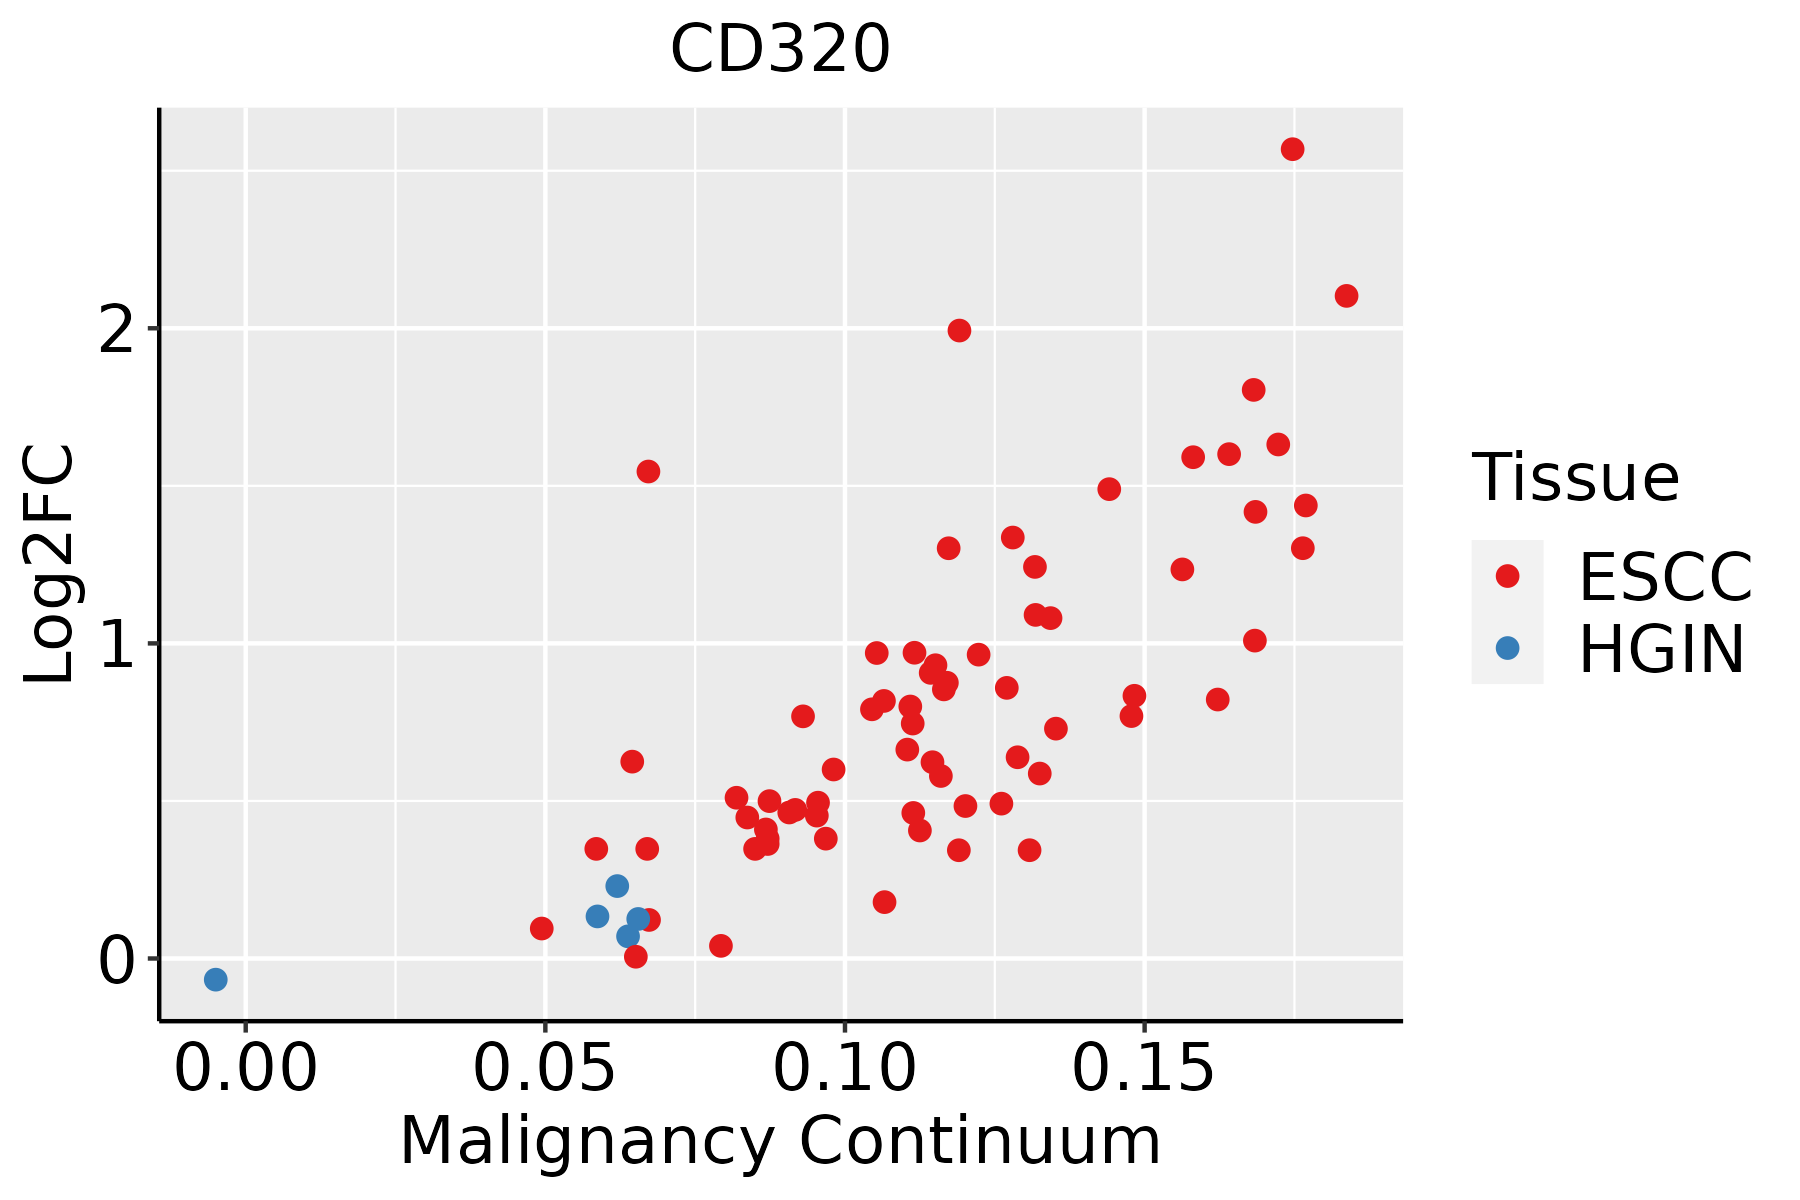 | ESCC: Esophageal squamous cell carcinoma |
| HGIN: High-grade intraepithelial neoplasias | ||
| LGIN: Low-grade intraepithelial neoplasias | ||
| Liver | 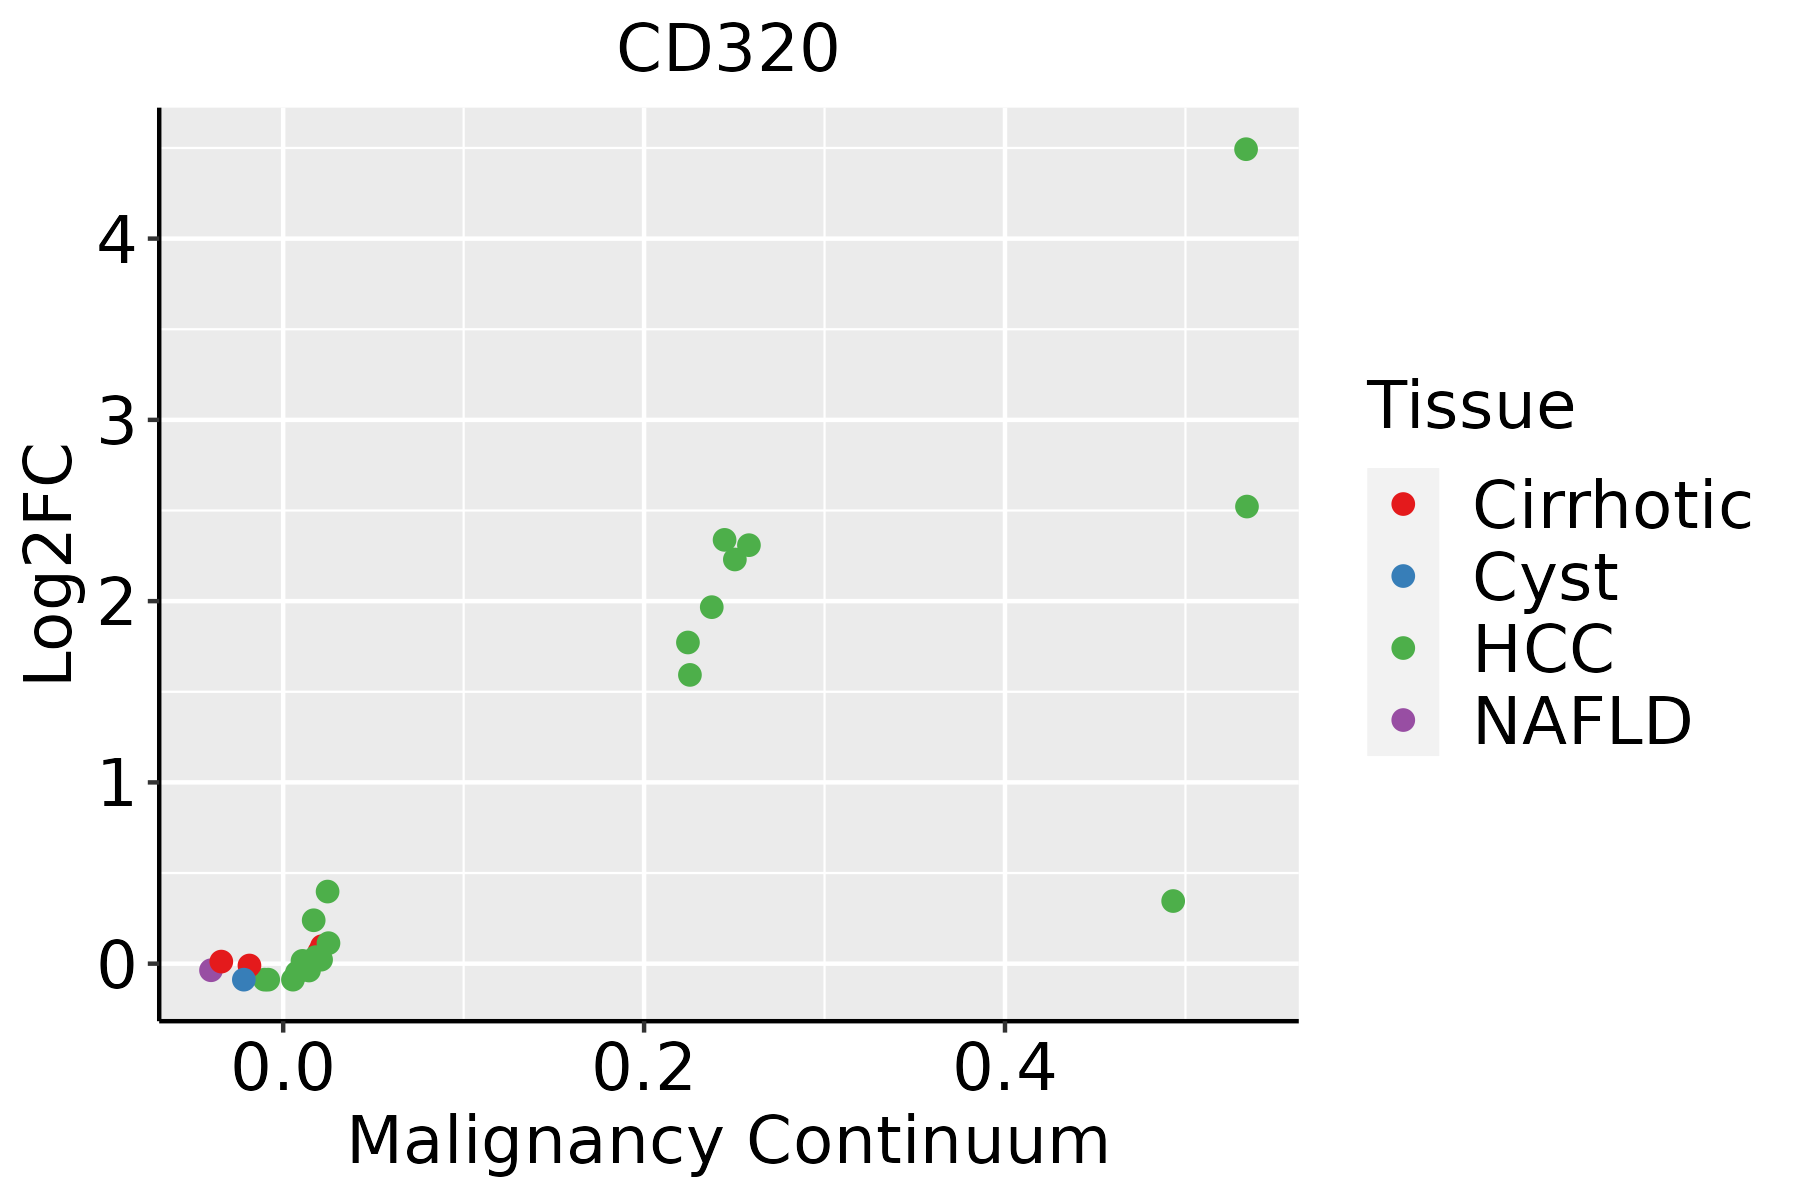 | HCC: Hepatocellular carcinoma |
| NAFLD: Non-alcoholic fatty liver disease | ||
| Oral Cavity | 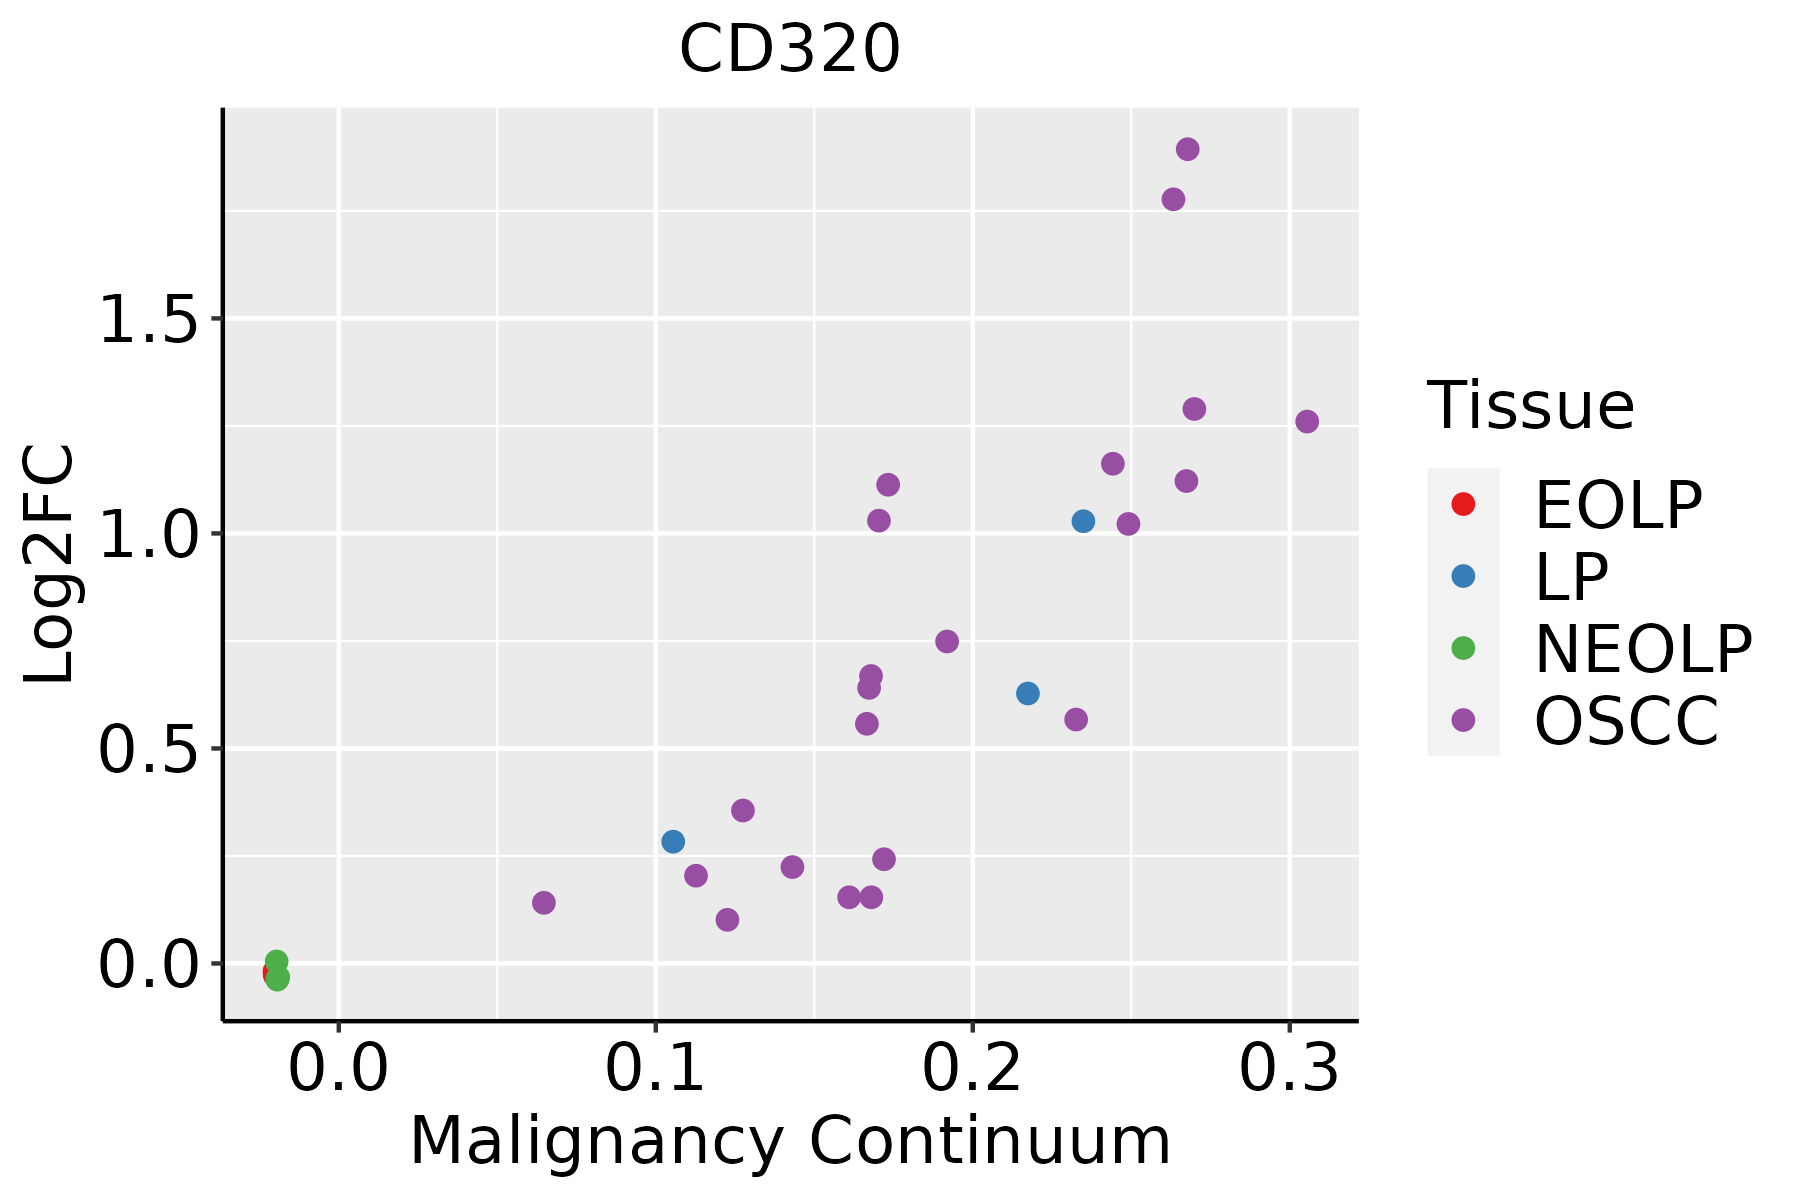 | EOLP: Erosive Oral lichen planus |
| LP: leukoplakia | ||
| NEOLP: Non-erosive oral lichen planus | ||
| OSCC: Oral squamous cell carcinoma | ||
| Skin |  | AK: Actinic keratosis |
| cSCC: Cutaneous squamous cell carcinoma | ||
| SCCIS:squamous cell carcinoma in situ | ||
| Thyroid | 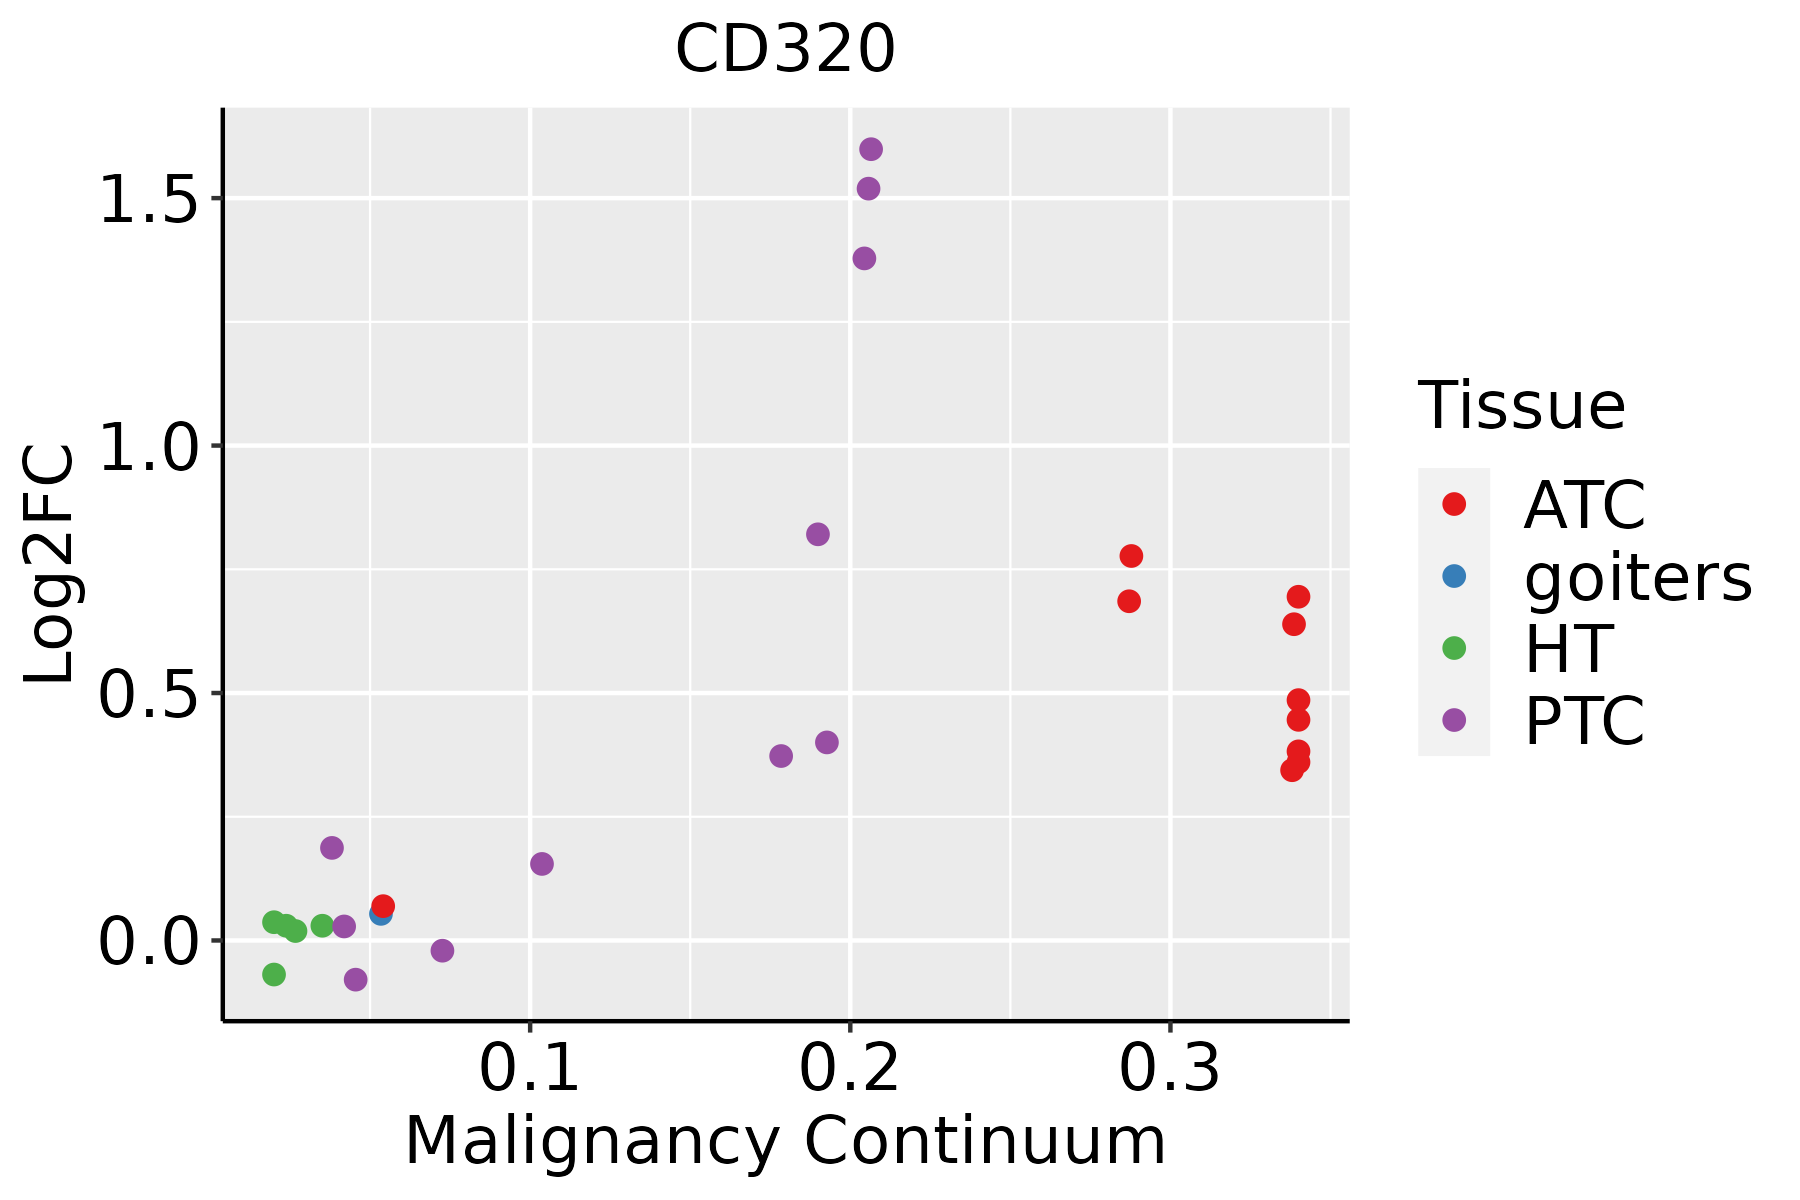 | ATC: Anaplastic thyroid cancer |
| HT: Hashimoto's thyroiditis | ||
| PTC: Papillary thyroid cancer |
| ∗log2FC in expression of this searched gene in stem-like cells from each diseased tissue sample relative to stem-like cells in normal samples in each tissue plotted against the malignancy continuum. Samples are colored based on if they are from different disease stage. |
Top |
Malignant transformation related pathway analysis |
| Find out the enriched GO biological processes and KEGG pathways involved in transition from healthy to precancer to cancer |
| Tissue | Disease Stage | Enriched GO biological Processes |
| Colorectum | AD |  |
| Colorectum | SER |  |
| Colorectum | MSS |  |
| Colorectum | MSI-H |  |
| Colorectum | FAP |  |
| ∗Top 15 enriched GO BP terms are showed in the bar plot of each disease state in each tissue. Each row represents a significant GO biological process which is colored according to the -log10(p.adjust). |
| Page: 1 2 3 4 5 6 7 8 9 |
| GO ID | Tissue | Disease Stage | Description | Gene Ratio | Bg Ratio | pvalue | p.adjust | Count |
| GO:00067671 | Esophagus | ESCC | water-soluble vitamin metabolic process | 41/8552 | 59/18723 | 1.84e-04 | 1.17e-03 | 41 |
| GO:00067661 | Esophagus | ESCC | vitamin metabolic process | 67/8552 | 106/18723 | 2.03e-04 | 1.28e-03 | 67 |
| GO:00330132 | Esophagus | ESCC | tetrapyrrole metabolic process | 37/8552 | 59/18723 | 6.23e-03 | 2.29e-02 | 37 |
| GO:0006767 | Liver | HCC | water-soluble vitamin metabolic process | 39/7958 | 59/18723 | 2.14e-04 | 1.63e-03 | 39 |
| GO:00330131 | Liver | HCC | tetrapyrrole metabolic process | 39/7958 | 59/18723 | 2.14e-04 | 1.63e-03 | 39 |
| GO:0006766 | Liver | HCC | vitamin metabolic process | 57/7958 | 106/18723 | 1.25e-02 | 4.53e-02 | 57 |
| GO:00706618 | Oral cavity | OSCC | leukocyte proliferation | 145/7305 | 318/18723 | 9.31e-03 | 3.33e-02 | 145 |
| GO:00466517 | Oral cavity | OSCC | lymphocyte proliferation | 131/7305 | 288/18723 | 1.41e-02 | 4.67e-02 | 131 |
| GO:00706657 | Oral cavity | OSCC | positive regulation of leukocyte proliferation | 72/7305 | 150/18723 | 1.53e-02 | 4.95e-02 | 72 |
| GO:00067672 | Skin | cSCC | water-soluble vitamin metabolic process | 24/4864 | 59/18723 | 9.59e-03 | 4.30e-02 | 24 |
| Page: 1 |
| Pathway ID | Tissue | Disease Stage | Description | Gene Ratio | Bg Ratio | pvalue | p.adjust | qvalue | Count |
| Page: 1 |
Top |
Cell-cell communication analysis |
| Identification of potential cell-cell interactions between two cell types and their ligand-receptor pairs for different disease states |
| Ligand | Receptor | LRpair | Pathway | Tissue | Disease Stage |
| Page: 1 |
Top |
Single-cell gene regulatory network inference analysis |
| Find out the significant the regulons (TFs) and the target genes of each regulon across cell types for different disease states |
| TF | Cell Type | Tissue | Disease Stage | Target Gene | RSS | Regulon Activity |
| ∗The dot plots of a searched regulon are shown for all cell subpopulations in each disease state of each tissue based on the regulon specific score inferred using pySCENIC and by calculating the average expression. |
| Page: 1 |
Top |
Somatic mutation of malignant transformation related genes |
| Annotation of somatic variants for genes involved in malignant transformation |
| Hugo Symbol | Variant Class | Variant Classification | dbSNP RS | HGVSc | HGVSp | HGVSp Short | SWISSPROT | BIOTYPE | SIFT | PolyPhen | Tumor Sample Barcode | Tissue | Histology | Sex | Age | Stage | Therapy Types | Drugs | Outcome |
| CD320 | insertion | In_Frame_Ins | novel | c.480_481insAAACCTGTAATCCGAGCTACTCAGGAGGCTGAG | p.Asp160_Ser161insLysProValIleArgAlaThrGlnGluAlaGlu | p.D160_S161insKPVIRATQEAE | Q9NPF0 | protein_coding | TCGA-A2-A0D1-01 | Breast | breast invasive carcinoma | Female | >=65 | I/II | Chemotherapy | taxotere | SD | ||
| CD320 | SNV | Missense_Mutation | rs368024906 | c.521N>T | p.Pro174Leu | p.P174L | Q9NPF0 | protein_coding | tolerated(0.26) | benign(0) | TCGA-2W-A8YY-01 | Cervix | cervical & endocervical cancer | Female | <65 | I/II | Chemotherapy | cisplatin | CR |
| CD320 | SNV | Missense_Mutation | rs376511243 | c.158N>T | p.Ser53Leu | p.S53L | Q9NPF0 | protein_coding | deleterious(0.03) | probably_damaging(0.995) | TCGA-DG-A2KJ-01 | Cervix | cervical & endocervical cancer | Female | <65 | III/IV | Chemotherapy | cisplatin | SD |
| CD320 | SNV | Missense_Mutation | c.128N>T | p.Ser43Phe | p.S43F | Q9NPF0 | protein_coding | tolerated(0.71) | benign(0.003) | TCGA-DR-A0ZM-01 | Cervix | cervical & endocervical cancer | Female | <65 | III/IV | Unspecific | Cisplatin | SD | |
| CD320 | SNV | Missense_Mutation | rs760524953 | c.337G>A | p.Val113Ile | p.V113I | Q9NPF0 | protein_coding | tolerated(1) | benign(0) | TCGA-EA-A410-01 | Cervix | cervical & endocervical cancer | Female | <65 | I/II | Unknown | Unknown | SD |
| CD320 | SNV | Missense_Mutation | c.713T>G | p.Leu238Arg | p.L238R | Q9NPF0 | protein_coding | deleterious(0) | probably_damaging(0.997) | TCGA-AA-3947-01 | Colorectum | colon adenocarcinoma | Female | <65 | I/II | Unknown | Unknown | SD | |
| CD320 | SNV | Missense_Mutation | c.461N>A | p.Gly154Asp | p.G154D | Q9NPF0 | protein_coding | deleterious(0.03) | probably_damaging(0.993) | TCGA-CK-5916-01 | Colorectum | colon adenocarcinoma | Female | >=65 | I/II | Unknown | Unknown | PD | |
| CD320 | SNV | Missense_Mutation | c.149N>A | p.Ser50Asn | p.S50N | Q9NPF0 | protein_coding | deleterious(0.04) | benign(0.175) | TCGA-D5-6928-01 | Colorectum | colon adenocarcinoma | Male | >=65 | I/II | Unknown | Unknown | SD | |
| CD320 | SNV | Missense_Mutation | c.790T>A | p.Leu264Ile | p.L264I | Q9NPF0 | protein_coding | deleterious(0.03) | probably_damaging(0.987) | TCGA-D5-6930-01 | Colorectum | colon adenocarcinoma | Male | >=65 | I/II | Unknown | Unknown | SD | |
| CD320 | SNV | Missense_Mutation | rs57195458 | c.184C>T | p.Arg62Cys | p.R62C | Q9NPF0 | protein_coding | deleterious(0) | benign(0.387) | TCGA-AJ-A3BH-01 | Endometrium | uterine corpus endometrioid carcinoma | Female | Unknown | I/II | Unknown | Unknown | SD |
| Page: 1 2 3 |
Top |
Related drugs of malignant transformation related genes |
| Identification of chemicals and drugs interact with genes involved in malignant transfromation |
| (DGIdb 4.0) |
| Entrez ID | Symbol | Category | Interaction Types | Drug Claim Name | Drug Name | PMIDs |
| Page: 1 |

Copyright 2023-Present -The University of Texas Health Science Center at Houston |