| Tissue | Expression Dynamics | Abbreviation |
| Esophagus | 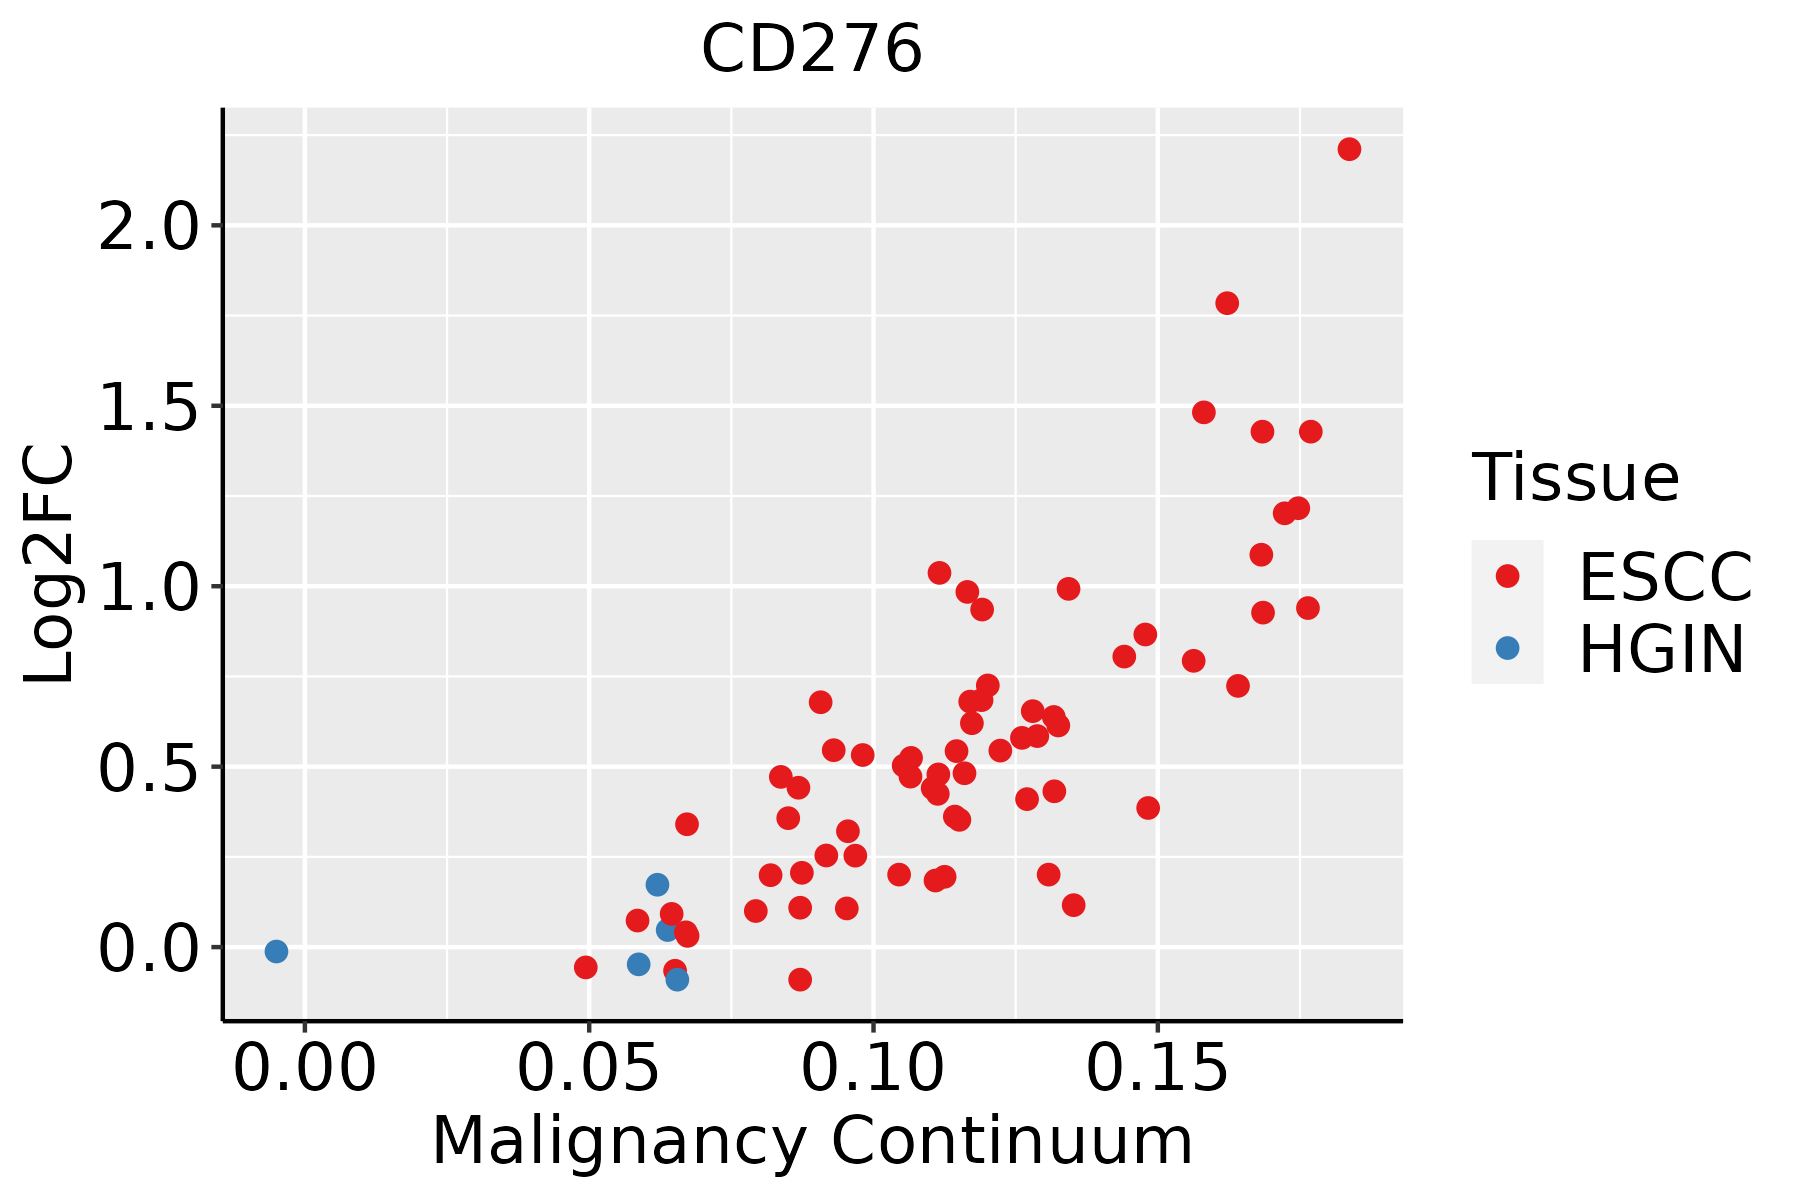 | ESCC: Esophageal squamous cell carcinoma |
| HGIN: High-grade intraepithelial neoplasias |
| LGIN: Low-grade intraepithelial neoplasias |
| Liver | 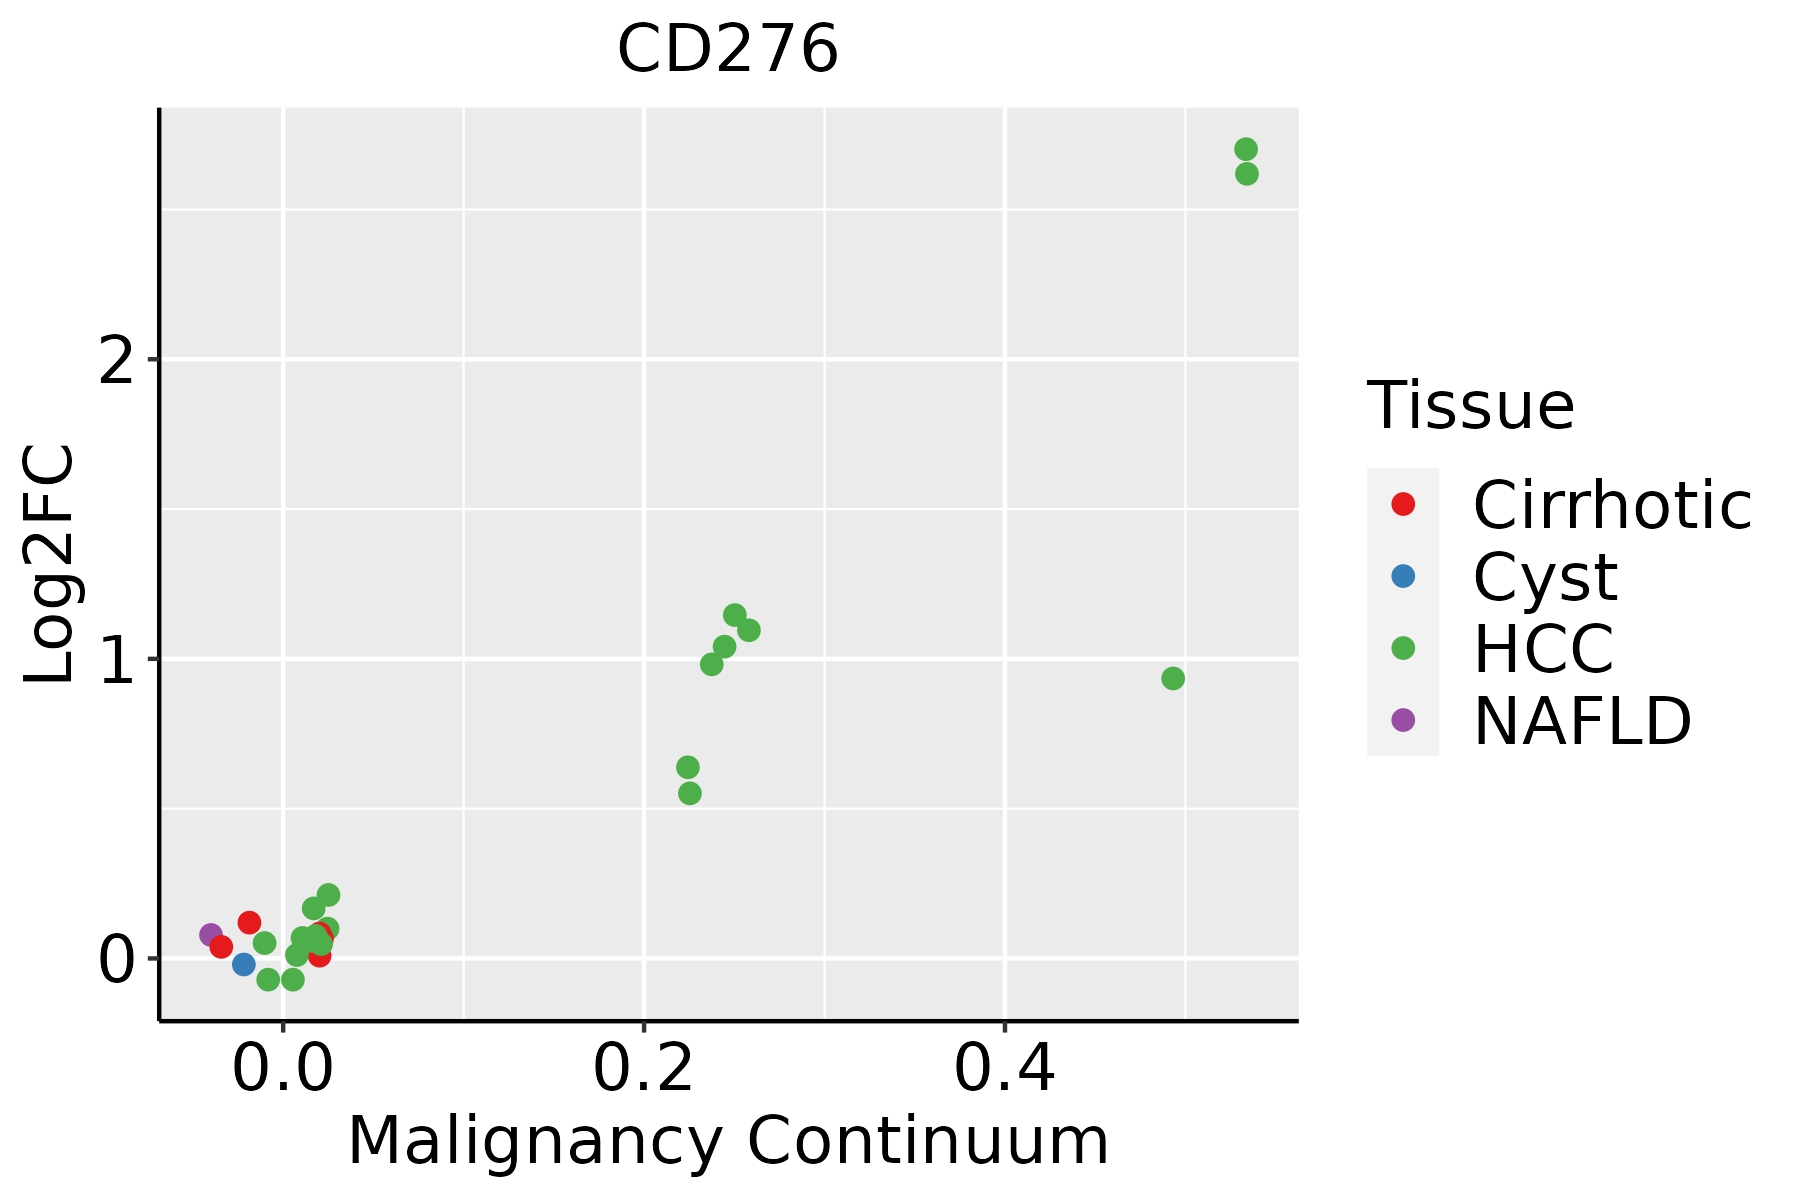 | HCC: Hepatocellular carcinoma |
| NAFLD: Non-alcoholic fatty liver disease |
| Oral Cavity |  | EOLP: Erosive Oral lichen planus |
| LP: leukoplakia |
| NEOLP: Non-erosive oral lichen planus |
| OSCC: Oral squamous cell carcinoma |
| Skin | 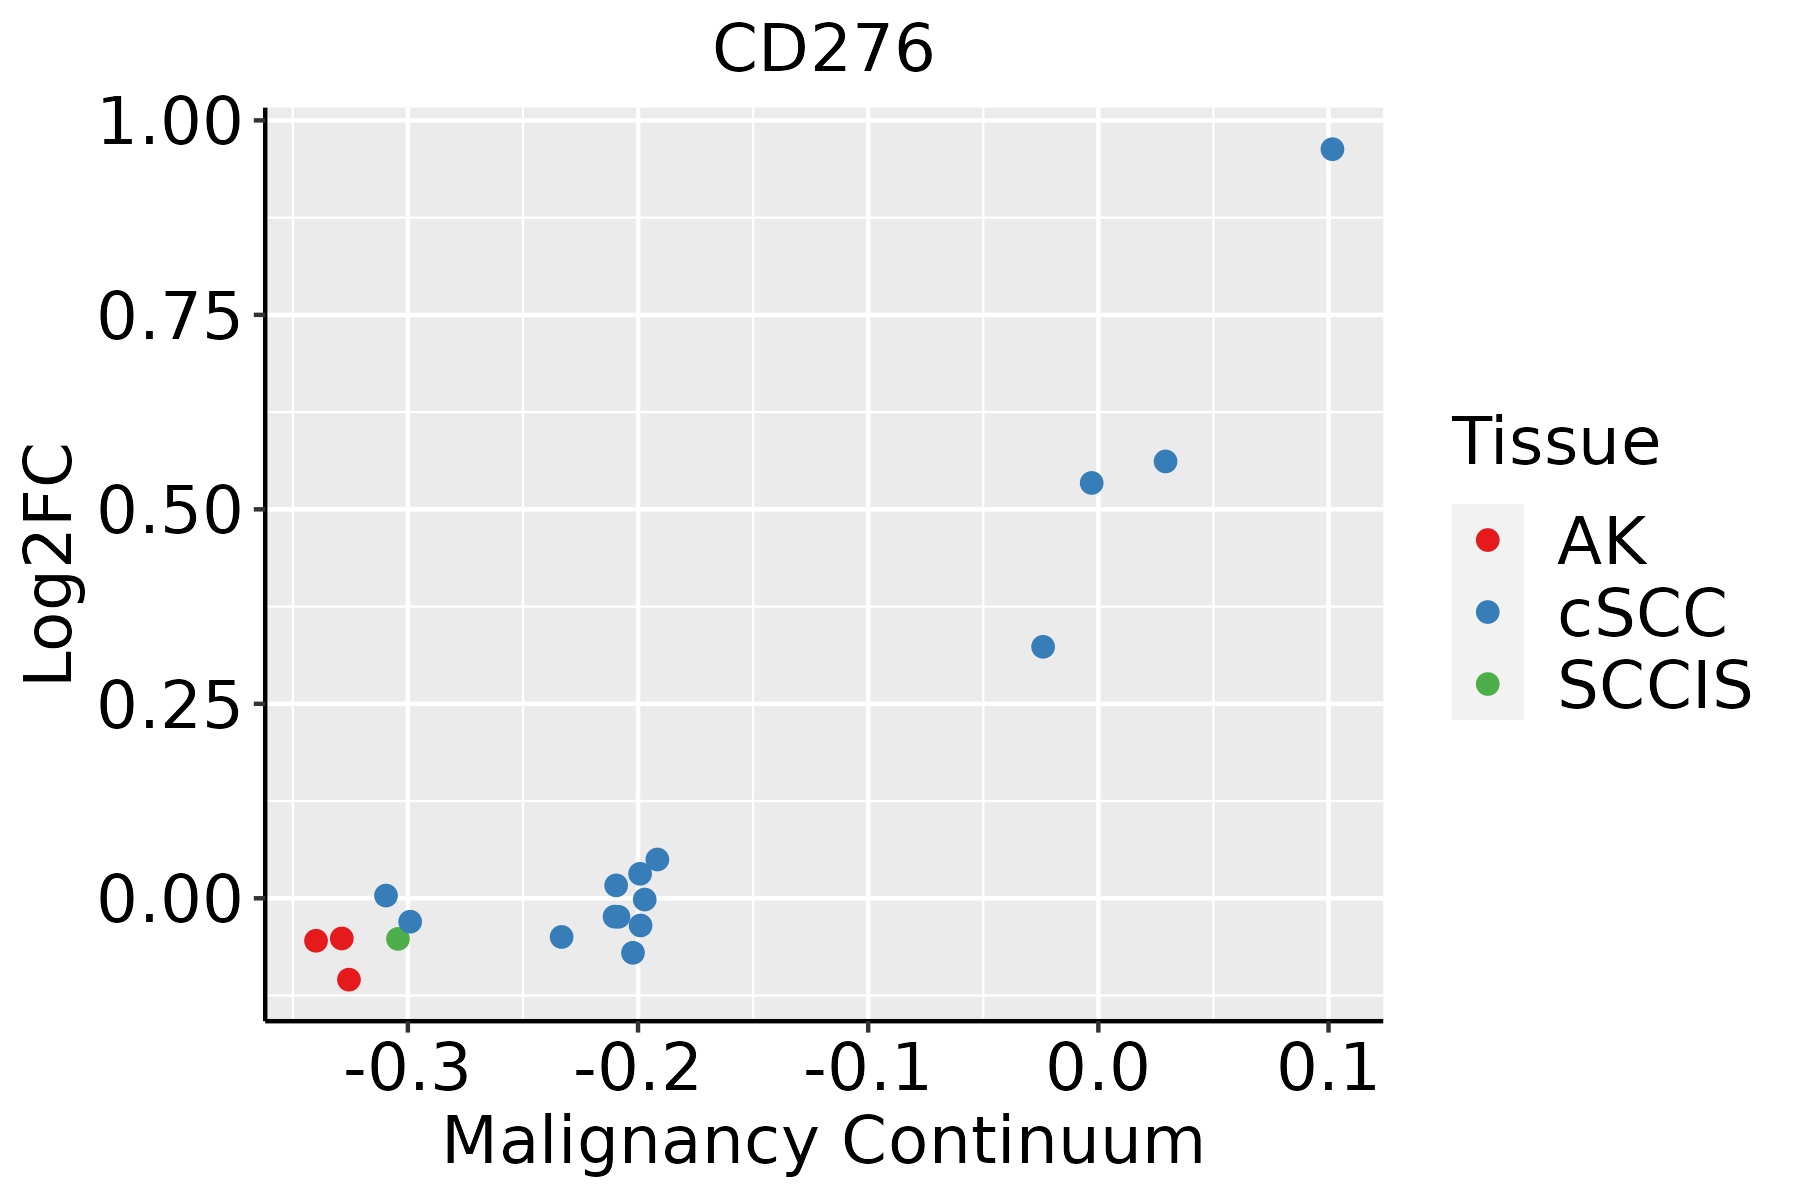 | AK: Actinic keratosis |
| cSCC: Cutaneous squamous cell carcinoma |
| SCCIS:squamous cell carcinoma in situ |
| Thyroid | 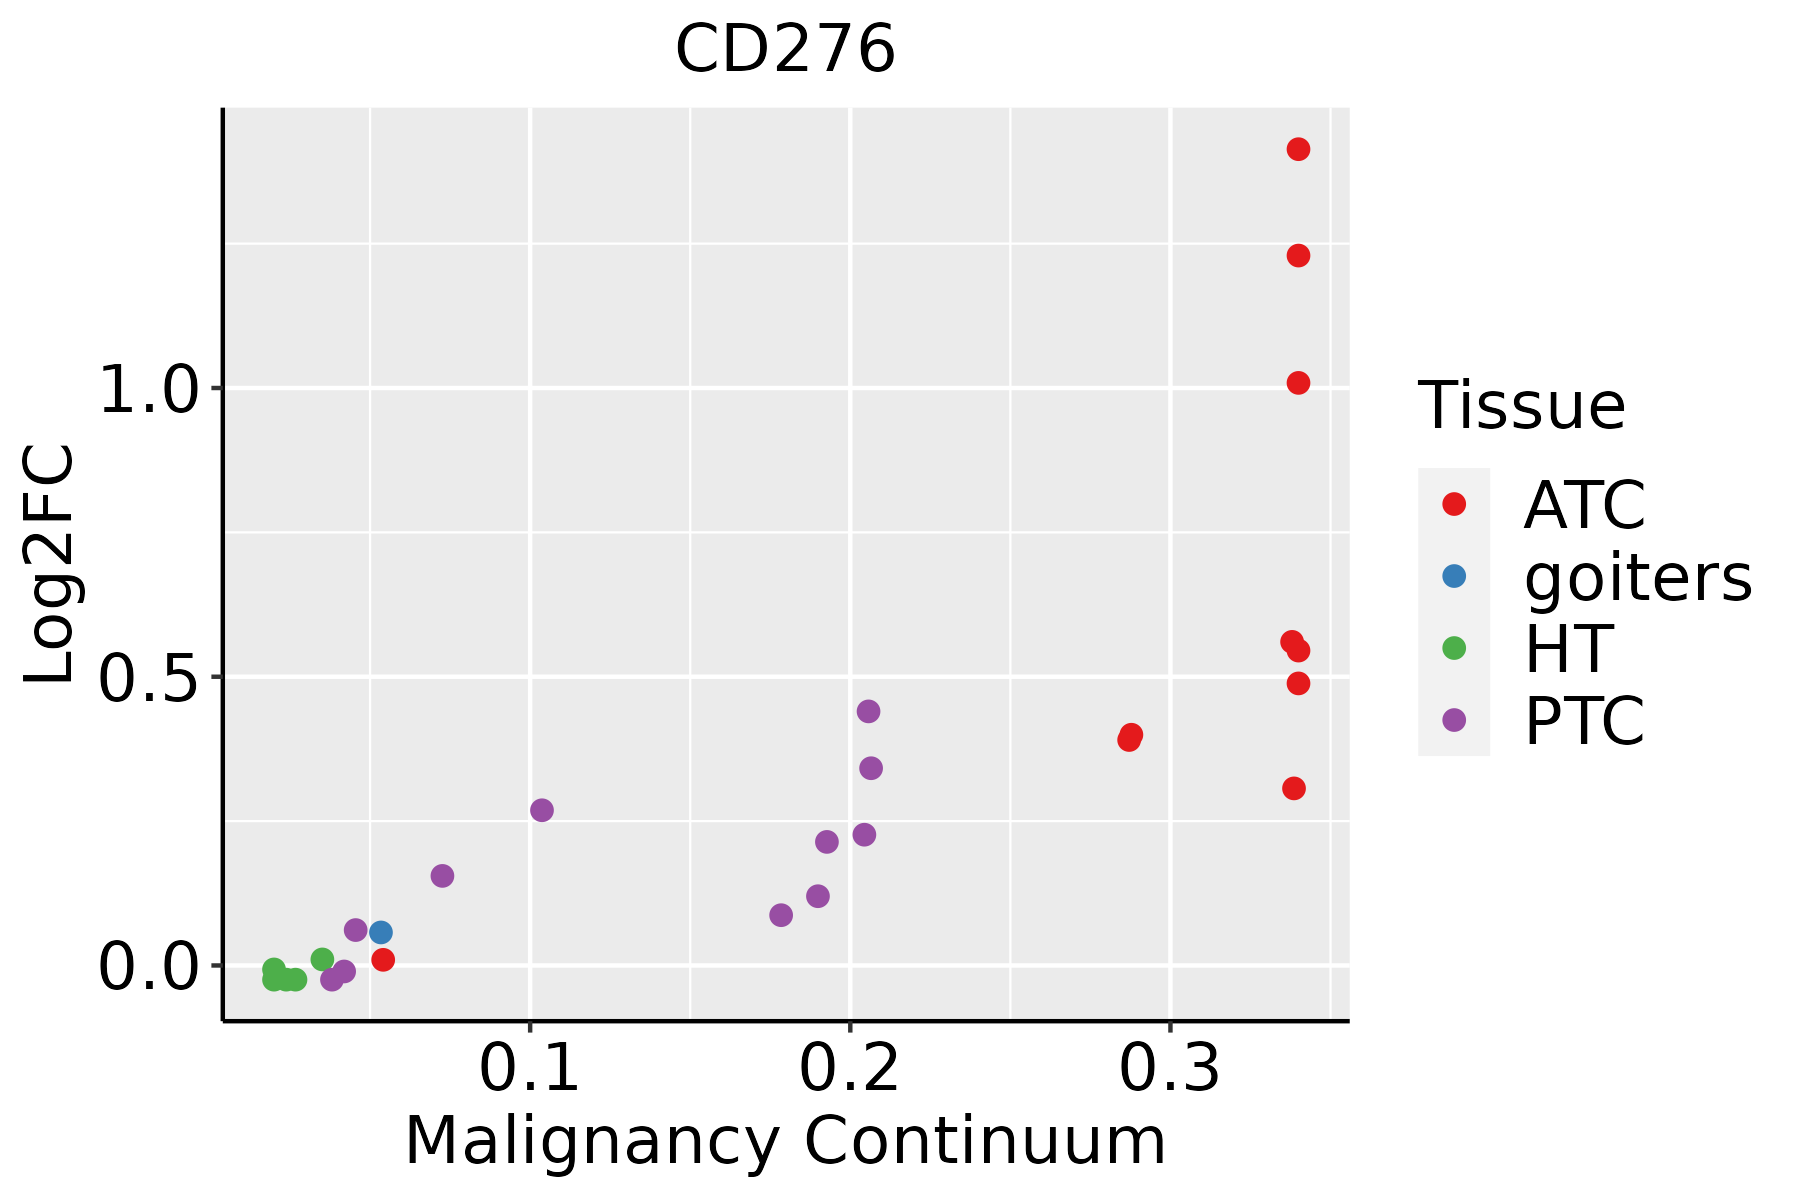 | ATC: Anaplastic thyroid cancer |
| HT: Hashimoto's thyroiditis |
| PTC: Papillary thyroid cancer |
| GO ID | Tissue | Disease Stage | Description | Gene Ratio | Bg Ratio | pvalue | p.adjust | Count |
| GO:004578527 | Esophagus | ESCC | positive regulation of cell adhesion | 255/8552 | 437/18723 | 5.07e-08 | 9.11e-07 | 255 |
| GO:002240720 | Esophagus | ESCC | regulation of cell-cell adhesion | 239/8552 | 448/18723 | 5.88e-04 | 3.19e-03 | 239 |
| GO:004211018 | Esophagus | ESCC | T cell activation | 256/8552 | 487/18723 | 1.18e-03 | 5.87e-03 | 256 |
| GO:002240919 | Esophagus | ESCC | positive regulation of cell-cell adhesion | 155/8552 | 284/18723 | 1.50e-03 | 7.06e-03 | 155 |
| GO:00508528 | Esophagus | ESCC | T cell receptor signaling pathway | 73/8552 | 123/18723 | 1.54e-03 | 7.24e-03 | 73 |
| GO:000181916 | Esophagus | ESCC | positive regulation of cytokine production | 244/8552 | 467/18723 | 2.29e-03 | 1.01e-02 | 244 |
| GO:005087015 | Esophagus | ESCC | positive regulation of T cell activation | 117/8552 | 216/18723 | 7.23e-03 | 2.62e-02 | 117 |
| GO:190303916 | Esophagus | ESCC | positive regulation of leukocyte cell-cell adhesion | 128/8552 | 239/18723 | 8.40e-03 | 2.96e-02 | 128 |
| GO:000715918 | Esophagus | ESCC | leukocyte cell-cell adhesion | 192/8552 | 371/18723 | 1.03e-02 | 3.51e-02 | 192 |
| GO:190303717 | Esophagus | ESCC | regulation of leukocyte cell-cell adhesion | 174/8552 | 336/18723 | 1.36e-02 | 4.43e-02 | 174 |
| GO:004578512 | Liver | HCC | positive regulation of cell adhesion | 215/7958 | 437/18723 | 2.53e-03 | 1.22e-02 | 215 |
| GO:004578520 | Oral cavity | OSCC | positive regulation of cell adhesion | 225/7305 | 437/18723 | 6.06e-08 | 1.09e-06 | 225 |
| GO:004211016 | Oral cavity | OSCC | T cell activation | 245/7305 | 487/18723 | 2.00e-07 | 3.22e-06 | 245 |
| GO:002240718 | Oral cavity | OSCC | regulation of cell-cell adhesion | 218/7305 | 448/18723 | 1.71e-05 | 1.68e-04 | 218 |
| GO:005086315 | Oral cavity | OSCC | regulation of T cell activation | 161/7305 | 329/18723 | 1.44e-04 | 1.02e-03 | 161 |
| GO:00508527 | Oral cavity | OSCC | T cell receptor signaling pathway | 68/7305 | 123/18723 | 1.80e-04 | 1.22e-03 | 68 |
| GO:000715916 | Oral cavity | OSCC | leukocyte cell-cell adhesion | 178/7305 | 371/18723 | 2.44e-04 | 1.57e-03 | 178 |
| GO:190303715 | Oral cavity | OSCC | regulation of leukocyte cell-cell adhesion | 162/7305 | 336/18723 | 3.39e-04 | 2.08e-03 | 162 |
| GO:004209816 | Oral cavity | OSCC | T cell proliferation | 100/7305 | 199/18723 | 7.93e-04 | 4.27e-03 | 100 |
| GO:002240917 | Oral cavity | OSCC | positive regulation of cell-cell adhesion | 136/7305 | 284/18723 | 1.35e-03 | 6.62e-03 | 136 |
| Hugo Symbol | Variant Class | Variant Classification | dbSNP RS | HGVSc | HGVSp | HGVSp Short | SWISSPROT | BIOTYPE | SIFT | PolyPhen | Tumor Sample Barcode | Tissue | Histology | Sex | Age | Stage | Therapy Types | Drugs | Outcome |
| CD276 | SNV | Missense_Mutation | novel | c.1043N>C | p.Gly348Ala | p.G348A | Q5ZPR3 | protein_coding | tolerated(0.2) | benign(0.349) | TCGA-A7-A6VY-01 | Breast | breast invasive carcinoma | Female | <65 | I/II | Chemotherapy | cyclophosphamide | CR |
| CD276 | SNV | Missense_Mutation | | c.787N>A | p.Asp263Asn | p.D263N | Q5ZPR3 | protein_coding | deleterious(0.02) | possibly_damaging(0.74) | TCGA-D8-A27G-01 | Breast | breast invasive carcinoma | Female | >=65 | I/II | Unknown | Unknown | SD |
| CD276 | insertion | In_Frame_Ins | novel | c.308_309insCCT | p.Gly103_Asn104insLeu | p.G103_N104insL | Q5ZPR3 | protein_coding | | | TCGA-A8-A08H-01 | Breast | breast invasive carcinoma | Female | >=65 | I/II | Unknown | Unknown | SD |
| CD276 | insertion | Frame_Shift_Ins | novel | c.310_311insCCACCATATTTAAAGGT | p.Asn104ThrfsTer10 | p.N104Tfs*10 | Q5ZPR3 | protein_coding | | | TCGA-A8-A08H-01 | Breast | breast invasive carcinoma | Female | >=65 | I/II | Unknown | Unknown | SD |
| CD276 | deletion | Frame_Shift_Del | novel | c.146delN | p.Cys49SerfsTer21 | p.C49Sfs*21 | Q5ZPR3 | protein_coding | | | TCGA-EW-A2FV-01 | Breast | breast invasive carcinoma | Female | <65 | III/IV | Chemotherapy | docetaxel | SD |
| CD276 | SNV | Missense_Mutation | rs141119771 | c.334N>A | p.Val112Met | p.V112M | Q5ZPR3 | protein_coding | deleterious(0) | probably_damaging(0.963) | TCGA-EA-A3HS-01 | Cervix | cervical & endocervical cancer | Female | <65 | I/II | Unknown | Unknown | SD |
| CD276 | SNV | Missense_Mutation | rs562558740 | c.274N>T | p.Arg92Cys | p.R92C | Q5ZPR3 | protein_coding | deleterious(0) | probably_damaging(0.998) | TCGA-ZX-AA5X-01 | Cervix | cervical & endocervical cancer | Female | <65 | III/IV | Unknown | Unknown | SD |
| CD276 | insertion | In_Frame_Ins | novel | c.709_710insGGG | p.Ile237delinsArgVal | p.I237delinsRV | Q5ZPR3 | protein_coding | | | TCGA-DS-A1OB-01 | Cervix | cervical & endocervical cancer | Female | <65 | I/II | Chemotherapy | carboplatin | PD |
| CD276 | SNV | Missense_Mutation | rs562558740 | c.274N>T | p.Arg92Cys | p.R92C | Q5ZPR3 | protein_coding | deleterious(0) | probably_damaging(0.998) | TCGA-A6-5661-01 | Colorectum | colon adenocarcinoma | Female | >=65 | I/II | Unknown | Unknown | SD |
| CD276 | SNV | Missense_Mutation | | c.1585G>T | p.Asp529Tyr | p.D529Y | Q5ZPR3 | protein_coding | deleterious_low_confidence(0) | possibly_damaging(0.907) | TCGA-AA-3510-01 | Colorectum | colon adenocarcinoma | Male | >=65 | I/II | Unknown | Unknown | SD |
| Entrez ID | Symbol | Category | Interaction Types | Drug Claim Name | Drug Name | PMIDs |
| 80381 | CD276 | CLINICALLY ACTIONABLE, EXTERNAL SIDE OF PLASMA MEMBRANE, DRUGGABLE GENOME | antibody | 340590220 | ENOBLITUZUMAB | |
| 80381 | CD276 | CLINICALLY ACTIONABLE, EXTERNAL SIDE OF PLASMA MEMBRANE, DRUGGABLE GENOME | | N/A | | |
| 80381 | CD276 | CLINICALLY ACTIONABLE, EXTERNAL SIDE OF PLASMA MEMBRANE, DRUGGABLE GENOME | | MGD009 | | |
| 80381 | CD276 | CLINICALLY ACTIONABLE, EXTERNAL SIDE OF PLASMA MEMBRANE, DRUGGABLE GENOME | | MGA271 | ENOBLITUZUMAB | 23114578 |
| 80381 | CD276 | CLINICALLY ACTIONABLE, EXTERNAL SIDE OF PLASMA MEMBRANE, DRUGGABLE GENOME | | 124I-8H9 | | |
| 80381 | CD276 | CLINICALLY ACTIONABLE, EXTERNAL SIDE OF PLASMA MEMBRANE, DRUGGABLE GENOME | | Omburtamab I-131 | | |
| 80381 | CD276 | CLINICALLY ACTIONABLE, EXTERNAL SIDE OF PLASMA MEMBRANE, DRUGGABLE GENOME | | Omburtamab I-124 | | |
| 80381 | CD276 | CLINICALLY ACTIONABLE, EXTERNAL SIDE OF PLASMA MEMBRANE, DRUGGABLE GENOME | | Enoblituzumab | ENOBLITUZUMAB | |


