
|
|||||
|
 | |
| |
| |
| |
| |
| |
|
Gene: CD274 |
Gene summary for CD274 |
| Gene information | Species | Human | Gene symbol | CD274 | Gene ID | 29126 |
| Gene name | CD274 molecule | |
| Gene Alias | B7-H | |
| Cytomap | 9p24.1 | |
| Gene Type | protein-coding | GO ID | GO:0001775 | UniProtAcc | Q0GN75 |
Top |
Malignant transformation analysis |
| Identification of the aberrant gene expression in precancerous and cancerous lesions by comparing the gene expression of stem-like cells in diseased tissues with normal stem cells |
| Entrez ID | Symbol | Replicates | Species | Organ | Tissue | Adj P-value | Log2FC | Malignancy |
| 29126 | CD274 | ATC09 | Human | Thyroid | ATC | 4.88e-11 | 5.25e-01 | 0.2871 |
| 29126 | CD274 | ATC11 | Human | Thyroid | ATC | 1.92e-05 | 5.66e-01 | 0.3386 |
| 29126 | CD274 | ATC1 | Human | Thyroid | ATC | 4.00e-11 | 5.69e-01 | 0.2878 |
| 29126 | CD274 | ATC2 | Human | Thyroid | ATC | 1.54e-04 | 3.34e-01 | 0.34 |
| 29126 | CD274 | ATC3 | Human | Thyroid | ATC | 6.28e-12 | 6.56e-01 | 0.338 |
| Page: 1 |
| Tissue | Expression Dynamics | Abbreviation |
| Thyroid | 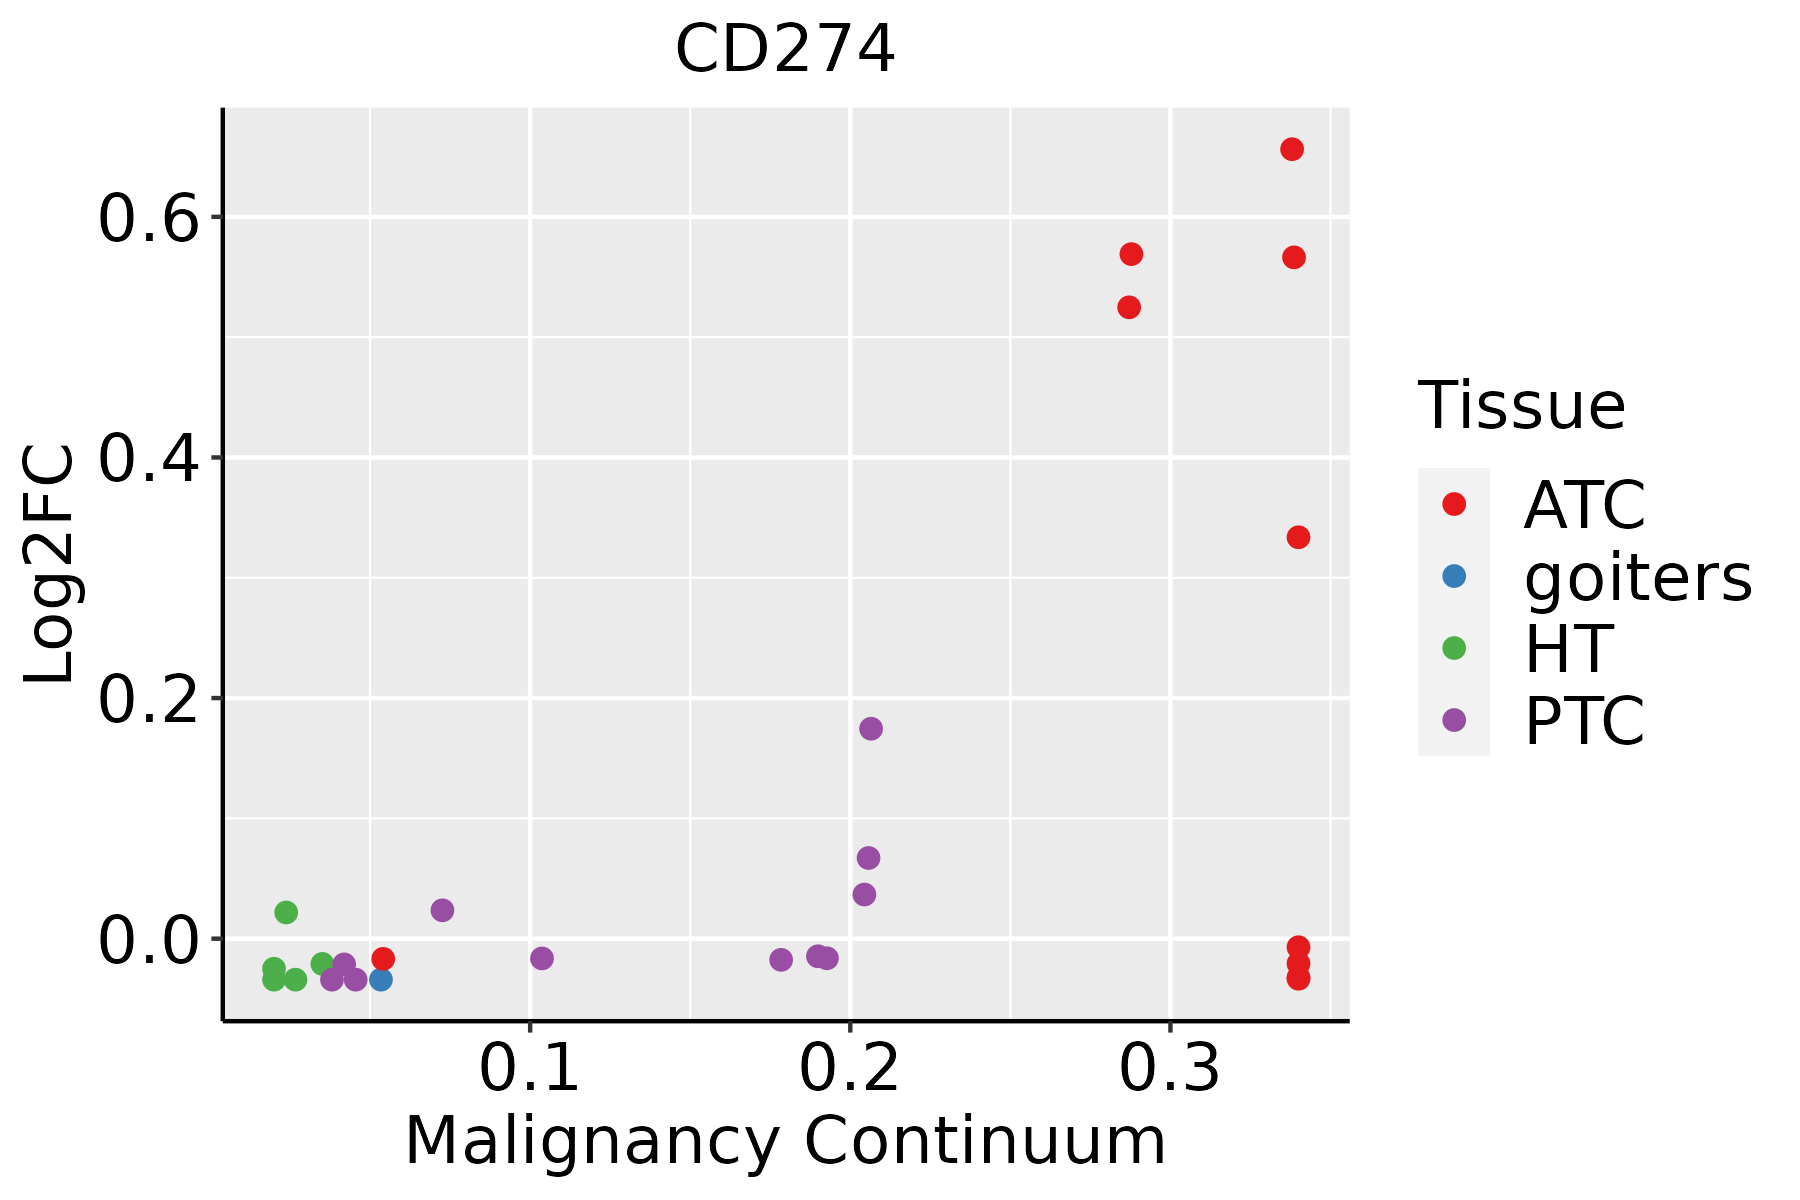 | ATC: Anaplastic thyroid cancer |
| HT: Hashimoto's thyroiditis | ||
| PTC: Papillary thyroid cancer |
| ∗log2FC in expression of this searched gene in stem-like cells from each diseased tissue sample relative to stem-like cells in normal samples in each tissue plotted against the malignancy continuum. Samples are colored based on if they are from different disease stage. |
Top |
Malignant transformation related pathway analysis |
| Find out the enriched GO biological processes and KEGG pathways involved in transition from healthy to precancer to cancer |
| Tissue | Disease Stage | Enriched GO biological Processes |
| Colorectum | AD |  |
| Colorectum | SER |  |
| Colorectum | MSS |  |
| Colorectum | MSI-H |  |
| Colorectum | FAP |  |
| ∗Top 15 enriched GO BP terms are showed in the bar plot of each disease state in each tissue. Each row represents a significant GO biological process which is colored according to the -log10(p.adjust). |
| Page: 1 2 3 4 5 6 7 8 9 |
| GO ID | Tissue | Disease Stage | Description | Gene Ratio | Bg Ratio | pvalue | p.adjust | Count |
| GO:0045785210 | Thyroid | ATC | positive regulation of cell adhesion | 194/6293 | 437/18723 | 1.40e-06 | 1.75e-05 | 194 |
| GO:000283123 | Thyroid | ATC | regulation of response to biotic stimulus | 144/6293 | 327/18723 | 4.94e-05 | 3.91e-04 | 144 |
| GO:190199813 | Thyroid | ATC | toxin transport | 25/6293 | 40/18723 | 1.72e-04 | 1.17e-03 | 25 |
| GO:007188711 | Thyroid | ATC | leukocyte apoptotic process | 53/6293 | 106/18723 | 3.48e-04 | 2.16e-03 | 53 |
| GO:000181924 | Thyroid | ATC | positive regulation of cytokine production | 189/6293 | 467/18723 | 1.00e-03 | 5.31e-03 | 189 |
| GO:000716225 | Thyroid | ATC | negative regulation of cell adhesion | 127/6293 | 303/18723 | 1.45e-03 | 7.47e-03 | 127 |
| GO:20001062 | Thyroid | ATC | regulation of leukocyte apoptotic process | 39/6293 | 81/18723 | 4.65e-03 | 1.92e-02 | 39 |
| GO:00702272 | Thyroid | ATC | lymphocyte apoptotic process | 35/6293 | 72/18723 | 5.89e-03 | 2.37e-02 | 35 |
| GO:00702311 | Thyroid | ATC | T cell apoptotic process | 25/6293 | 50/18723 | 1.20e-02 | 4.27e-02 | 25 |
| Page: 1 |
| Pathway ID | Tissue | Disease Stage | Description | Gene Ratio | Bg Ratio | pvalue | p.adjust | qvalue | Count |
| Page: 1 |
Top |
Cell-cell communication analysis |
| Identification of potential cell-cell interactions between two cell types and their ligand-receptor pairs for different disease states |
| Ligand | Receptor | LRpair | Pathway | Tissue | Disease Stage |
| CD274 | PDCD1 | CD274_PDCD1 | PD-L1 | Cervix | CC |
| CD80 | CD274 | CD80_CD274 | CD80 | GC | ADJ |
| CD274 | PDCD1 | CD274_PDCD1 | PD-L1 | GC | ADJ |
| CD80 | CD274 | CD80_CD274 | CD80 | GC | GC |
| CD80 | CD274 | CD80_CD274 | CD80 | Skin | AK |
| CD80 | CD274 | CD80_CD274 | CD80 | Skin | cSCC |
| Page: 1 |
Top |
Single-cell gene regulatory network inference analysis |
| Find out the significant the regulons (TFs) and the target genes of each regulon across cell types for different disease states |
| TF | Cell Type | Tissue | Disease Stage | Target Gene | RSS | Regulon Activity |
| ∗The dot plots of a searched regulon are shown for all cell subpopulations in each disease state of each tissue based on the regulon specific score inferred using pySCENIC and by calculating the average expression. |
| Page: 1 |
Top |
Somatic mutation of malignant transformation related genes |
| Annotation of somatic variants for genes involved in malignant transformation |
| Hugo Symbol | Variant Class | Variant Classification | dbSNP RS | HGVSc | HGVSp | HGVSp Short | SWISSPROT | BIOTYPE | SIFT | PolyPhen | Tumor Sample Barcode | Tissue | Histology | Sex | Age | Stage | Therapy Types | Drugs | Outcome |
| CD274 | SNV | Missense_Mutation | rs373692552 | c.91N>C | p.Glu31Gln | p.E31Q | Q9NZQ7 | protein_coding | deleterious(0.01) | benign(0.422) | TCGA-AC-A23H-01 | Breast | breast invasive carcinoma | Female | >=65 | I/II | Unknown | Unknown | PD |
| CD274 | SNV | Missense_Mutation | novel | c.593N>T | p.Arg198Ile | p.R198I | Q9NZQ7 | protein_coding | tolerated(0.07) | benign(0.387) | TCGA-AN-A046-01 | Breast | breast invasive carcinoma | Female | >=65 | I/II | Unknown | Unknown | SD |
| CD274 | SNV | Missense_Mutation | rs752493356 | c.826N>C | p.Asp276His | p.D276H | Q9NZQ7 | protein_coding | deleterious(0.01) | benign(0.219) | TCGA-AR-A0TX-01 | Breast | breast invasive carcinoma | Female | <65 | I/II | Unknown | Unknown | SD |
| CD274 | insertion | In_Frame_Ins | novel | c.221_222insTACAACCAGGGA | p.Leu74_Lys75insThrThrArgGlu | p.L74_K75insTTRE | Q9NZQ7 | protein_coding | TCGA-AR-A0TU-01 | Breast | breast invasive carcinoma | Female | <65 | I/II | Unspecific | Doxorubicin | SD | ||
| CD274 | deletion | Frame_Shift_Del | novel | c.555delG | p.Arg186GlufsTer8 | p.R186Efs*8 | Q9NZQ7 | protein_coding | TCGA-EW-A2FV-01 | Breast | breast invasive carcinoma | Female | <65 | III/IV | Chemotherapy | docetaxel | SD | ||
| CD274 | SNV | Missense_Mutation | novel | c.501G>C | p.Trp167Cys | p.W167C | Q9NZQ7 | protein_coding | deleterious(0) | probably_damaging(1) | TCGA-EA-A3QD-01 | Cervix | cervical & endocervical cancer | Female | <65 | III/IV | Chemotherapy | cisplatin | CR |
| CD274 | insertion | Frame_Shift_Ins | novel | c.570_571insGGATTAATAGGAA | p.Phe191GlyfsTer18 | p.F191Gfs*18 | Q9NZQ7 | protein_coding | TCGA-HG-A2PA-01 | Cervix | cervical & endocervical cancer | Female | <65 | I/II | Unspecific | Taxol | PD | ||
| CD274 | SNV | Missense_Mutation | c.826N>T | p.Asp276Tyr | p.D276Y | Q9NZQ7 | protein_coding | deleterious(0) | benign(0.172) | TCGA-AG-A002-01 | Colorectum | rectum adenocarcinoma | Male | <65 | I/II | Unknown | Unknown | SD | |
| CD274 | insertion | Frame_Shift_Ins | novel | c.810_811insCATTTGT | p.Lys271HisfsTer3 | p.K271Hfs*3 | Q9NZQ7 | protein_coding | TCGA-AM-5820-01 | Colorectum | colon adenocarcinoma | Female | <65 | I/II | Unknown | Unknown | SD | ||
| CD274 | SNV | Missense_Mutation | novel | c.163N>A | p.Val55Ile | p.V55I | Q9NZQ7 | protein_coding | tolerated(0.07) | possibly_damaging(0.892) | TCGA-A5-A0G2-01 | Endometrium | uterine corpus endometrioid carcinoma | Female | <65 | III/IV | Unknown | Unknown | SD |
| Page: 1 2 3 |
Top |
Related drugs of malignant transformation related genes |
| Identification of chemicals and drugs interact with genes involved in malignant transfromation |
| (DGIdb 4.0) |
| Entrez ID | Symbol | Category | Interaction Types | Drug Claim Name | Drug Name | PMIDs |
| 29126 | CD274 | CLINICALLY ACTIONABLE, DRUGGABLE GENOME, EXTERNAL SIDE OF PLASMA MEMBRANE, DRUG RESISTANCE | Nivolumab | NIVOLUMAB | ||
| 29126 | CD274 | CLINICALLY ACTIONABLE, DRUGGABLE GENOME, EXTERNAL SIDE OF PLASMA MEMBRANE, DRUG RESISTANCE | Atezolizumab | ATEZOLIZUMAB | ||
| 29126 | CD274 | CLINICALLY ACTIONABLE, DRUGGABLE GENOME, EXTERNAL SIDE OF PLASMA MEMBRANE, DRUG RESISTANCE | PMID30107136-Compound-Example2 | |||
| 29126 | CD274 | CLINICALLY ACTIONABLE, DRUGGABLE GENOME, EXTERNAL SIDE OF PLASMA MEMBRANE, DRUG RESISTANCE | LY3300054 | LODAPOLIMAB | ||
| 29126 | CD274 | CLINICALLY ACTIONABLE, DRUGGABLE GENOME, EXTERNAL SIDE OF PLASMA MEMBRANE, DRUG RESISTANCE | antibody | ATEZOLIZUMAB | ATEZOLIZUMAB | |
| 29126 | CD274 | CLINICALLY ACTIONABLE, DRUGGABLE GENOME, EXTERNAL SIDE OF PLASMA MEMBRANE, DRUG RESISTANCE | MSB2311 | |||
| 29126 | CD274 | CLINICALLY ACTIONABLE, DRUGGABLE GENOME, EXTERNAL SIDE OF PLASMA MEMBRANE, DRUG RESISTANCE | inhibitor | CHEMBL3301587 | DURVALUMAB | |
| 29126 | CD274 | CLINICALLY ACTIONABLE, DRUGGABLE GENOME, EXTERNAL SIDE OF PLASMA MEMBRANE, DRUG RESISTANCE | Avelumab | AVELUMAB | ||
| 29126 | CD274 | CLINICALLY ACTIONABLE, DRUGGABLE GENOME, EXTERNAL SIDE OF PLASMA MEMBRANE, DRUG RESISTANCE | antibody | MDX-1105 | BMS-936559 | |
| 29126 | CD274 | CLINICALLY ACTIONABLE, DRUGGABLE GENOME, EXTERNAL SIDE OF PLASMA MEMBRANE, DRUG RESISTANCE | CHEMBL3833373 | AVELUMAB |
| Page: 1 2 3 4 5 |

Copyright 2023-Present -The University of Texas Health Science Center at Houston |