
|
|||||
|
 | |
| |
| |
| |
| |
| |
|
Gene: CD27 |
Gene summary for CD27 |
| Gene information | Species | Human | Gene symbol | CD27 | Gene ID | 939 |
| Gene name | CD27 molecule | |
| Gene Alias | S152 | |
| Cytomap | 12p13.31 | |
| Gene Type | protein-coding | GO ID | GO:0000165 | UniProtAcc | P26842 |
Top |
Malignant transformation analysis |
| Identification of the aberrant gene expression in precancerous and cancerous lesions by comparing the gene expression of stem-like cells in diseased tissues with normal stem cells |
| Entrez ID | Symbol | Replicates | Species | Organ | Tissue | Adj P-value | Log2FC | Malignancy |
| 939 | CD27 | C21 | Human | Oral cavity | OSCC | 1.40e-14 | 4.17e-01 | 0.2678 |
| 939 | CD27 | C38 | Human | Oral cavity | OSCC | 1.52e-05 | 6.54e-01 | 0.172 |
| 939 | CD27 | C46 | Human | Oral cavity | OSCC | 2.06e-05 | 1.41e-01 | 0.1673 |
| 939 | CD27 | C57 | Human | Oral cavity | OSCC | 9.78e-08 | 2.50e-01 | 0.1679 |
| 939 | CD27 | C06 | Human | Oral cavity | OSCC | 1.27e-02 | 6.17e-01 | 0.2699 |
| 939 | CD27 | C09 | Human | Oral cavity | OSCC | 2.29e-02 | 1.06e-01 | 0.1431 |
| 939 | CD27 | LN22 | Human | Oral cavity | OSCC | 2.85e-06 | 4.91e-01 | 0.1733 |
| Page: 1 |
| Tissue | Expression Dynamics | Abbreviation |
| Oral Cavity | 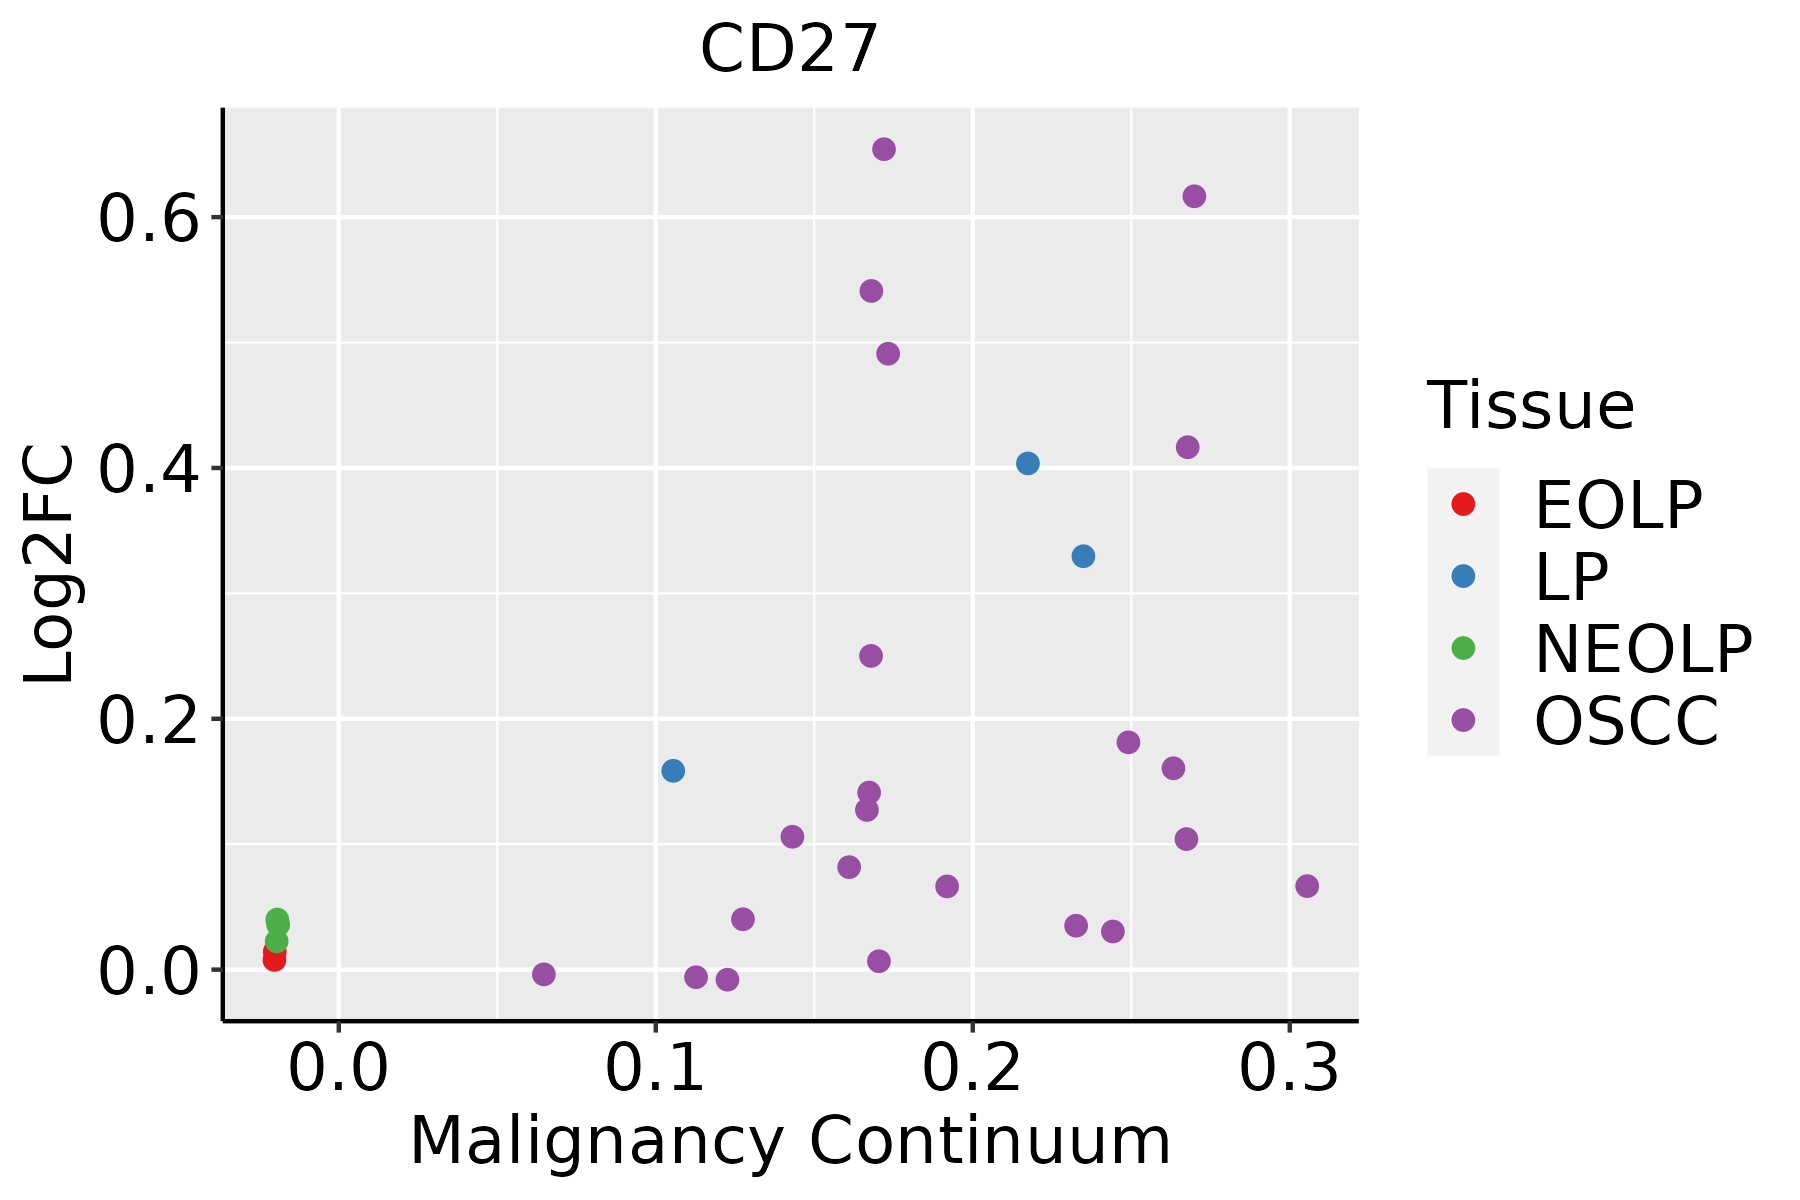 | EOLP: Erosive Oral lichen planus |
| LP: leukoplakia | ||
| NEOLP: Non-erosive oral lichen planus | ||
| OSCC: Oral squamous cell carcinoma |
| ∗log2FC in expression of this searched gene in stem-like cells from each diseased tissue sample relative to stem-like cells in normal samples in each tissue plotted against the malignancy continuum. Samples are colored based on if they are from different disease stage. |
Top |
Malignant transformation related pathway analysis |
| Find out the enriched GO biological processes and KEGG pathways involved in transition from healthy to precancer to cancer |
| Tissue | Disease Stage | Enriched GO biological Processes |
| Colorectum | AD |  |
| Colorectum | SER |  |
| Colorectum | MSS |  |
| Colorectum | MSI-H |  |
| Colorectum | FAP |  |
| ∗Top 15 enriched GO BP terms are showed in the bar plot of each disease state in each tissue. Each row represents a significant GO biological process which is colored according to the -log10(p.adjust). |
| Page: 1 2 3 4 5 6 7 8 9 |
| GO ID | Tissue | Disease Stage | Description | Gene Ratio | Bg Ratio | pvalue | p.adjust | Count |
| GO:004578527 | Esophagus | ESCC | positive regulation of cell adhesion | 255/8552 | 437/18723 | 5.07e-08 | 9.11e-07 | 255 |
| GO:002240720 | Esophagus | ESCC | regulation of cell-cell adhesion | 239/8552 | 448/18723 | 5.88e-04 | 3.19e-03 | 239 |
| GO:004211018 | Esophagus | ESCC | T cell activation | 256/8552 | 487/18723 | 1.18e-03 | 5.87e-03 | 256 |
| GO:002240919 | Esophagus | ESCC | positive regulation of cell-cell adhesion | 155/8552 | 284/18723 | 1.50e-03 | 7.06e-03 | 155 |
| GO:00508528 | Esophagus | ESCC | T cell receptor signaling pathway | 73/8552 | 123/18723 | 1.54e-03 | 7.24e-03 | 73 |
| GO:000181916 | Esophagus | ESCC | positive regulation of cytokine production | 244/8552 | 467/18723 | 2.29e-03 | 1.01e-02 | 244 |
| GO:005087015 | Esophagus | ESCC | positive regulation of T cell activation | 117/8552 | 216/18723 | 7.23e-03 | 2.62e-02 | 117 |
| GO:190303916 | Esophagus | ESCC | positive regulation of leukocyte cell-cell adhesion | 128/8552 | 239/18723 | 8.40e-03 | 2.96e-02 | 128 |
| GO:000715918 | Esophagus | ESCC | leukocyte cell-cell adhesion | 192/8552 | 371/18723 | 1.03e-02 | 3.51e-02 | 192 |
| GO:190303717 | Esophagus | ESCC | regulation of leukocyte cell-cell adhesion | 174/8552 | 336/18723 | 1.36e-02 | 4.43e-02 | 174 |
| GO:004578512 | Liver | HCC | positive regulation of cell adhesion | 215/7958 | 437/18723 | 2.53e-03 | 1.22e-02 | 215 |
| GO:200011620 | Oral cavity | OSCC | regulation of cysteine-type endopeptidase activity | 152/7305 | 235/18723 | 1.14e-15 | 8.13e-14 | 152 |
| GO:004328120 | Oral cavity | OSCC | regulation of cysteine-type endopeptidase activity involved in apoptotic process | 137/7305 | 209/18723 | 5.94e-15 | 3.80e-13 | 137 |
| GO:009719120 | Oral cavity | OSCC | extrinsic apoptotic signaling pathway | 142/7305 | 219/18723 | 7.34e-15 | 4.55e-13 | 142 |
| GO:005254720 | Oral cavity | OSCC | regulation of peptidase activity | 255/7305 | 461/18723 | 5.78e-13 | 2.75e-11 | 255 |
| GO:200011718 | Oral cavity | OSCC | negative regulation of cysteine-type endopeptidase activity | 64/7305 | 86/18723 | 2.53e-11 | 8.44e-10 | 64 |
| GO:005254820 | Oral cavity | OSCC | regulation of endopeptidase activity | 235/7305 | 432/18723 | 4.35e-11 | 1.40e-09 | 235 |
| GO:004315417 | Oral cavity | OSCC | negative regulation of cysteine-type endopeptidase activity involved in apoptotic process | 59/7305 | 78/18723 | 4.86e-11 | 1.53e-09 | 59 |
| GO:003109816 | Oral cavity | OSCC | stress-activated protein kinase signaling cascade | 141/7305 | 247/18723 | 5.74e-09 | 1.25e-07 | 141 |
| GO:005140316 | Oral cavity | OSCC | stress-activated MAPK cascade | 134/7305 | 239/18723 | 6.02e-08 | 1.09e-06 | 134 |
| Page: 1 2 3 4 |
| Pathway ID | Tissue | Disease Stage | Description | Gene Ratio | Bg Ratio | pvalue | p.adjust | qvalue | Count |
| Page: 1 |
Top |
Cell-cell communication analysis |
| Identification of potential cell-cell interactions between two cell types and their ligand-receptor pairs for different disease states |
| Ligand | Receptor | LRpair | Pathway | Tissue | Disease Stage |
| CD70 | CD27 | CD70_CD27 | CD70 | Breast | ADJ |
| CD70 | CD27 | CD70_CD27 | CD70 | Cervix | ADJ |
| CD70 | CD27 | CD70_CD27 | CD70 | Endometrium | ADJ |
| CD70 | CD27 | CD70_CD27 | CD70 | Endometrium | AEH |
| CD70 | CD27 | CD70_CD27 | CD70 | Endometrium | EEC |
| CD70 | CD27 | CD70_CD27 | CD70 | Esophagus | ESCC |
| CD80 | CD274 | CD80_CD274 | CD80 | GC | ADJ |
| CD80 | CD274 | CD80_CD274 | CD80 | GC | GC |
| CD70 | CD27 | CD70_CD27 | CD70 | GC | GC |
| CD70 | CD27 | CD70_CD27 | CD70 | HNSCC | OSCC |
| CD70 | CD27 | CD70_CD27 | CD70 | HNSCC | Precancer |
| CD70 | CD27 | CD70_CD27 | CD70 | Liver | Precancer |
| CD70 | CD27 | CD70_CD27 | CD70 | Lung | AIS |
| CD70 | CD27 | CD70_CD27 | CD70 | Lung | MIAC |
| CD70 | CD27 | CD70_CD27 | CD70 | Lung | Precancer |
| CD70 | CD27 | CD70_CD27 | CD70 | Prostate | BPH |
| CD70 | CD27 | CD70_CD27 | CD70 | Skin | ADJ |
| CD80 | CD274 | CD80_CD274 | CD80 | Skin | AK |
| CD80 | CD274 | CD80_CD274 | CD80 | Skin | cSCC |
| CD70 | CD27 | CD70_CD27 | CD70 | Skin | SCCIS |
| Page: 1 |
Top |
Single-cell gene regulatory network inference analysis |
| Find out the significant the regulons (TFs) and the target genes of each regulon across cell types for different disease states |
| TF | Cell Type | Tissue | Disease Stage | Target Gene | RSS | Regulon Activity |
| ∗The dot plots of a searched regulon are shown for all cell subpopulations in each disease state of each tissue based on the regulon specific score inferred using pySCENIC and by calculating the average expression. |
| Page: 1 |
Top |
Somatic mutation of malignant transformation related genes |
| Annotation of somatic variants for genes involved in malignant transformation |
| Hugo Symbol | Variant Class | Variant Classification | dbSNP RS | HGVSc | HGVSp | HGVSp Short | SWISSPROT | BIOTYPE | SIFT | PolyPhen | Tumor Sample Barcode | Tissue | Histology | Sex | Age | Stage | Therapy Types | Drugs | Outcome |
| CD27 | SNV | Missense_Mutation | c.247N>G | p.Ser83Gly | p.S83G | P26842 | protein_coding | deleterious(0.01) | probably_damaging(0.994) | TCGA-BH-A1F6-01 | Breast | breast invasive carcinoma | Female | <65 | III/IV | Unknown | Unknown | SD | |
| CD27 | SNV | Missense_Mutation | rs145433356 | c.233G>A | p.Arg78Gln | p.R78Q | P26842 | protein_coding | tolerated(0.17) | benign(0.106) | TCGA-C5-A3HE-01 | Cervix | cervical & endocervical cancer | Female | <65 | I/II | Unknown | Unknown | PD |
| CD27 | SNV | Missense_Mutation | c.307N>C | p.Glu103Gln | p.E103Q | P26842 | protein_coding | tolerated(0.19) | benign(0.031) | TCGA-Q1-A5R2-01 | Cervix | cervical & endocervical cancer | Female | <65 | I/II | Chemotherapy | cisplatin | PR | |
| CD27 | SNV | Missense_Mutation | rs763617266 | c.148N>A | p.Val50Met | p.V50M | P26842 | protein_coding | tolerated(0.17) | probably_damaging(0.938) | TCGA-A6-5665-01 | Colorectum | colon adenocarcinoma | Female | >=65 | I/II | Unknown | Unknown | PD |
| CD27 | SNV | Missense_Mutation | rs144240256 | c.685G>A | p.Ala229Thr | p.A229T | P26842 | protein_coding | tolerated(0.25) | benign(0.037) | TCGA-AA-3672-01 | Colorectum | colon adenocarcinoma | Female | >=65 | III/IV | Unknown | Unknown | SD |
| CD27 | SNV | Missense_Mutation | c.509C>A | p.Pro170His | p.P170H | P26842 | protein_coding | deleterious(0) | possibly_damaging(0.907) | TCGA-AA-3710-01 | Colorectum | colon adenocarcinoma | Female | >=65 | I/II | Unknown | Unknown | SD | |
| CD27 | SNV | Missense_Mutation | novel | c.5C>T | p.Ala2Val | p.A2V | P26842 | protein_coding | deleterious(0.05) | benign(0.021) | TCGA-CK-4951-01 | Colorectum | colon adenocarcinoma | Female | >=65 | I/II | Unknown | Unknown | PD |
| CD27 | deletion | Frame_Shift_Del | c.518_521delNNNN | p.Ser175ProfsTer19 | p.S175Pfs*19 | P26842 | protein_coding | TCGA-A6-2686-01 | Colorectum | colon adenocarcinoma | Female | >=65 | I/II | Unknown | Unknown | SD | |||
| CD27 | SNV | Missense_Mutation | novel | c.450G>T | p.Glu150Asp | p.E150D | P26842 | protein_coding | tolerated(0.44) | benign(0) | TCGA-A5-A0G2-01 | Endometrium | uterine corpus endometrioid carcinoma | Female | <65 | III/IV | Unknown | Unknown | SD |
| CD27 | SNV | Missense_Mutation | c.355G>A | p.Glu119Lys | p.E119K | P26842 | protein_coding | tolerated(0.13) | possibly_damaging(0.484) | TCGA-AP-A056-01 | Endometrium | uterine corpus endometrioid carcinoma | Female | <65 | I/II | Unknown | Unknown | SD |
| Page: 1 2 3 |
Top |
Related drugs of malignant transformation related genes |
| Identification of chemicals and drugs interact with genes involved in malignant transfromation |
| (DGIdb 4.0) |
| Entrez ID | Symbol | Category | Interaction Types | Drug Claim Name | Drug Name | PMIDs |
| 939 | CD27 | PROTEASE INHIBITOR, EXTERNAL SIDE OF PLASMA MEMBRANE, DRUGGABLE GENOME | 178101772 | |||
| 939 | CD27 | PROTEASE INHIBITOR, EXTERNAL SIDE OF PLASMA MEMBRANE, DRUGGABLE GENOME | N/A | |||
| 939 | CD27 | PROTEASE INHIBITOR, EXTERNAL SIDE OF PLASMA MEMBRANE, DRUGGABLE GENOME | CDX-1127 | VARLILUMAB | ||
| 939 | CD27 | PROTEASE INHIBITOR, EXTERNAL SIDE OF PLASMA MEMBRANE, DRUGGABLE GENOME | PROTEASE INHIBITORS | 17309824 | ||
| 939 | CD27 | PROTEASE INHIBITOR, EXTERNAL SIDE OF PLASMA MEMBRANE, DRUGGABLE GENOME | Varlilumab | VARLILUMAB |
| Page: 1 |

Copyright 2023-Present -The University of Texas Health Science Center at Houston |