
|
|||||
|
 | |
| |
| |
| |
| |
| |
|
Gene: CD164 |
Gene summary for CD164 |
| Gene information | Species | Human | Gene symbol | CD164 | Gene ID | 8763 |
| Gene name | CD164 molecule | |
| Gene Alias | DFNA66 | |
| Cytomap | 6q21 | |
| Gene Type | protein-coding | GO ID | GO:0002376 | UniProtAcc | Q04900 |
Top |
Malignant transformation analysis |
| Identification of the aberrant gene expression in precancerous and cancerous lesions by comparing the gene expression of stem-like cells in diseased tissues with normal stem cells |
| Entrez ID | Symbol | Replicates | Species | Organ | Tissue | Adj P-value | Log2FC | Malignancy |
| 8763 | CD164 | GSM4909280 | Human | Breast | Precancer | 8.93e-03 | -5.76e-01 | 0.0305 |
| 8763 | CD164 | GSM4909286 | Human | Breast | IDC | 2.79e-10 | -2.95e-01 | 0.1081 |
| 8763 | CD164 | GSM4909289 | Human | Breast | IDC | 2.26e-20 | 8.15e-01 | 0.1064 |
| 8763 | CD164 | GSM4909293 | Human | Breast | IDC | 4.92e-03 | 2.97e-01 | 0.1581 |
| 8763 | CD164 | GSM4909294 | Human | Breast | IDC | 4.18e-10 | -1.55e-01 | 0.2022 |
| 8763 | CD164 | GSM4909296 | Human | Breast | IDC | 7.15e-24 | -5.20e-01 | 0.1524 |
| 8763 | CD164 | GSM4909297 | Human | Breast | IDC | 3.44e-28 | 3.06e-02 | 0.1517 |
| 8763 | CD164 | GSM4909309 | Human | Breast | IDC | 1.60e-09 | -4.14e-01 | 0.0483 |
| 8763 | CD164 | GSM4909311 | Human | Breast | IDC | 4.94e-45 | -4.59e-01 | 0.1534 |
| 8763 | CD164 | GSM4909312 | Human | Breast | IDC | 6.83e-22 | 2.60e-01 | 0.1552 |
| 8763 | CD164 | GSM4909313 | Human | Breast | IDC | 8.07e-10 | 2.15e-01 | 0.0391 |
| 8763 | CD164 | GSM4909316 | Human | Breast | IDC | 1.05e-02 | -4.29e-01 | 0.21 |
| 8763 | CD164 | GSM4909319 | Human | Breast | IDC | 9.40e-55 | -6.84e-01 | 0.1563 |
| 8763 | CD164 | GSM4909320 | Human | Breast | IDC | 1.07e-14 | -6.71e-01 | 0.1575 |
| 8763 | CD164 | GSM4909321 | Human | Breast | IDC | 7.55e-35 | -5.58e-01 | 0.1559 |
| 8763 | CD164 | NCCBC14 | Human | Breast | DCIS | 1.40e-15 | -1.09e-01 | 0.2021 |
| 8763 | CD164 | NCCBC2 | Human | Breast | DCIS | 1.67e-02 | -2.72e-01 | 0.1554 |
| 8763 | CD164 | NCCBC3 | Human | Breast | DCIS | 1.55e-04 | -1.11e-01 | 0.1198 |
| 8763 | CD164 | NCCBC5 | Human | Breast | DCIS | 6.73e-19 | -3.91e-01 | 0.2046 |
| 8763 | CD164 | P1 | Human | Breast | IDC | 7.01e-24 | -2.91e-01 | 0.1527 |
| Page: 1 2 3 4 5 6 7 8 9 10 11 |
| Tissue | Expression Dynamics | Abbreviation |
| Breast | 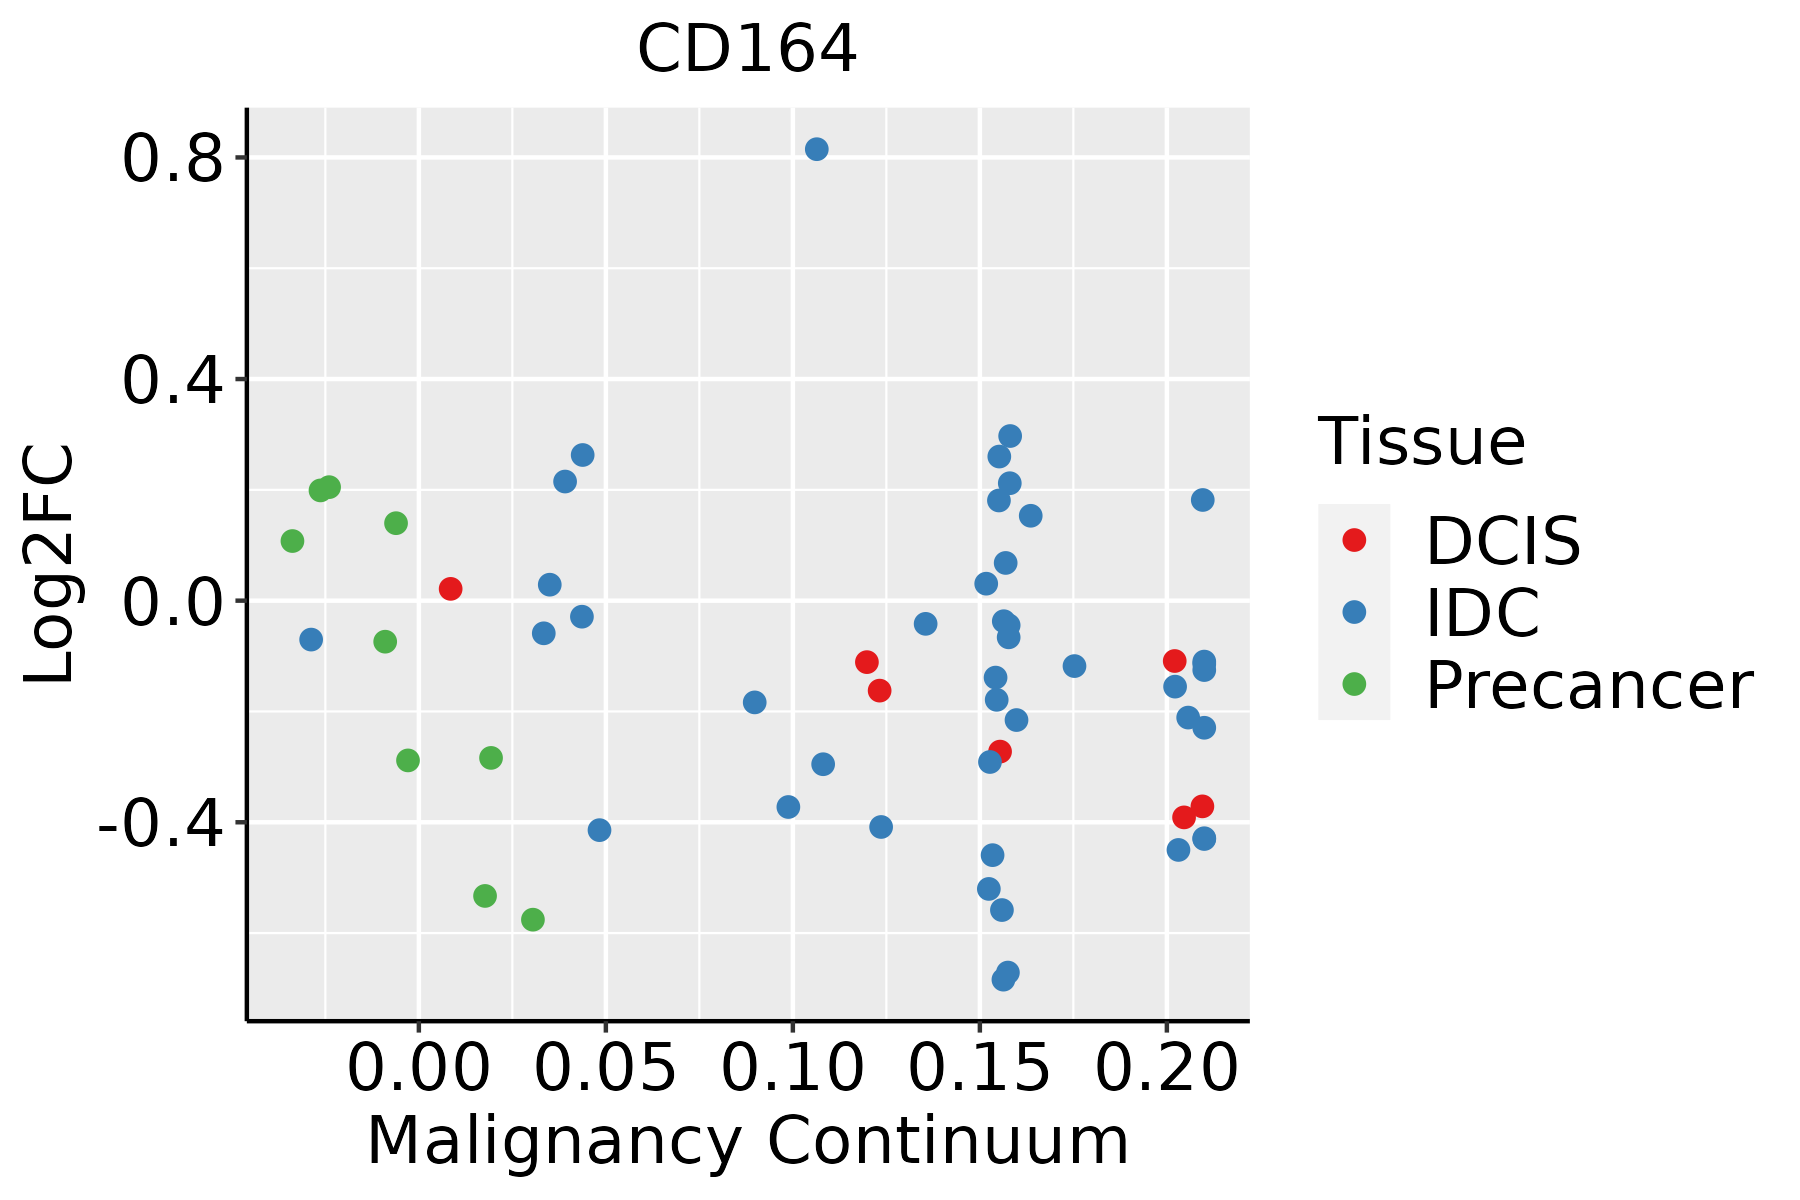 | IDC: Invasive ductal carcinoma |
| DCIS: Ductal carcinoma in situ | ||
| Precancer(BRCA1-mut): Precancerous lesion from BRCA1 mutation carriers | ||
| Colorectum (GSE201348) |  | FAP: Familial adenomatous polyposis |
| CRC: Colorectal cancer | ||
| Colorectum (HTA11) |  | AD: Adenomas |
| SER: Sessile serrated lesions | ||
| MSI-H: Microsatellite-high colorectal cancer | ||
| MSS: Microsatellite stable colorectal cancer | ||
| Endometrium |  | AEH: Atypical endometrial hyperplasia |
| EEC: Endometrioid Cancer | ||
| Esophagus | 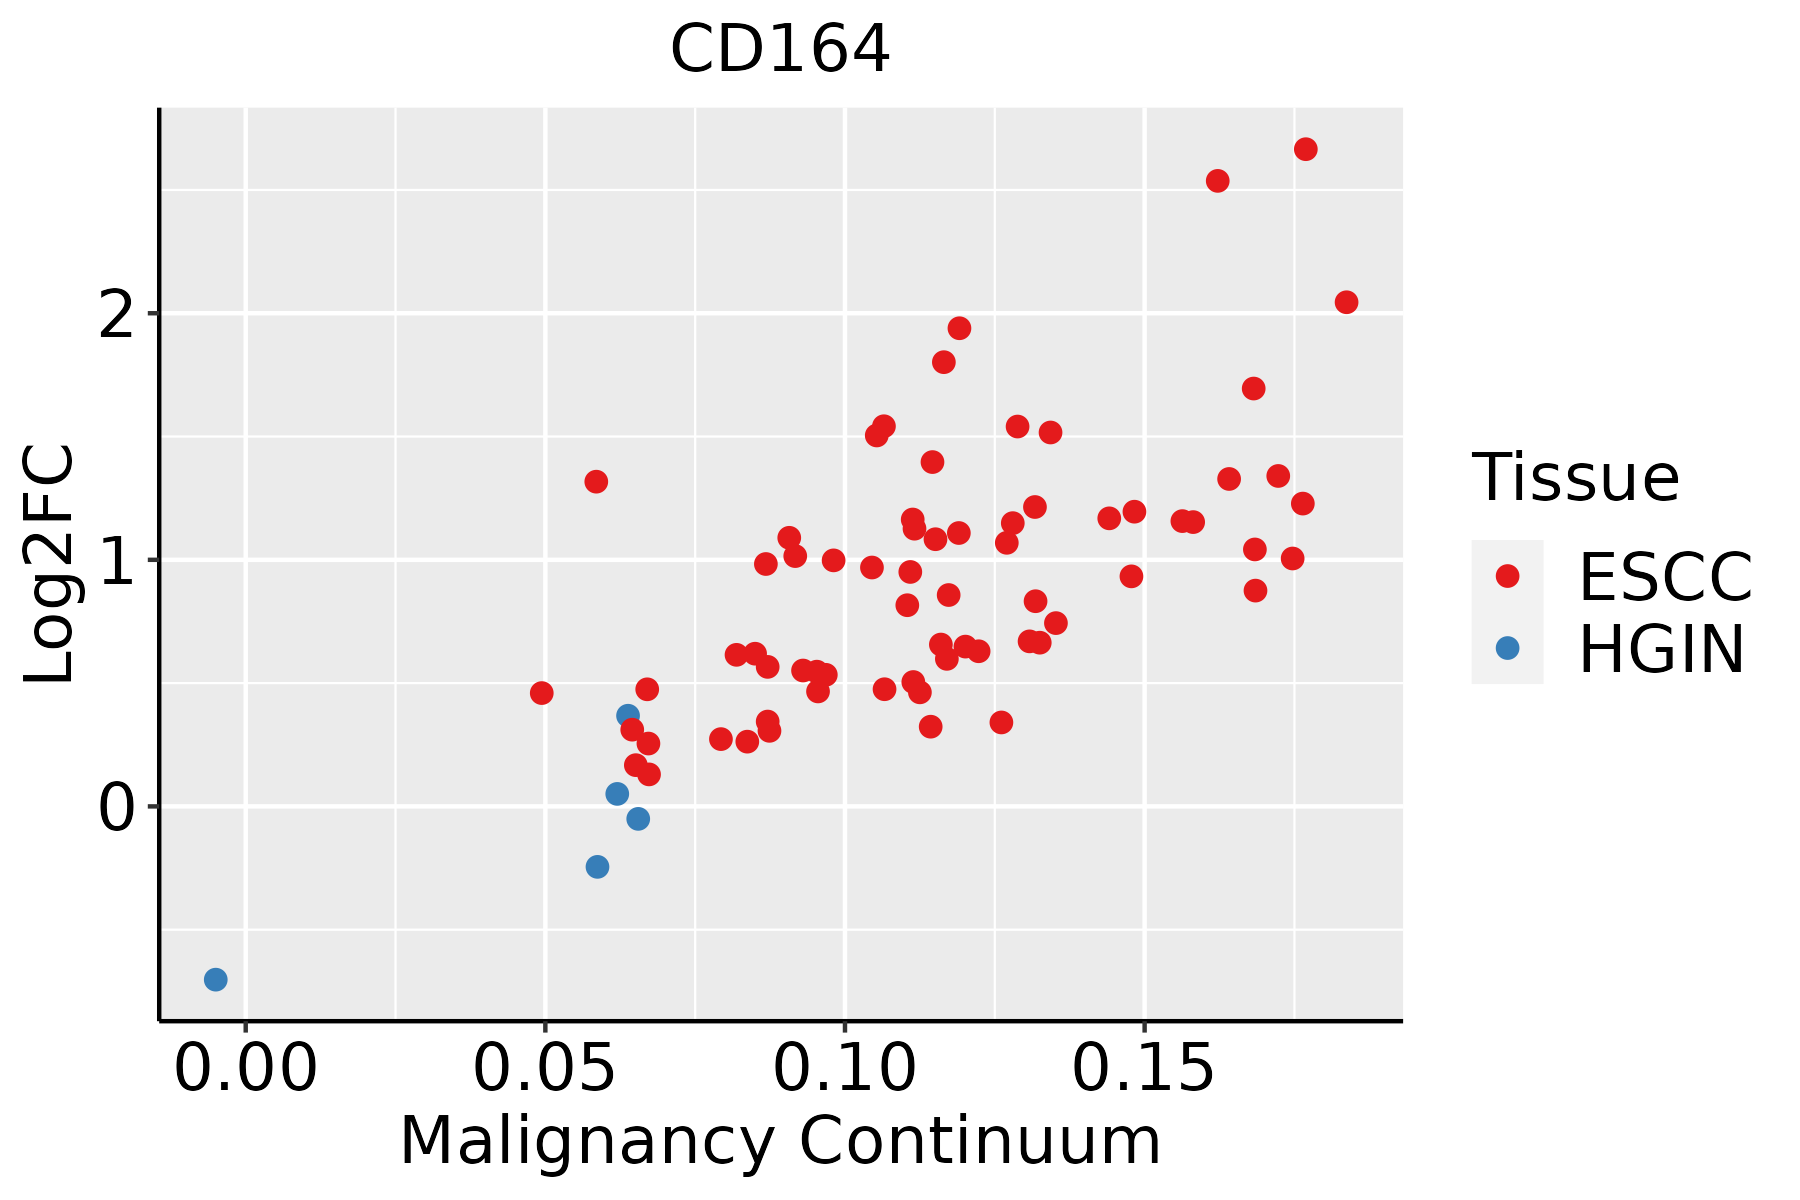 | ESCC: Esophageal squamous cell carcinoma |
| HGIN: High-grade intraepithelial neoplasias | ||
| LGIN: Low-grade intraepithelial neoplasias | ||
| Liver | 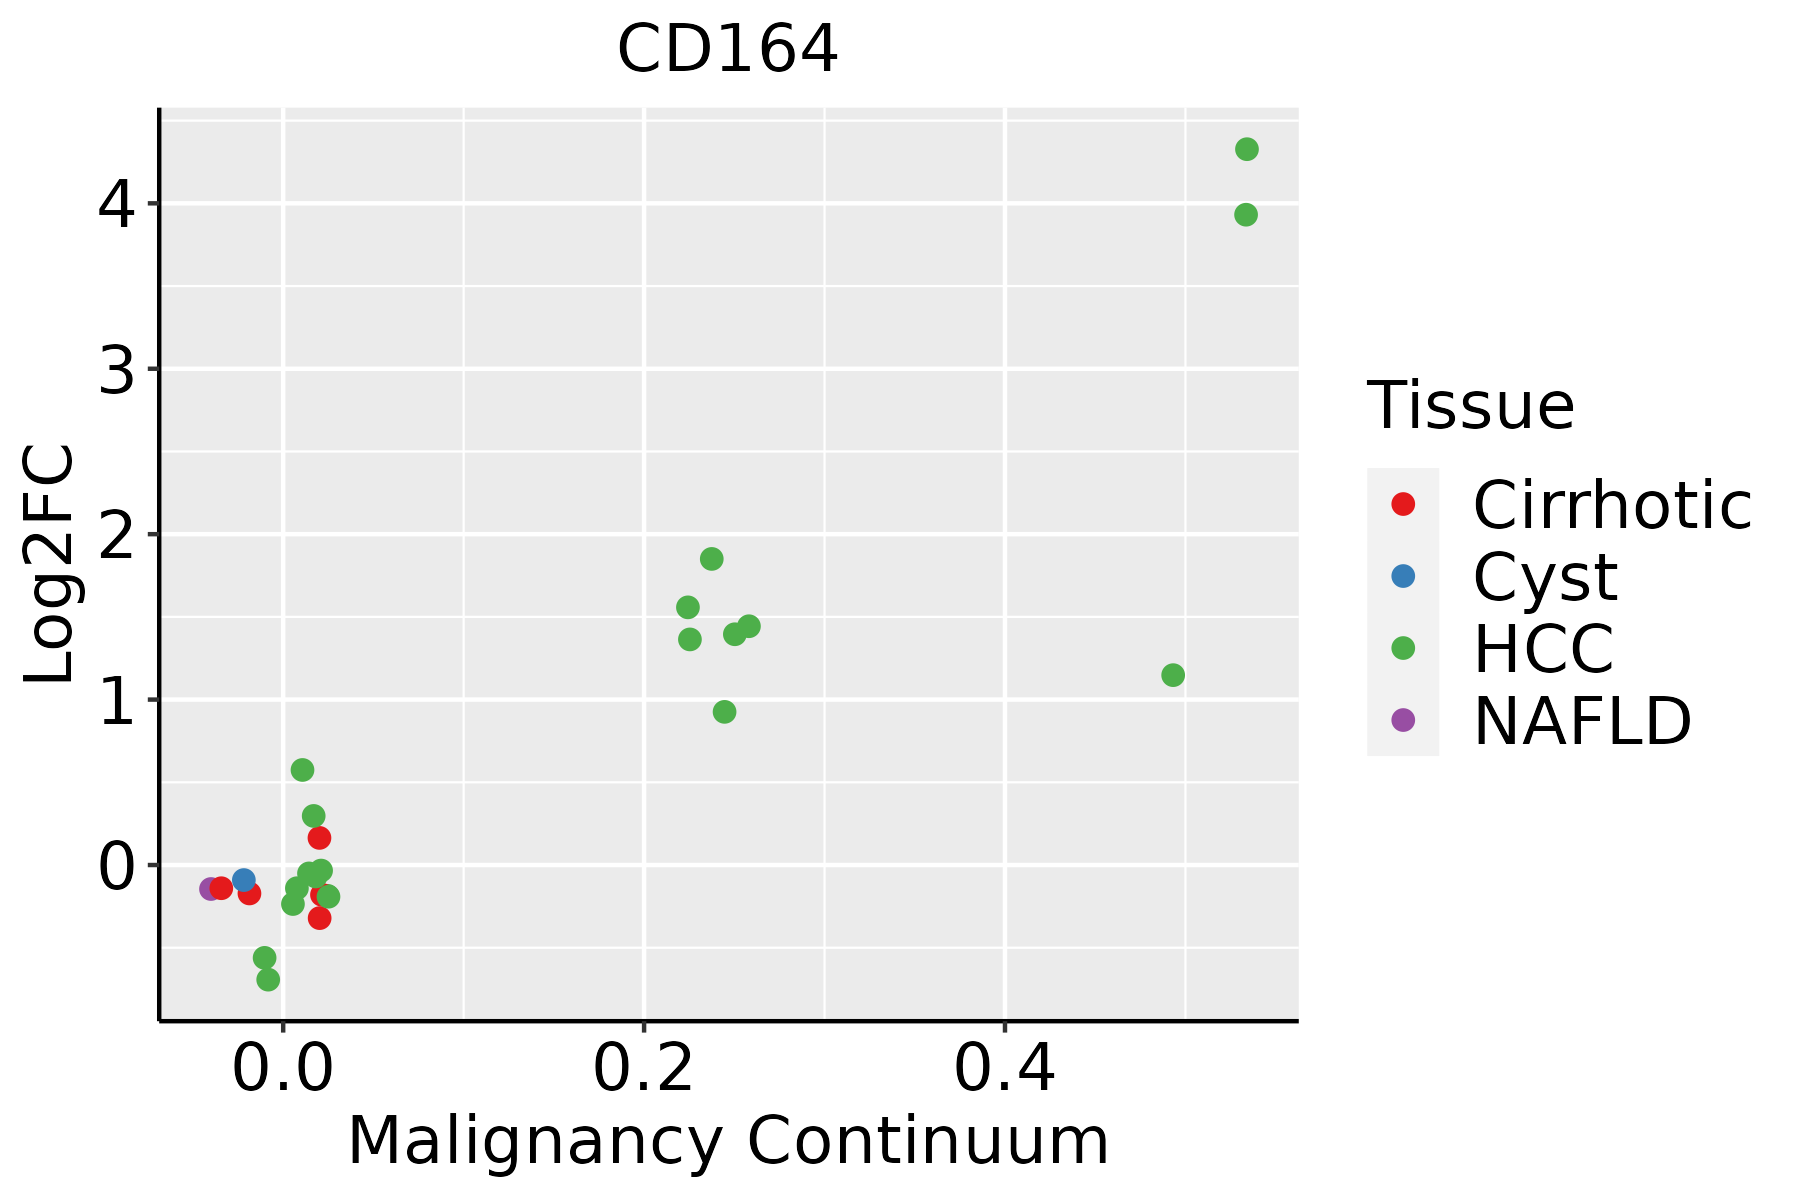 | HCC: Hepatocellular carcinoma |
| NAFLD: Non-alcoholic fatty liver disease | ||
| Oral Cavity |  | EOLP: Erosive Oral lichen planus |
| LP: leukoplakia | ||
| NEOLP: Non-erosive oral lichen planus | ||
| OSCC: Oral squamous cell carcinoma | ||
| Prostate | 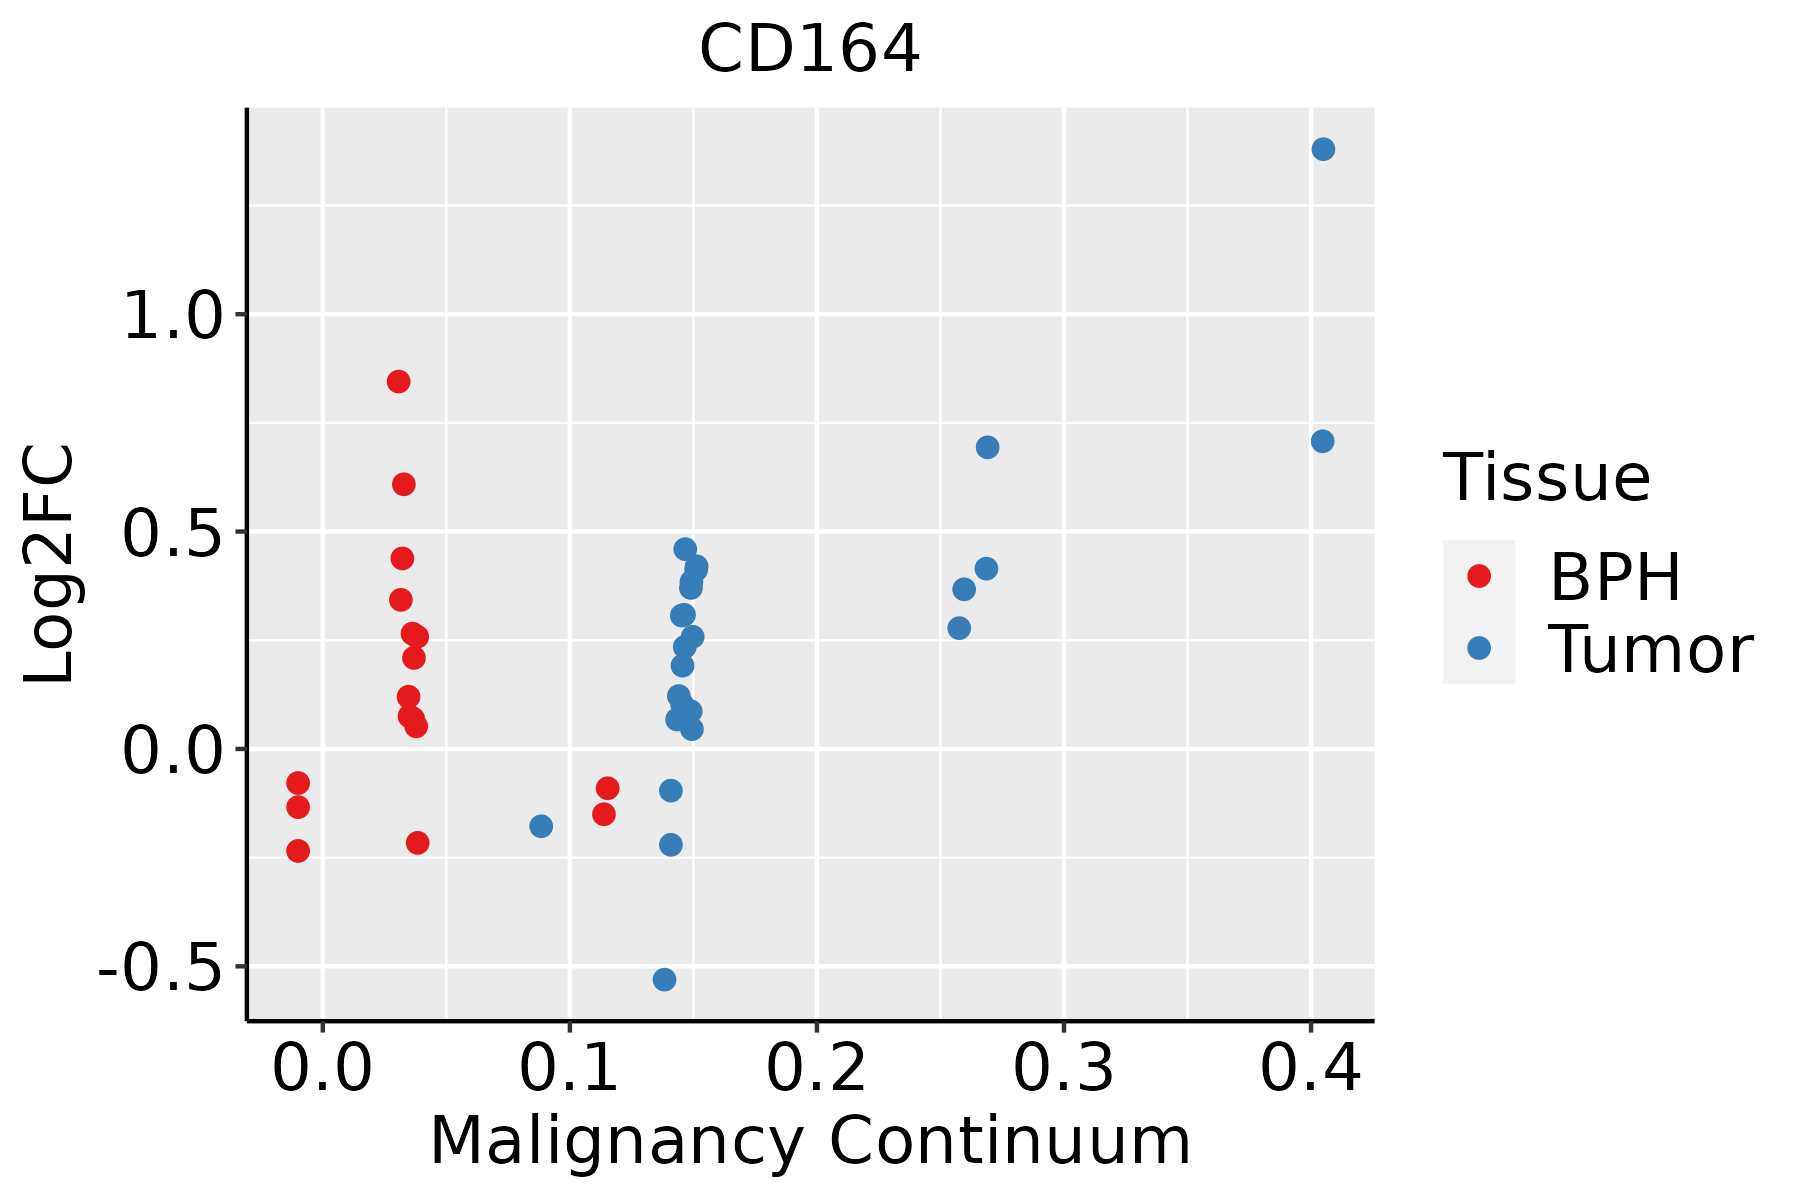 | BPH: Benign Prostatic Hyperplasia |
| Skin | 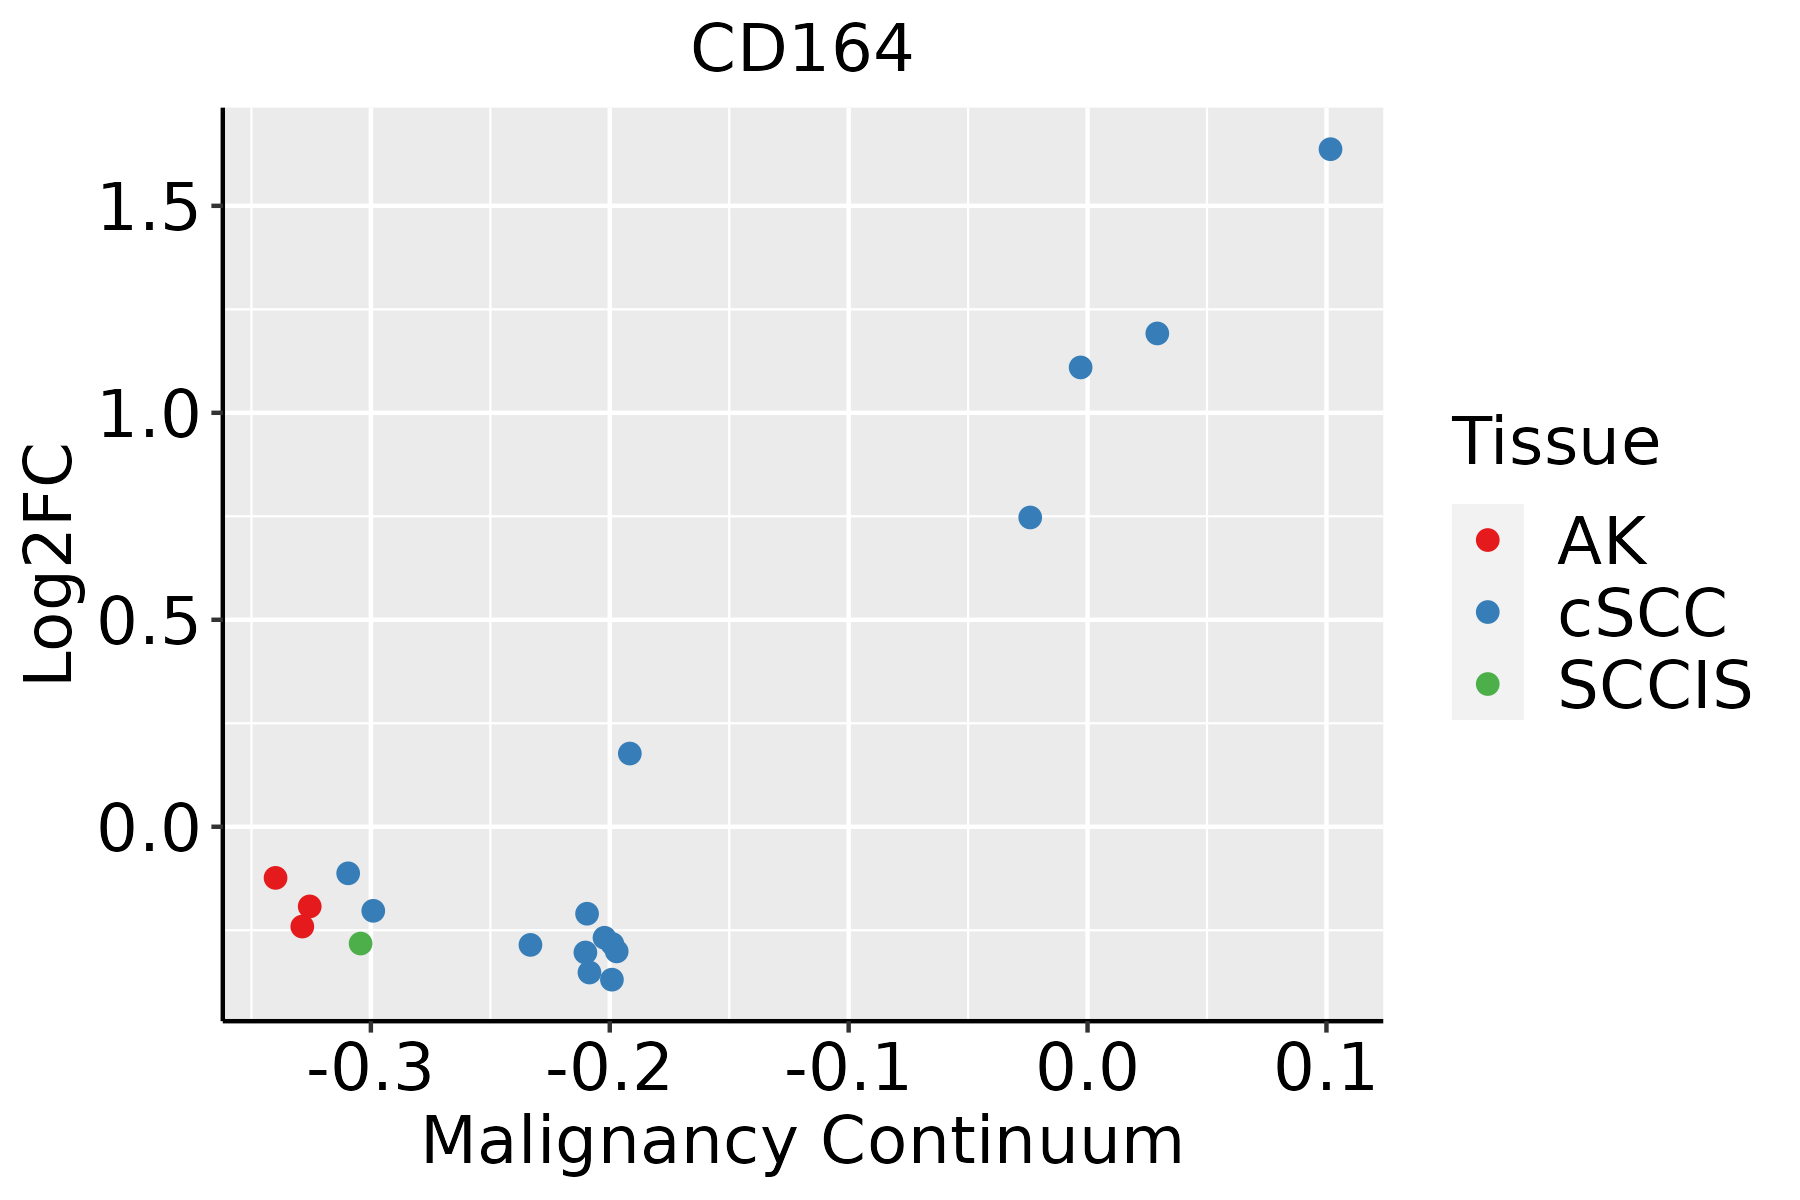 | AK: Actinic keratosis |
| cSCC: Cutaneous squamous cell carcinoma | ||
| SCCIS:squamous cell carcinoma in situ | ||
| Thyroid |  | ATC: Anaplastic thyroid cancer |
| HT: Hashimoto's thyroiditis | ||
| PTC: Papillary thyroid cancer |
| ∗log2FC in expression of this searched gene in stem-like cells from each diseased tissue sample relative to stem-like cells in normal samples in each tissue plotted against the malignancy continuum. Samples are colored based on if they are from different disease stage. |
Top |
Malignant transformation related pathway analysis |
| Find out the enriched GO biological processes and KEGG pathways involved in transition from healthy to precancer to cancer |
| Tissue | Disease Stage | Enriched GO biological Processes |
| Colorectum | AD |  |
| Colorectum | SER |  |
| Colorectum | MSS |  |
| Colorectum | MSI-H |  |
| Colorectum | FAP |  |
| ∗Top 15 enriched GO BP terms are showed in the bar plot of each disease state in each tissue. Each row represents a significant GO biological process which is colored according to the -log10(p.adjust). |
| Page: 1 2 3 4 5 6 7 8 9 |
| GO ID | Tissue | Disease Stage | Description | Gene Ratio | Bg Ratio | pvalue | p.adjust | Count |
| GO:00071625 | Breast | IDC | negative regulation of cell adhesion | 37/1434 | 303/18723 | 3.27e-03 | 2.75e-02 | 37 |
| GO:00075172 | Breast | IDC | muscle organ development | 38/1434 | 327/18723 | 6.63e-03 | 4.62e-02 | 38 |
| GO:000716212 | Breast | DCIS | negative regulation of cell adhesion | 36/1390 | 303/18723 | 3.49e-03 | 2.90e-02 | 36 |
| GO:00075171 | Breast | DCIS | muscle organ development | 37/1390 | 327/18723 | 6.86e-03 | 4.75e-02 | 37 |
| GO:0007162 | Colorectum | SER | negative regulation of cell adhesion | 68/2897 | 303/18723 | 8.02e-04 | 1.01e-02 | 68 |
| GO:00071621 | Colorectum | FAP | negative regulation of cell adhesion | 61/2622 | 303/18723 | 1.96e-03 | 1.65e-02 | 61 |
| GO:00075174 | Endometrium | AEH | muscle organ development | 60/2100 | 327/18723 | 8.19e-05 | 1.22e-03 | 60 |
| GO:00071627 | Endometrium | AEH | negative regulation of cell adhesion | 49/2100 | 303/18723 | 5.43e-03 | 3.37e-02 | 49 |
| GO:000751712 | Endometrium | EEC | muscle organ development | 59/2168 | 327/18723 | 3.49e-04 | 3.85e-03 | 59 |
| GO:000716214 | Endometrium | EEC | negative regulation of cell adhesion | 54/2168 | 303/18723 | 8.19e-04 | 7.62e-03 | 54 |
| GO:00071624 | Liver | Cirrhotic | negative regulation of cell adhesion | 93/4634 | 303/18723 | 1.06e-02 | 4.66e-02 | 93 |
| GO:00071629 | Oral cavity | OSCC | negative regulation of cell adhesion | 145/7305 | 303/18723 | 9.95e-04 | 5.18e-03 | 145 |
| GO:00071628 | Prostate | BPH | negative regulation of cell adhesion | 82/3107 | 303/18723 | 2.51e-06 | 4.04e-05 | 82 |
| GO:00075175 | Prostate | BPH | muscle organ development | 71/3107 | 327/18723 | 9.00e-03 | 3.84e-02 | 71 |
| GO:000716215 | Prostate | Tumor | negative regulation of cell adhesion | 82/3246 | 303/18723 | 1.38e-05 | 1.89e-04 | 82 |
| GO:000751713 | Prostate | Tumor | muscle organ development | 74/3246 | 327/18723 | 8.03e-03 | 3.54e-02 | 74 |
| GO:000716210 | Skin | AK | negative regulation of cell adhesion | 55/1910 | 303/18723 | 1.64e-05 | 3.15e-04 | 55 |
| GO:00075177 | Skin | AK | muscle organ development | 50/1910 | 327/18723 | 2.38e-03 | 1.56e-02 | 50 |
| GO:000716224 | Skin | cSCC | negative regulation of cell adhesion | 98/4864 | 303/18723 | 7.45e-03 | 3.50e-02 | 98 |
| GO:00075178 | Thyroid | HT | muscle organ development | 44/1272 | 327/18723 | 1.09e-05 | 2.91e-04 | 44 |
| Page: 1 2 |
| Pathway ID | Tissue | Disease Stage | Description | Gene Ratio | Bg Ratio | pvalue | p.adjust | qvalue | Count |
| hsa04142 | Colorectum | SER | Lysosome | 38/1580 | 132/8465 | 2.87e-03 | 2.03e-02 | 1.47e-02 | 38 |
| hsa041421 | Colorectum | SER | Lysosome | 38/1580 | 132/8465 | 2.87e-03 | 2.03e-02 | 1.47e-02 | 38 |
| hsa0414222 | Esophagus | ESCC | Lysosome | 102/4205 | 132/8465 | 5.11e-11 | 7.13e-10 | 3.65e-10 | 102 |
| hsa0414232 | Esophagus | ESCC | Lysosome | 102/4205 | 132/8465 | 5.11e-11 | 7.13e-10 | 3.65e-10 | 102 |
| hsa041424 | Liver | Cirrhotic | Lysosome | 68/2530 | 132/8465 | 1.34e-07 | 1.97e-06 | 1.21e-06 | 68 |
| hsa0414211 | Liver | Cirrhotic | Lysosome | 68/2530 | 132/8465 | 1.34e-07 | 1.97e-06 | 1.21e-06 | 68 |
| hsa041422 | Liver | HCC | Lysosome | 100/4020 | 132/8465 | 2.32e-11 | 4.31e-10 | 2.40e-10 | 100 |
| hsa041423 | Liver | HCC | Lysosome | 100/4020 | 132/8465 | 2.32e-11 | 4.31e-10 | 2.40e-10 | 100 |
| hsa041425 | Oral cavity | OSCC | Lysosome | 87/3704 | 132/8465 | 1.97e-07 | 1.35e-06 | 6.86e-07 | 87 |
| hsa0414212 | Oral cavity | OSCC | Lysosome | 87/3704 | 132/8465 | 1.97e-07 | 1.35e-06 | 6.86e-07 | 87 |
| hsa0414221 | Oral cavity | LP | Lysosome | 67/2418 | 132/8465 | 5.13e-08 | 7.77e-07 | 5.01e-07 | 67 |
| hsa0414231 | Oral cavity | LP | Lysosome | 67/2418 | 132/8465 | 5.13e-08 | 7.77e-07 | 5.01e-07 | 67 |
| Page: 1 |
Top |
Cell-cell communication analysis |
| Identification of potential cell-cell interactions between two cell types and their ligand-receptor pairs for different disease states |
| Ligand | Receptor | LRpair | Pathway | Tissue | Disease Stage |
| Page: 1 |
Top |
Single-cell gene regulatory network inference analysis |
| Find out the significant the regulons (TFs) and the target genes of each regulon across cell types for different disease states |
| TF | Cell Type | Tissue | Disease Stage | Target Gene | RSS | Regulon Activity |
| ∗The dot plots of a searched regulon are shown for all cell subpopulations in each disease state of each tissue based on the regulon specific score inferred using pySCENIC and by calculating the average expression. |
| Page: 1 |
Top |
Somatic mutation of malignant transformation related genes |
| Annotation of somatic variants for genes involved in malignant transformation |
| Hugo Symbol | Variant Class | Variant Classification | dbSNP RS | HGVSc | HGVSp | HGVSp Short | SWISSPROT | BIOTYPE | SIFT | PolyPhen | Tumor Sample Barcode | Tissue | Histology | Sex | Age | Stage | Therapy Types | Drugs | Outcome |
| CD164 | insertion | In_Frame_Ins | novel | c.134_135insCTCGGC | p.Ser44_Ala45dup | p.S44_A45dup | Q04900 | protein_coding | TCGA-A2-A0T7-01 | Breast | breast invasive carcinoma | Female | <65 | I/II | Chemotherapy | adriamycin | SD | ||
| CD164 | SNV | Missense_Mutation | c.146C>T | p.Ser49Phe | p.S49F | Q04900 | protein_coding | deleterious(0.02) | benign(0.398) | TCGA-5M-AAT5-01 | Colorectum | colon adenocarcinoma | Unknown | Unknown | I/II | Unknown | Unknown | Unknown | |
| CD164 | SNV | Missense_Mutation | c.388N>T | p.Pro130Ser | p.P130S | Q04900 | protein_coding | tolerated(0.06) | possibly_damaging(0.821) | TCGA-AD-6895-01 | Colorectum | colon adenocarcinoma | Male | >=65 | III/IV | Unknown | Unknown | SD | |
| CD164 | SNV | Missense_Mutation | novel | c.431N>T | p.Thr144Ile | p.T144I | Q04900 | protein_coding | deleterious(0.04) | possibly_damaging(0.637) | TCGA-A5-A0G1-01 | Endometrium | uterine corpus endometrioid carcinoma | Female | >=65 | I/II | Unknown | Unknown | SD |
| CD164 | SNV | Missense_Mutation | rs866904774 | c.32N>T | p.Ala11Val | p.A11V | Q04900 | protein_coding | deleterious_low_confidence(0.04) | possibly_damaging(0.823) | TCGA-AX-A1C4-01 | Endometrium | uterine corpus endometrioid carcinoma | Female | <65 | I/II | Unknown | Unknown | SD |
| CD164 | SNV | Missense_Mutation | novel | c.243N>G | p.Phe81Leu | p.F81L | Q04900 | protein_coding | tolerated(0.15) | benign(0.197) | TCGA-B5-A1MR-01 | Endometrium | uterine corpus endometrioid carcinoma | Female | >=65 | III/IV | Unknown | Unknown | SD |
| CD164 | SNV | Missense_Mutation | novel | c.160N>G | p.Thr54Ala | p.T54A | Q04900 | protein_coding | tolerated(0.18) | possibly_damaging(0.841) | TCGA-D1-A175-01 | Endometrium | uterine corpus endometrioid carcinoma | Female | <65 | I/II | Chemotherapy | paclitaxel | SD |
| CD164 | SNV | Missense_Mutation | novel | c.185A>C | p.Glu62Ala | p.E62A | Q04900 | protein_coding | tolerated(0.14) | benign(0.013) | TCGA-FI-A2D5-01 | Endometrium | uterine corpus endometrioid carcinoma | Female | <65 | III/IV | Chemotherapy | carboplatinum | PD |
| CD164 | SNV | Missense_Mutation | c.427N>C | p.Gly143Arg | p.G143R | Q04900 | protein_coding | deleterious(0.01) | probably_damaging(0.993) | TCGA-55-8620-01 | Lung | lung adenocarcinoma | Male | <65 | III/IV | Unknown | Unknown | PD | |
| CD164 | SNV | Missense_Mutation | c.251A>G | p.Glu84Gly | p.E84G | Q04900 | protein_coding | deleterious(0.03) | possibly_damaging(0.639) | TCGA-33-4547-01 | Lung | lung squamous cell carcinoma | Male | >=65 | I/II | Unknown | Unknown | SD |
| Page: 1 2 |
Top |
Related drugs of malignant transformation related genes |
| Identification of chemicals and drugs interact with genes involved in malignant transfromation |
| (DGIdb 4.0) |
| Entrez ID | Symbol | Category | Interaction Types | Drug Claim Name | Drug Name | PMIDs |
| Page: 1 |

Copyright 2023-Present -The University of Texas Health Science Center at Houston |