
|
|||||
|
 | |
| |
| |
| |
| |
| |
|
Gene: CD151 |
Gene summary for CD151 |
| Gene information | Species | Human | Gene symbol | CD151 | Gene ID | 977 |
| Gene name | CD151 molecule (Raph blood group) | |
| Gene Alias | GP27 | |
| Cytomap | 11p15.5 | |
| Gene Type | protein-coding | GO ID | GO:0001775 | UniProtAcc | A0A024RCB3 |
Top |
Malignant transformation analysis |
| Identification of the aberrant gene expression in precancerous and cancerous lesions by comparing the gene expression of stem-like cells in diseased tissues with normal stem cells |
| Entrez ID | Symbol | Replicates | Species | Organ | Tissue | Adj P-value | Log2FC | Malignancy |
| 977 | CD151 | GSM4909285 | Human | Breast | IDC | 1.96e-14 | -4.54e-01 | 0.21 |
| 977 | CD151 | GSM4909286 | Human | Breast | IDC | 5.12e-04 | -2.71e-01 | 0.1081 |
| 977 | CD151 | GSM4909294 | Human | Breast | IDC | 1.91e-03 | -2.98e-01 | 0.2022 |
| 977 | CD151 | GSM4909296 | Human | Breast | IDC | 1.42e-06 | -3.07e-02 | 0.1524 |
| 977 | CD151 | GSM4909297 | Human | Breast | IDC | 1.21e-14 | -1.85e-01 | 0.1517 |
| 977 | CD151 | GSM4909301 | Human | Breast | IDC | 1.70e-03 | -3.19e-01 | 0.1577 |
| 977 | CD151 | GSM4909305 | Human | Breast | IDC | 2.24e-03 | 2.66e-01 | 0.0436 |
| 977 | CD151 | GSM4909311 | Human | Breast | IDC | 2.21e-31 | -3.30e-01 | 0.1534 |
| 977 | CD151 | GSM4909312 | Human | Breast | IDC | 1.22e-15 | -4.60e-01 | 0.1552 |
| 977 | CD151 | GSM4909316 | Human | Breast | IDC | 9.20e-04 | 1.15e-02 | 0.21 |
| 977 | CD151 | GSM4909317 | Human | Breast | IDC | 7.71e-19 | 5.06e-01 | 0.1355 |
| 977 | CD151 | GSM4909319 | Human | Breast | IDC | 3.32e-39 | -1.47e-01 | 0.1563 |
| 977 | CD151 | GSM4909320 | Human | Breast | IDC | 1.73e-05 | -3.07e-01 | 0.1575 |
| 977 | CD151 | GSM4909321 | Human | Breast | IDC | 1.28e-13 | -1.26e-02 | 0.1559 |
| 977 | CD151 | brca1 | Human | Breast | Precancer | 3.30e-31 | 5.99e-01 | -0.0338 |
| 977 | CD151 | brca2 | Human | Breast | Precancer | 2.06e-22 | 4.75e-01 | -0.024 |
| 977 | CD151 | brca3 | Human | Breast | Precancer | 1.13e-17 | 4.73e-01 | -0.0263 |
| 977 | CD151 | brca10 | Human | Breast | Precancer | 1.94e-02 | 2.22e-01 | -0.0029 |
| 977 | CD151 | NCCBC14 | Human | Breast | DCIS | 2.57e-20 | -2.80e-01 | 0.2021 |
| 977 | CD151 | NCCBC2 | Human | Breast | DCIS | 3.91e-03 | -1.04e-01 | 0.1554 |
| Page: 1 2 3 4 5 6 7 8 9 10 11 12 |
| Tissue | Expression Dynamics | Abbreviation |
| Breast | 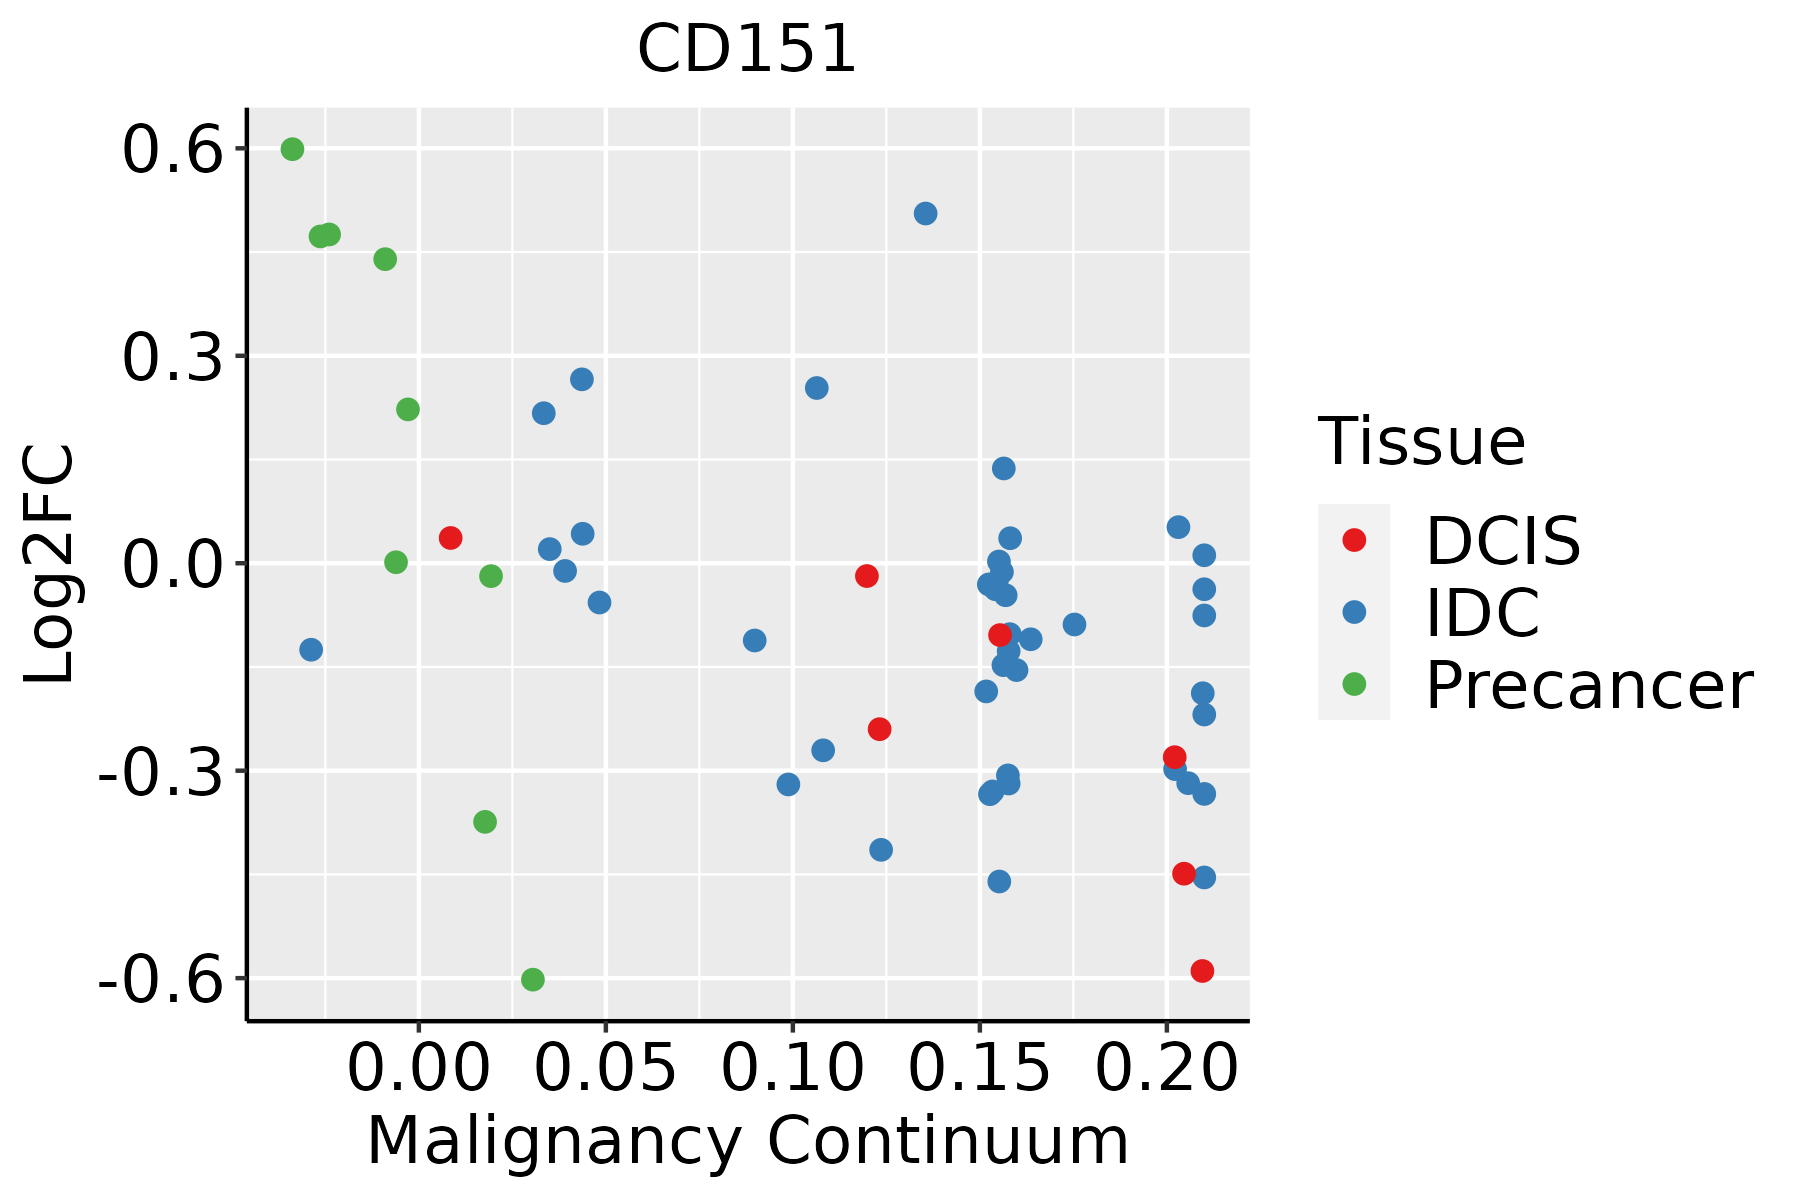 | IDC: Invasive ductal carcinoma |
| DCIS: Ductal carcinoma in situ | ||
| Precancer(BRCA1-mut): Precancerous lesion from BRCA1 mutation carriers | ||
| Cervix |  | CC: Cervix cancer |
| HSIL_HPV: HPV-infected high-grade squamous intraepithelial lesions | ||
| N_HPV: HPV-infected normal cervix | ||
| Colorectum (GSE201348) |  | FAP: Familial adenomatous polyposis |
| CRC: Colorectal cancer | ||
| Colorectum (HTA11) |  | AD: Adenomas |
| SER: Sessile serrated lesions | ||
| MSI-H: Microsatellite-high colorectal cancer | ||
| MSS: Microsatellite stable colorectal cancer | ||
| Endometrium | 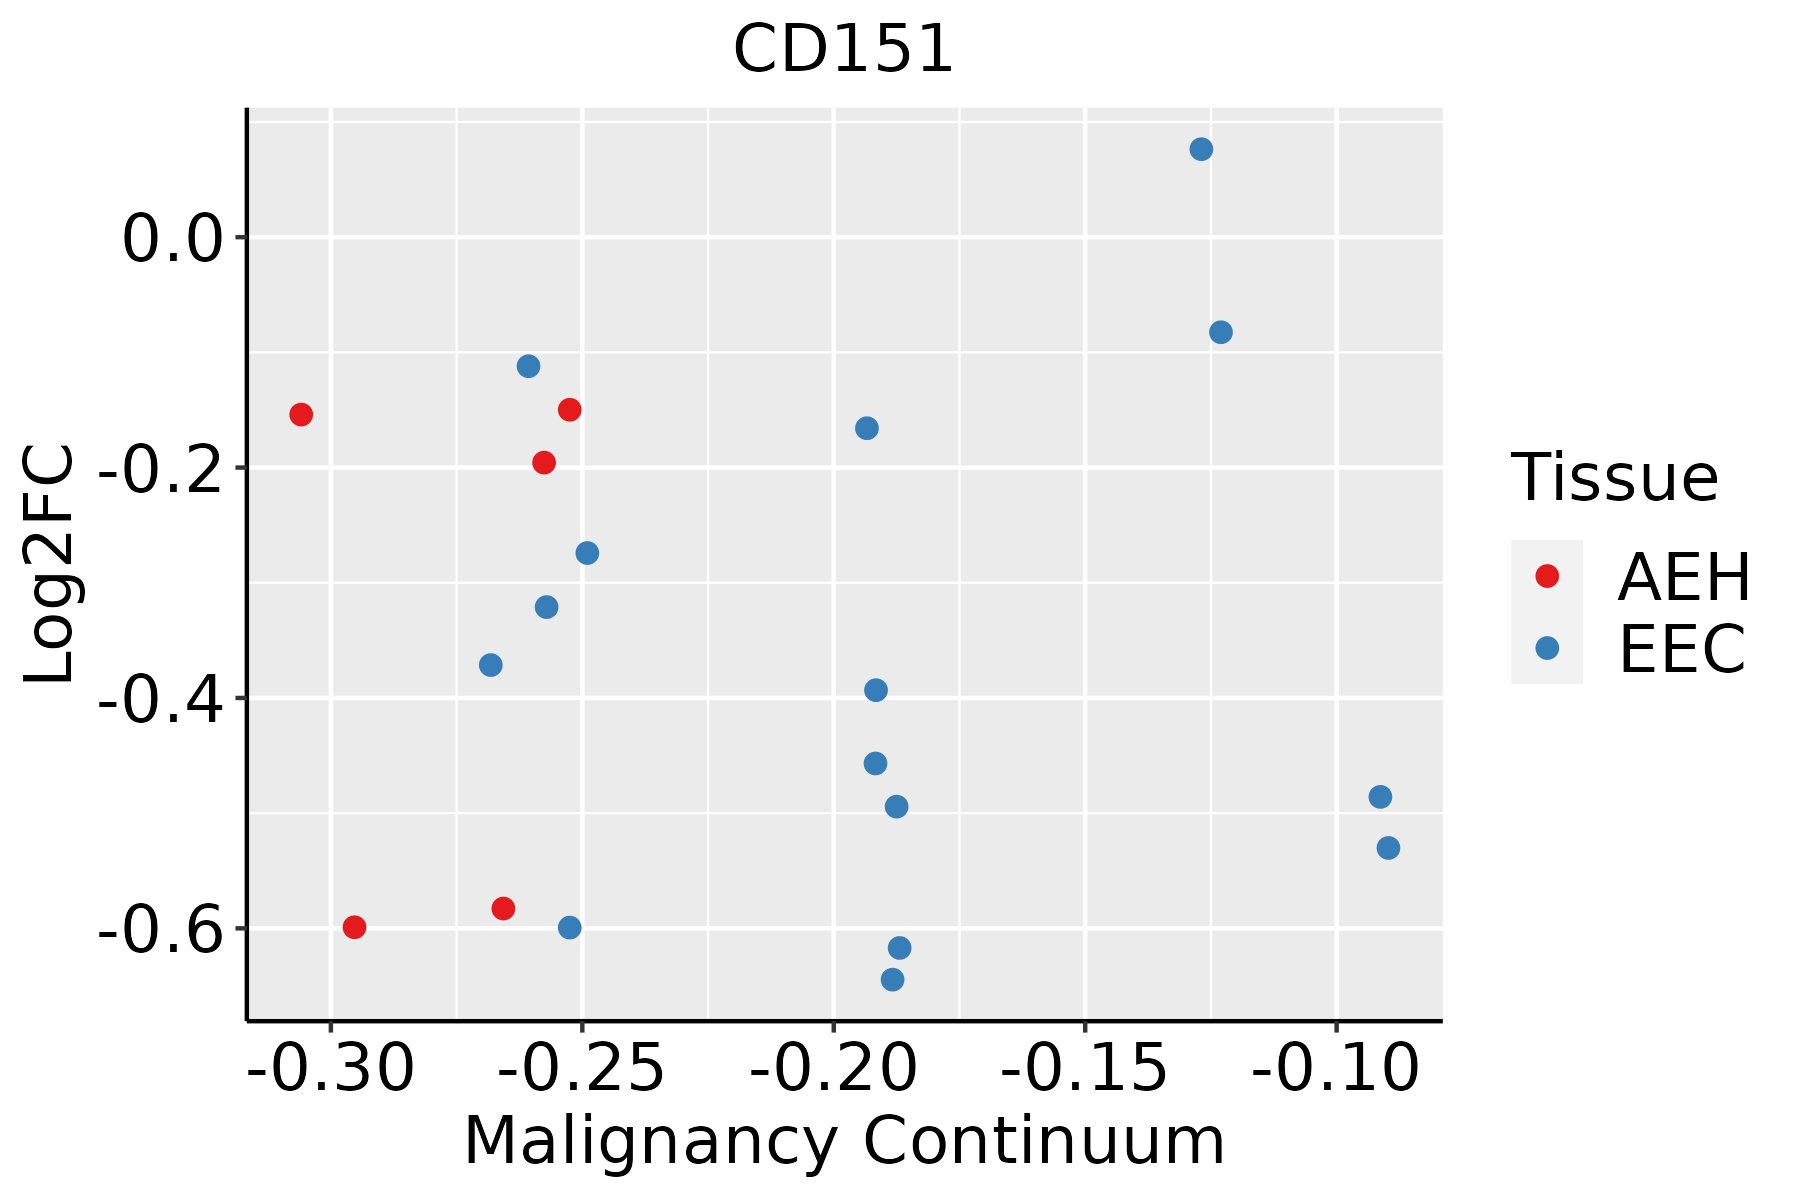 | AEH: Atypical endometrial hyperplasia |
| EEC: Endometrioid Cancer | ||
| Esophagus |  | ESCC: Esophageal squamous cell carcinoma |
| HGIN: High-grade intraepithelial neoplasias | ||
| LGIN: Low-grade intraepithelial neoplasias | ||
| Liver | 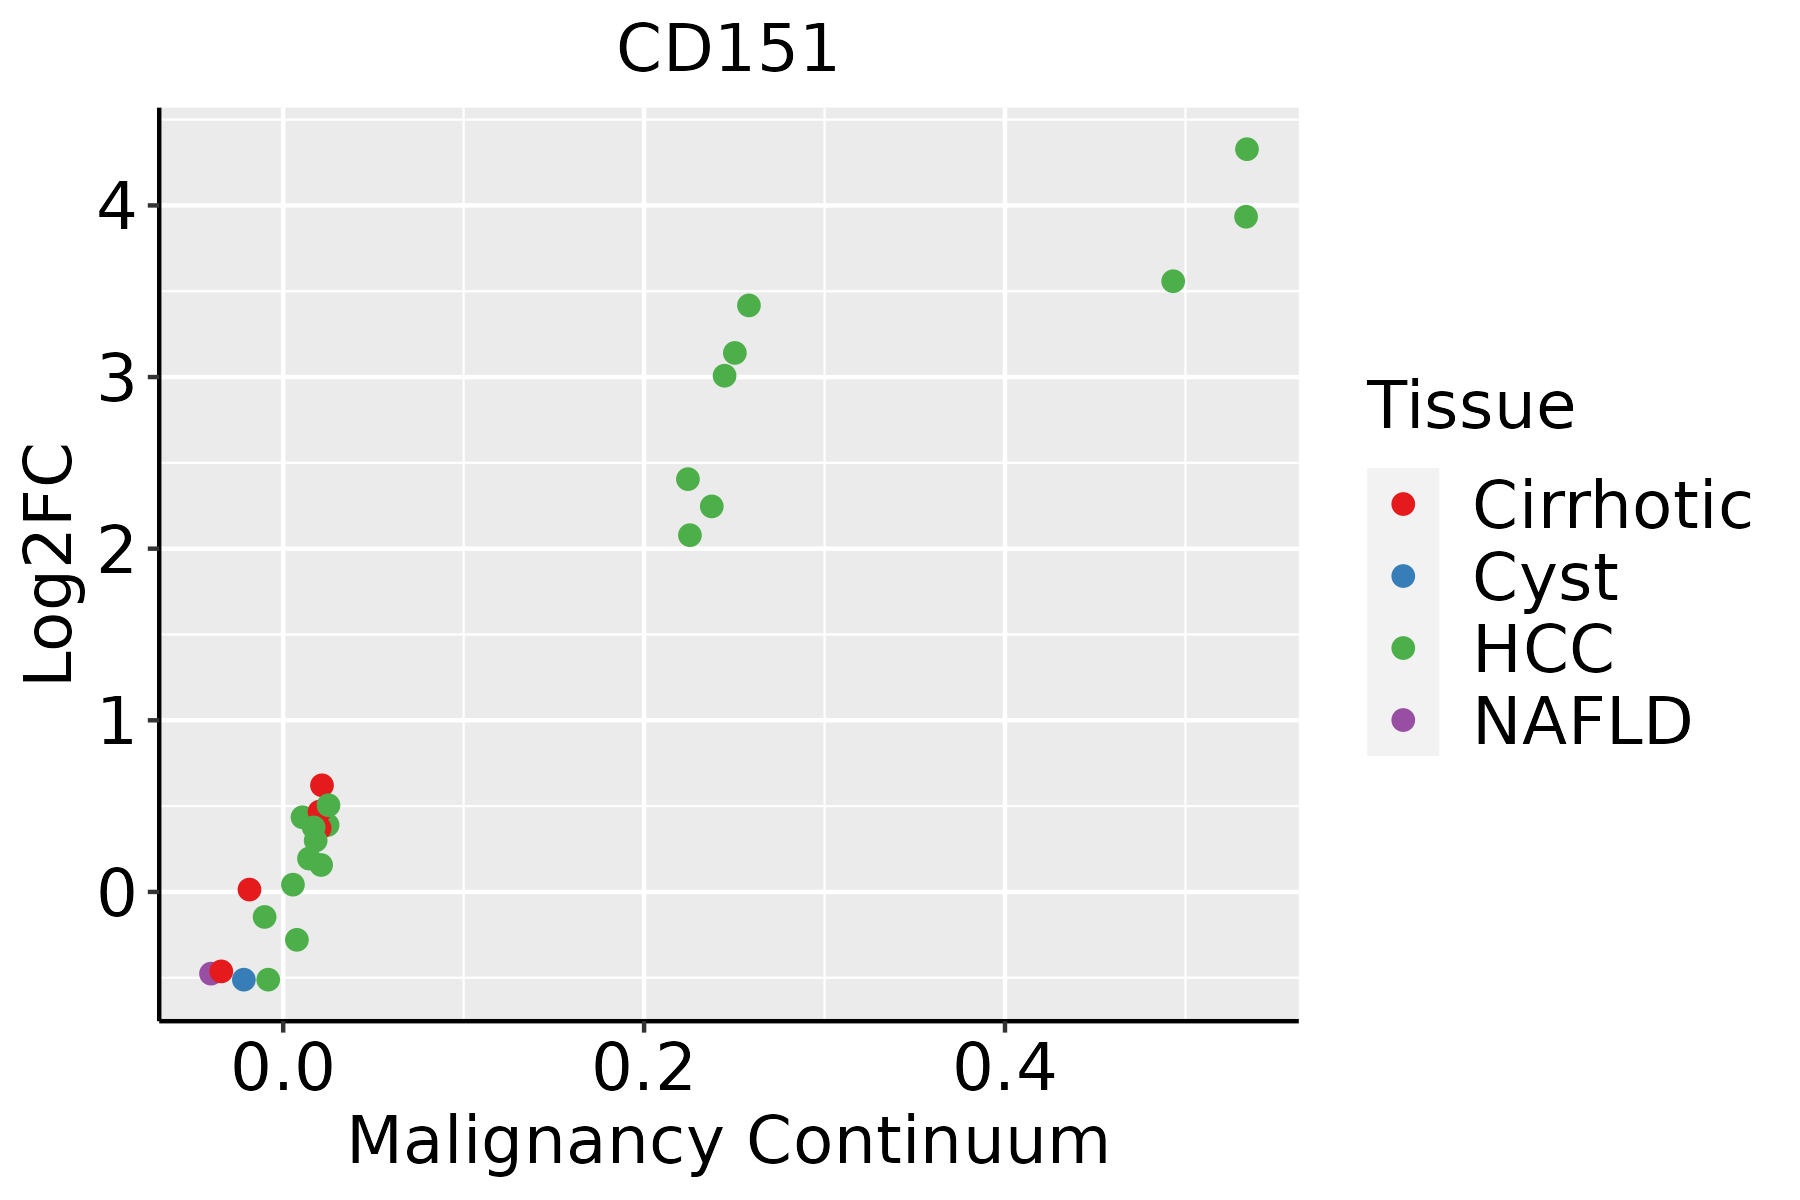 | HCC: Hepatocellular carcinoma |
| NAFLD: Non-alcoholic fatty liver disease | ||
| Oral Cavity | 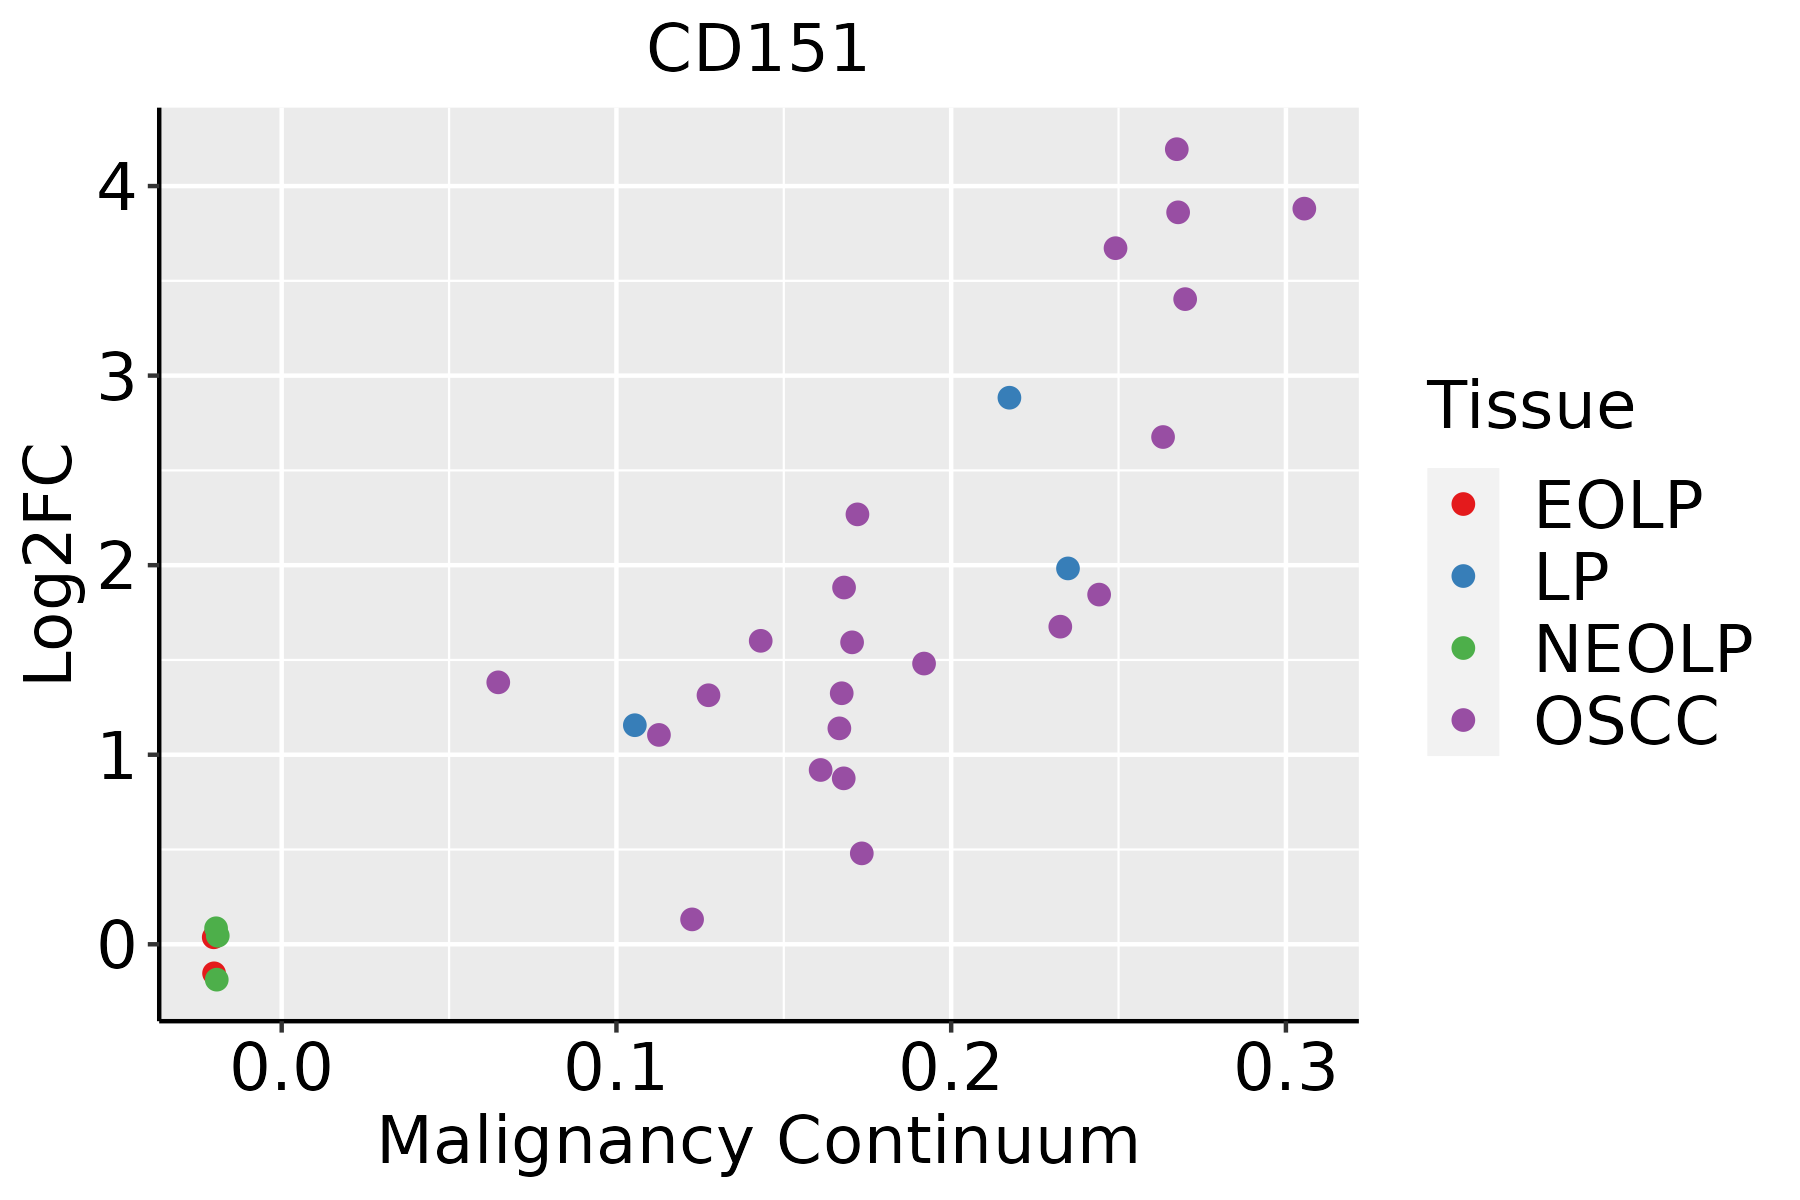 | EOLP: Erosive Oral lichen planus |
| LP: leukoplakia | ||
| NEOLP: Non-erosive oral lichen planus | ||
| OSCC: Oral squamous cell carcinoma | ||
| Prostate | 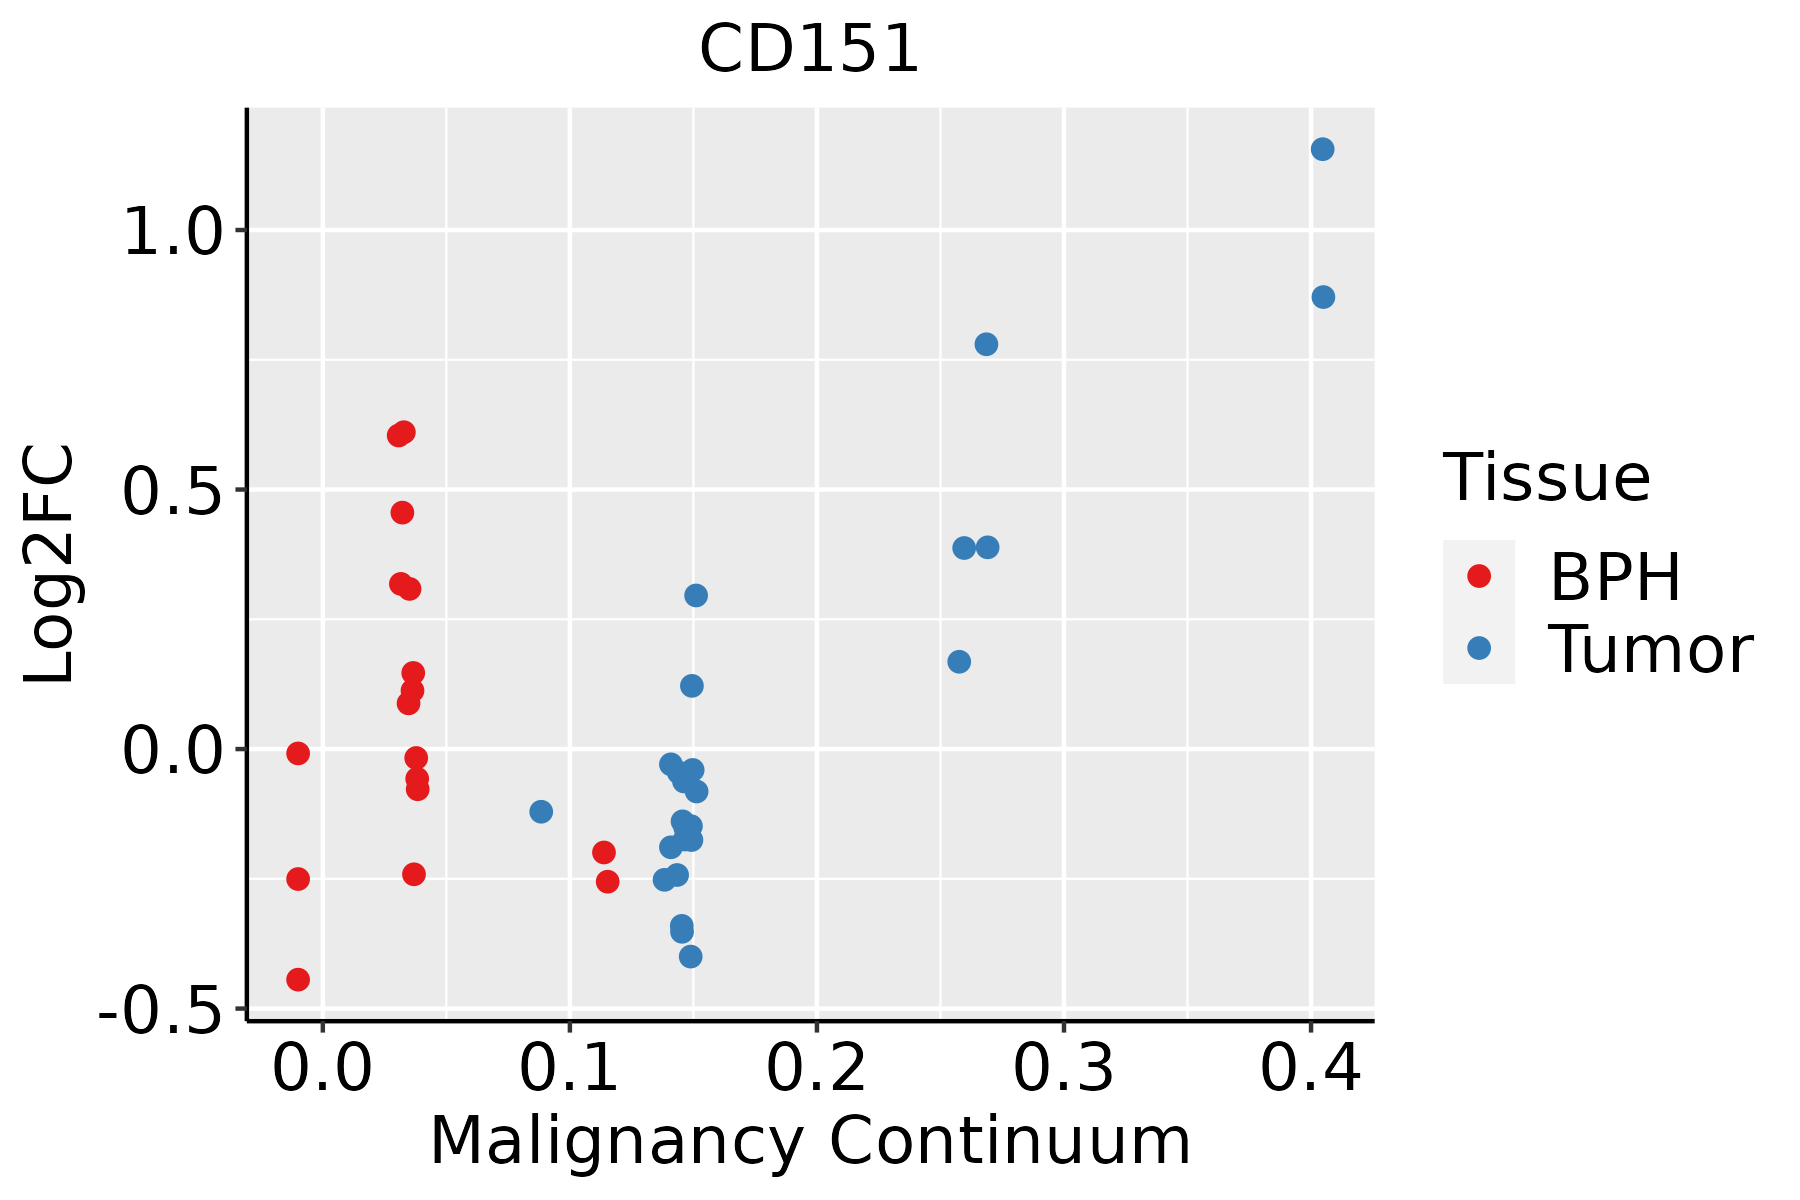 | BPH: Benign Prostatic Hyperplasia |
| Skin |  | AK: Actinic keratosis |
| cSCC: Cutaneous squamous cell carcinoma | ||
| SCCIS:squamous cell carcinoma in situ | ||
| Thyroid |  | ATC: Anaplastic thyroid cancer |
| HT: Hashimoto's thyroiditis | ||
| PTC: Papillary thyroid cancer |
| ∗log2FC in expression of this searched gene in stem-like cells from each diseased tissue sample relative to stem-like cells in normal samples in each tissue plotted against the malignancy continuum. Samples are colored based on if they are from different disease stage. |
Top |
Malignant transformation related pathway analysis |
| Find out the enriched GO biological processes and KEGG pathways involved in transition from healthy to precancer to cancer |
| Tissue | Disease Stage | Enriched GO biological Processes |
| Colorectum | AD |  |
| Colorectum | SER |  |
| Colorectum | MSS |  |
| Colorectum | MSI-H |  |
| Colorectum | FAP |  |
| ∗Top 15 enriched GO BP terms are showed in the bar plot of each disease state in each tissue. Each row represents a significant GO biological process which is colored according to the -log10(p.adjust). |
| Page: 1 2 3 4 5 6 7 8 9 |
| GO ID | Tissue | Disease Stage | Description | Gene Ratio | Bg Ratio | pvalue | p.adjust | Count |
| GO:00420609 | Breast | Precancer | wound healing | 48/1080 | 422/18723 | 5.48e-06 | 1.63e-04 | 48 |
| GO:00421107 | Breast | Precancer | T cell activation | 52/1080 | 487/18723 | 1.37e-05 | 3.42e-04 | 52 |
| GO:00420987 | Breast | Precancer | T cell proliferation | 23/1080 | 199/18723 | 1.17e-03 | 1.27e-02 | 23 |
| GO:00458076 | Breast | Precancer | positive regulation of endocytosis | 14/1080 | 100/18723 | 1.77e-03 | 1.74e-02 | 14 |
| GO:004211012 | Breast | IDC | T cell activation | 64/1434 | 487/18723 | 1.49e-05 | 3.77e-04 | 64 |
| GO:004206014 | Breast | IDC | wound healing | 55/1434 | 422/18723 | 7.27e-05 | 1.45e-03 | 55 |
| GO:004580713 | Breast | IDC | positive regulation of endocytosis | 18/1434 | 100/18723 | 5.40e-04 | 6.96e-03 | 18 |
| GO:004209812 | Breast | IDC | T cell proliferation | 28/1434 | 199/18723 | 1.29e-03 | 1.35e-02 | 28 |
| GO:00301007 | Breast | IDC | regulation of endocytosis | 27/1434 | 211/18723 | 5.92e-03 | 4.26e-02 | 27 |
| GO:004211021 | Breast | DCIS | T cell activation | 65/1390 | 487/18723 | 2.78e-06 | 9.42e-05 | 65 |
| GO:004206024 | Breast | DCIS | wound healing | 54/1390 | 422/18723 | 6.09e-05 | 1.22e-03 | 54 |
| GO:004209821 | Breast | DCIS | T cell proliferation | 29/1390 | 199/18723 | 3.64e-04 | 5.15e-03 | 29 |
| GO:004580722 | Breast | DCIS | positive regulation of endocytosis | 17/1390 | 100/18723 | 1.05e-03 | 1.15e-02 | 17 |
| GO:00706616 | Breast | DCIS | leukocyte proliferation | 37/1390 | 318/18723 | 4.39e-03 | 3.41e-02 | 37 |
| GO:00466515 | Breast | DCIS | lymphocyte proliferation | 34/1390 | 288/18723 | 4.91e-03 | 3.70e-02 | 34 |
| GO:00329434 | Breast | DCIS | mononuclear cell proliferation | 34/1390 | 291/18723 | 5.75e-03 | 4.14e-02 | 34 |
| GO:004206010 | Cervix | CC | wound healing | 109/2311 | 422/18723 | 1.84e-14 | 1.57e-11 | 109 |
| GO:00421108 | Cervix | CC | T cell activation | 107/2311 | 487/18723 | 1.24e-09 | 1.46e-07 | 107 |
| GO:00443193 | Cervix | CC | wound healing, spreading of cells | 17/2311 | 34/18723 | 9.86e-08 | 5.25e-06 | 17 |
| GO:00905053 | Cervix | CC | epiboly involved in wound healing | 17/2311 | 34/18723 | 9.86e-08 | 5.25e-06 | 17 |
| Page: 1 2 3 4 5 6 7 |
| Pathway ID | Tissue | Disease Stage | Description | Gene Ratio | Bg Ratio | pvalue | p.adjust | qvalue | Count |
| Page: 1 |
Top |
Cell-cell communication analysis |
| Identification of potential cell-cell interactions between two cell types and their ligand-receptor pairs for different disease states |
| Ligand | Receptor | LRpair | Pathway | Tissue | Disease Stage |
| Page: 1 |
Top |
Single-cell gene regulatory network inference analysis |
| Find out the significant the regulons (TFs) and the target genes of each regulon across cell types for different disease states |
| TF | Cell Type | Tissue | Disease Stage | Target Gene | RSS | Regulon Activity |
| ∗The dot plots of a searched regulon are shown for all cell subpopulations in each disease state of each tissue based on the regulon specific score inferred using pySCENIC and by calculating the average expression. |
| Page: 1 |
Top |
Somatic mutation of malignant transformation related genes |
| Annotation of somatic variants for genes involved in malignant transformation |
| Hugo Symbol | Variant Class | Variant Classification | dbSNP RS | HGVSc | HGVSp | HGVSp Short | SWISSPROT | BIOTYPE | SIFT | PolyPhen | Tumor Sample Barcode | Tissue | Histology | Sex | Age | Stage | Therapy Types | Drugs | Outcome |
| CD151 | SNV | Missense_Mutation | c.645C>A | p.Phe215Leu | p.F215L | P48509 | protein_coding | deleterious(0.05) | possibly_damaging(0.837) | TCGA-BH-A18P-01 | Breast | breast invasive carcinoma | Female | <65 | I/II | Unknown | Unknown | PD | |
| CD151 | deletion | Frame_Shift_Del | novel | c.369delN | p.Glu124ArgfsTer3 | p.E124Rfs*3 | P48509 | protein_coding | TCGA-D8-A27V-01 | Breast | breast invasive carcinoma | Female | <65 | I/II | Hormone Therapy | tamoxiphen | SD | ||
| CD151 | SNV | Missense_Mutation | c.188N>G | p.Ile63Ser | p.I63S | P48509 | protein_coding | deleterious(0.04) | possibly_damaging(0.643) | TCGA-FU-A3TX-01 | Cervix | cervical & endocervical cancer | Female | >=65 | I/II | Unknown | Unknown | SD | |
| CD151 | SNV | Missense_Mutation | rs534240443 | c.619G>A | p.Gly207Ser | p.G207S | P48509 | protein_coding | deleterious(0) | probably_damaging(0.989) | TCGA-A6-2686-01 | Colorectum | colon adenocarcinoma | Female | >=65 | I/II | Unknown | Unknown | SD |
| CD151 | SNV | Missense_Mutation | c.641N>T | p.Thr214Ile | p.T214I | P48509 | protein_coding | deleterious(0.04) | benign(0.062) | TCGA-A6-6780-01 | Colorectum | colon adenocarcinoma | Male | >=65 | I/II | Unknown | Unknown | SD | |
| CD151 | deletion | Frame_Shift_Del | c.533delN | p.Arg178LeufsTer43 | p.R178Lfs*43 | P48509 | protein_coding | TCGA-CM-6674-01 | Colorectum | colon adenocarcinoma | Male | <65 | I/II | Unknown | Unknown | SD | |||
| CD151 | SNV | Missense_Mutation | novel | c.209N>C | p.Val70Ala | p.V70A | P48509 | protein_coding | deleterious(0) | possibly_damaging(0.489) | TCGA-AX-A1CE-01 | Endometrium | uterine corpus endometrioid carcinoma | Female | <65 | I/II | Unspecific | Paclitaxel | SD |
| CD151 | SNV | Missense_Mutation | rs758951148 | c.272N>A | p.Arg91His | p.R91H | P48509 | protein_coding | tolerated(0.56) | possibly_damaging(0.806) | TCGA-AX-A2HD-01 | Endometrium | uterine corpus endometrioid carcinoma | Female | >=65 | III/IV | Unknown | Unknown | SD |
| CD151 | SNV | Missense_Mutation | novel | c.364N>T | p.Leu122Phe | p.L122F | P48509 | protein_coding | deleterious(0.02) | probably_damaging(0.998) | TCGA-AX-A2HD-01 | Endometrium | uterine corpus endometrioid carcinoma | Female | >=65 | III/IV | Unknown | Unknown | SD |
| CD151 | SNV | Missense_Mutation | rs766766478 | c.337N>A | p.Ala113Thr | p.A113T | P48509 | protein_coding | deleterious(0) | benign(0.017) | TCGA-B5-A3FC-01 | Endometrium | uterine corpus endometrioid carcinoma | Female | <65 | I/II | Unknown | Unknown | SD |
| Page: 1 2 3 |
Top |
Related drugs of malignant transformation related genes |
| Identification of chemicals and drugs interact with genes involved in malignant transfromation |
| (DGIdb 4.0) |
| Entrez ID | Symbol | Category | Interaction Types | Drug Claim Name | Drug Name | PMIDs |
| Page: 1 |

Copyright 2023-Present -The University of Texas Health Science Center at Houston |