
|
|||||
|
 | |
| |
| |
| |
| |
| |
|
Gene: CD14 |
Gene summary for CD14 |
| Gene information | Species | Human | Gene symbol | CD14 | Gene ID | 929 |
| Gene name | CD14 molecule | |
| Gene Alias | CD14 | |
| Cytomap | 5q31.3 | |
| Gene Type | protein-coding | GO ID | GO:0001816 | UniProtAcc | P08571 |
Top |
Malignant transformation analysis |
| Identification of the aberrant gene expression in precancerous and cancerous lesions by comparing the gene expression of stem-like cells in diseased tissues with normal stem cells |
| Entrez ID | Symbol | Replicates | Species | Organ | Tissue | Adj P-value | Log2FC | Malignancy |
| 929 | CD14 | LZE24T | Human | Esophagus | ESCC | 4.81e-03 | -3.50e-01 | 0.0596 |
| 929 | CD14 | P2T-E | Human | Esophagus | ESCC | 1.66e-05 | -3.75e-01 | 0.1177 |
| 929 | CD14 | P4T-E | Human | Esophagus | ESCC | 8.76e-03 | -3.03e-01 | 0.1323 |
| 929 | CD14 | P5T-E | Human | Esophagus | ESCC | 8.76e-08 | -3.66e-01 | 0.1327 |
| 929 | CD14 | P8T-E | Human | Esophagus | ESCC | 4.01e-08 | -3.59e-01 | 0.0889 |
| 929 | CD14 | P9T-E | Human | Esophagus | ESCC | 2.02e-05 | -3.39e-01 | 0.1131 |
| 929 | CD14 | P10T-E | Human | Esophagus | ESCC | 9.02e-11 | -4.09e-01 | 0.116 |
| 929 | CD14 | P12T-E | Human | Esophagus | ESCC | 1.04e-05 | -3.44e-01 | 0.1122 |
| 929 | CD14 | P16T-E | Human | Esophagus | ESCC | 4.30e-10 | -4.06e-01 | 0.1153 |
| 929 | CD14 | P22T-E | Human | Esophagus | ESCC | 2.03e-09 | -4.12e-01 | 0.1236 |
| 929 | CD14 | P23T-E | Human | Esophagus | ESCC | 1.40e-05 | -3.55e-01 | 0.108 |
| 929 | CD14 | P26T-E | Human | Esophagus | ESCC | 1.44e-08 | -3.77e-01 | 0.1276 |
| 929 | CD14 | P27T-E | Human | Esophagus | ESCC | 5.27e-08 | -3.96e-01 | 0.1055 |
| 929 | CD14 | P28T-E | Human | Esophagus | ESCC | 2.16e-05 | -3.65e-01 | 0.1149 |
| 929 | CD14 | P32T-E | Human | Esophagus | ESCC | 5.16e-08 | -4.03e-01 | 0.1666 |
| 929 | CD14 | P38T-E | Human | Esophagus | ESCC | 2.75e-04 | -2.67e-01 | 0.127 |
| 929 | CD14 | P39T-E | Human | Esophagus | ESCC | 4.12e-11 | -4.12e-01 | 0.0894 |
| 929 | CD14 | P42T-E | Human | Esophagus | ESCC | 1.42e-04 | -3.56e-01 | 0.1175 |
| 929 | CD14 | P47T-E | Human | Esophagus | ESCC | 1.65e-09 | -4.03e-01 | 0.1067 |
| 929 | CD14 | P48T-E | Human | Esophagus | ESCC | 1.15e-02 | -1.89e-01 | 0.0959 |
| Page: 1 2 3 |
| Tissue | Expression Dynamics | Abbreviation |
| Esophagus | 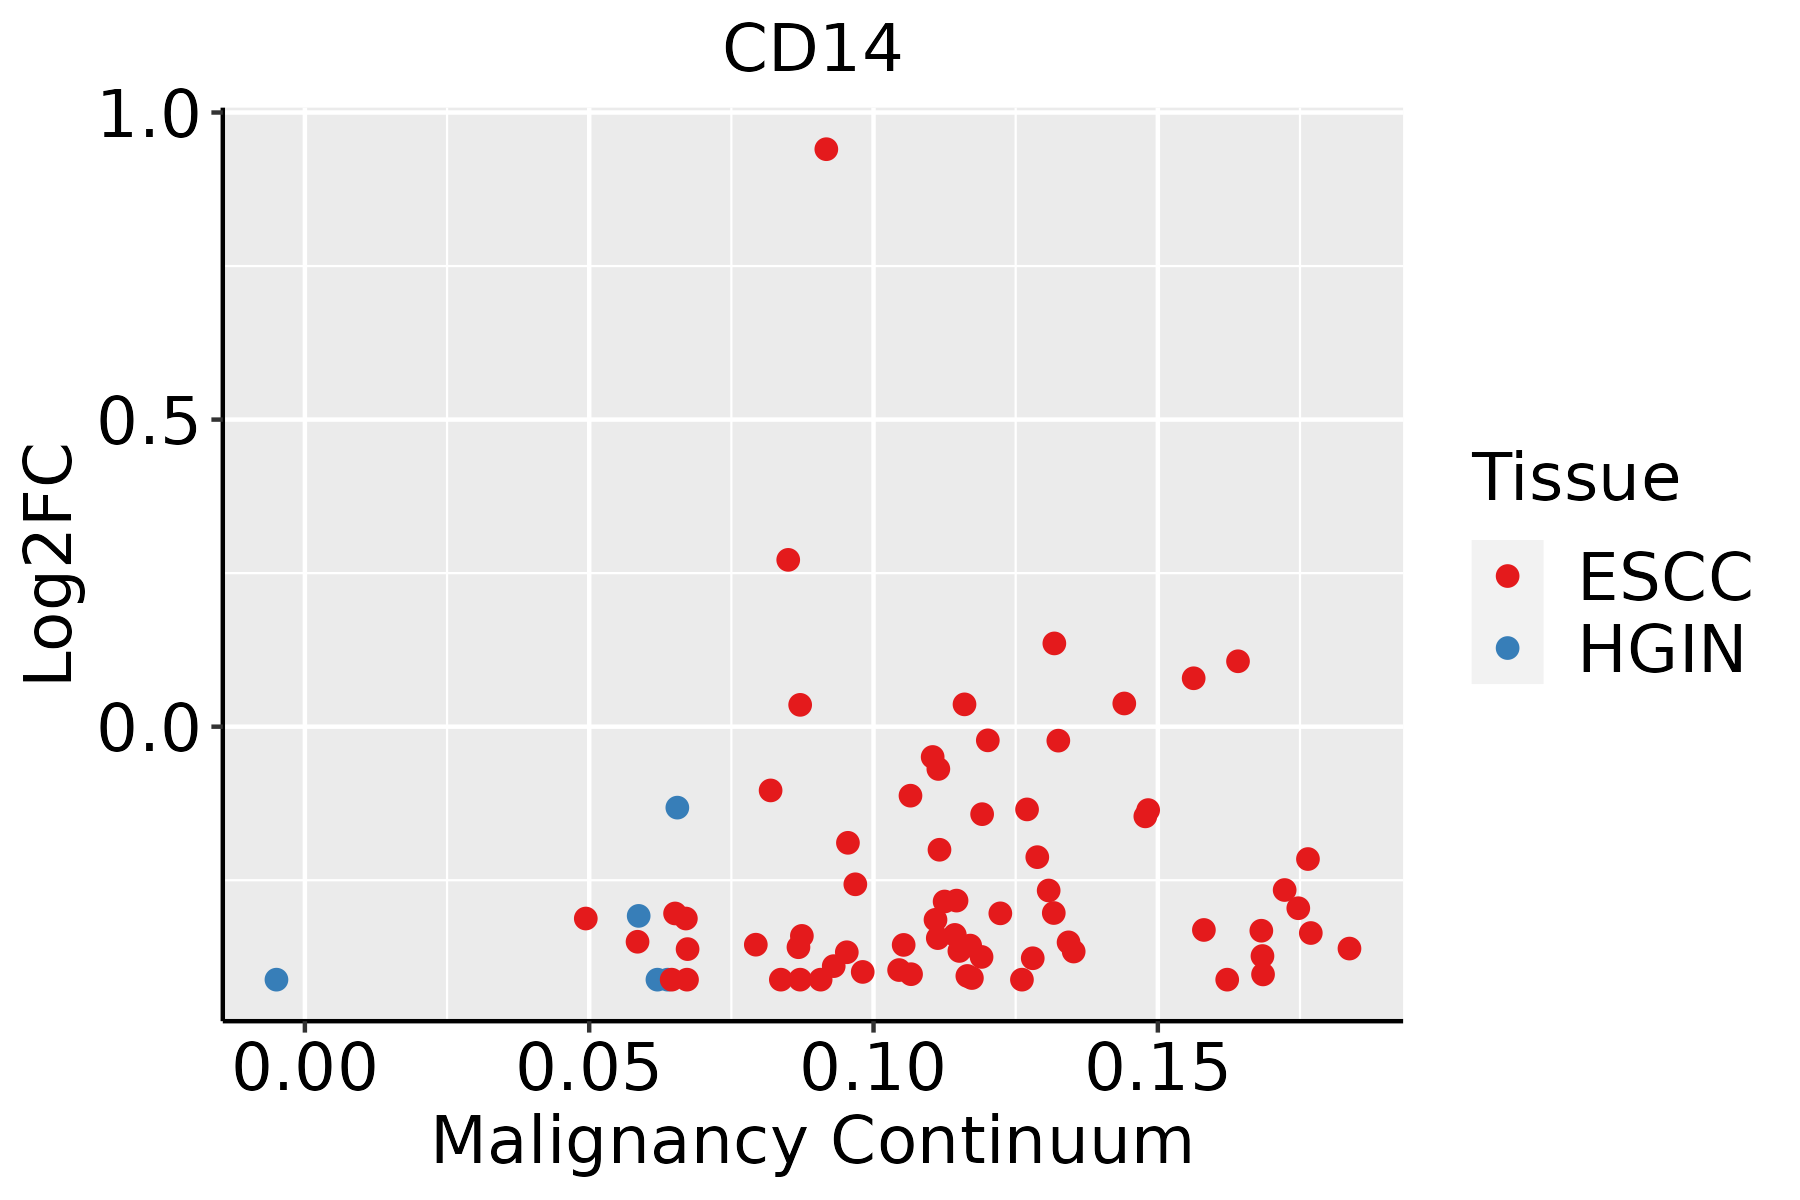 | ESCC: Esophageal squamous cell carcinoma |
| HGIN: High-grade intraepithelial neoplasias | ||
| LGIN: Low-grade intraepithelial neoplasias | ||
| Liver |  | HCC: Hepatocellular carcinoma |
| NAFLD: Non-alcoholic fatty liver disease | ||
| Oral Cavity |  | EOLP: Erosive Oral lichen planus |
| LP: leukoplakia | ||
| NEOLP: Non-erosive oral lichen planus | ||
| OSCC: Oral squamous cell carcinoma | ||
| Thyroid | 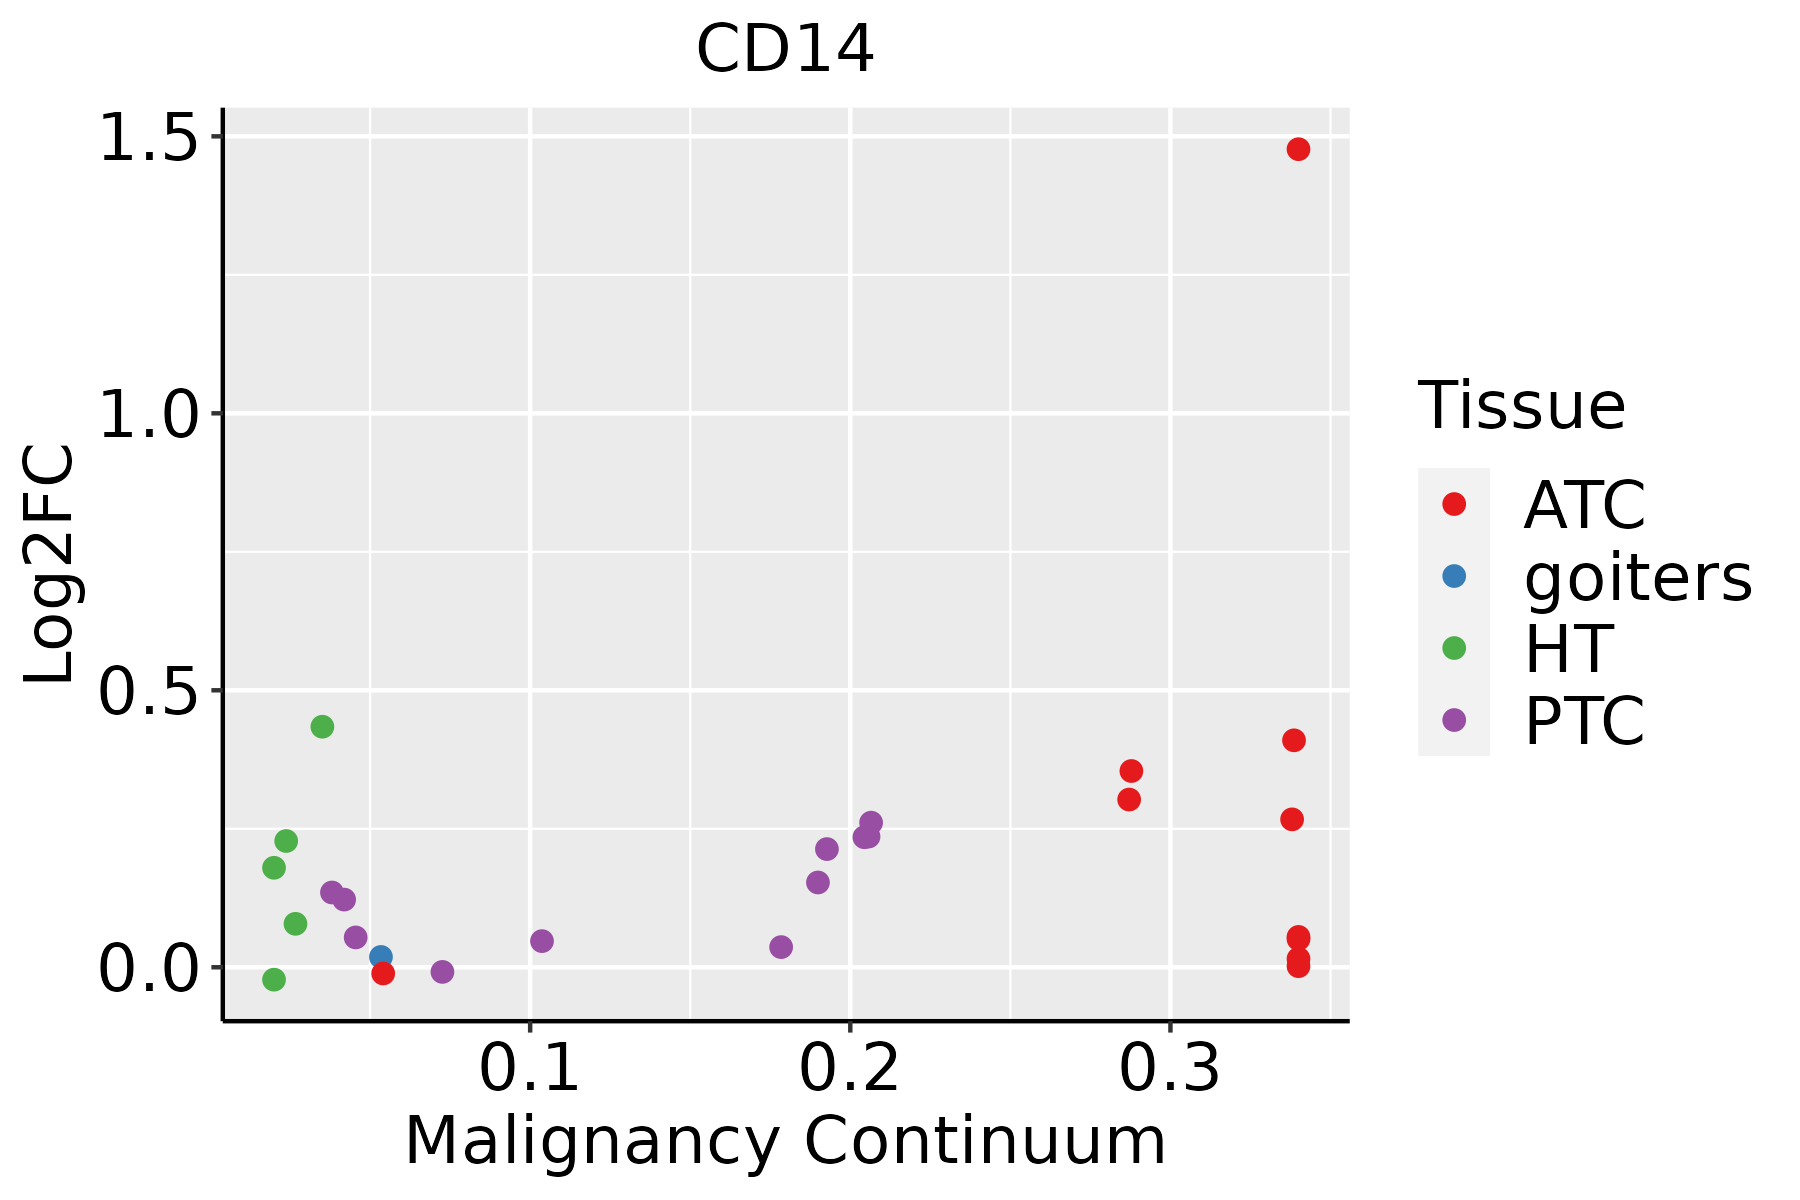 | ATC: Anaplastic thyroid cancer |
| HT: Hashimoto's thyroiditis | ||
| PTC: Papillary thyroid cancer |
| ∗log2FC in expression of this searched gene in stem-like cells from each diseased tissue sample relative to stem-like cells in normal samples in each tissue plotted against the malignancy continuum. Samples are colored based on if they are from different disease stage. |
Top |
Malignant transformation related pathway analysis |
| Find out the enriched GO biological processes and KEGG pathways involved in transition from healthy to precancer to cancer |
| Tissue | Disease Stage | Enriched GO biological Processes |
| Colorectum | AD |  |
| Colorectum | SER |  |
| Colorectum | MSS |  |
| Colorectum | MSI-H |  |
| Colorectum | FAP |  |
| ∗Top 15 enriched GO BP terms are showed in the bar plot of each disease state in each tissue. Each row represents a significant GO biological process which is colored according to the -log10(p.adjust). |
| Page: 1 2 3 4 5 6 7 8 9 |
| GO ID | Tissue | Disease Stage | Description | Gene Ratio | Bg Ratio | pvalue | p.adjust | Count |
| GO:003010018 | Esophagus | ESCC | regulation of endocytosis | 135/8552 | 211/18723 | 5.75e-08 | 1.02e-06 | 135 |
| GO:0009408110 | Esophagus | ESCC | response to heat | 77/8552 | 110/18723 | 2.01e-07 | 3.11e-06 | 77 |
| GO:004580718 | Esophagus | ESCC | positive regulation of endocytosis | 69/8552 | 100/18723 | 1.97e-06 | 2.29e-05 | 69 |
| GO:003461220 | Esophagus | ESCC | response to tumor necrosis factor | 149/8552 | 253/18723 | 1.47e-05 | 1.33e-04 | 149 |
| GO:003248112 | Esophagus | ESCC | positive regulation of type I interferon production | 42/8552 | 58/18723 | 3.27e-05 | 2.70e-04 | 42 |
| GO:001003827 | Esophagus | ESCC | response to metal ion | 208/8552 | 373/18723 | 5.02e-05 | 3.90e-04 | 208 |
| GO:000689818 | Esophagus | ESCC | receptor-mediated endocytosis | 142/8552 | 244/18723 | 5.22e-05 | 4.05e-04 | 142 |
| GO:003249619 | Esophagus | ESCC | response to lipopolysaccharide | 191/8552 | 343/18723 | 1.11e-04 | 7.73e-04 | 191 |
| GO:000926619 | Esophagus | ESCC | response to temperature stimulus | 106/8552 | 178/18723 | 1.30e-04 | 8.84e-04 | 106 |
| GO:003247912 | Esophagus | ESCC | regulation of type I interferon production | 61/8552 | 95/18723 | 2.05e-04 | 1.29e-03 | 61 |
| GO:003260612 | Esophagus | ESCC | type I interferon production | 61/8552 | 95/18723 | 2.05e-04 | 1.29e-03 | 61 |
| GO:000223719 | Esophagus | ESCC | response to molecule of bacterial origin | 194/8552 | 363/18723 | 1.64e-03 | 7.61e-03 | 194 |
| GO:190122414 | Esophagus | ESCC | positive regulation of NIK/NF-kappaB signaling | 44/8552 | 69/18723 | 1.86e-03 | 8.42e-03 | 44 |
| GO:000181916 | Esophagus | ESCC | positive regulation of cytokine production | 244/8552 | 467/18723 | 2.29e-03 | 1.01e-02 | 244 |
| GO:0097305111 | Esophagus | ESCC | response to alcohol | 138/8552 | 253/18723 | 2.70e-03 | 1.14e-02 | 138 |
| GO:00380615 | Esophagus | ESCC | NIK/NF-kappaB signaling | 81/8552 | 143/18723 | 5.33e-03 | 2.00e-02 | 81 |
| GO:007122215 | Esophagus | ESCC | cellular response to lipopolysaccharide | 113/8552 | 209/18723 | 8.79e-03 | 3.10e-02 | 113 |
| GO:00316633 | Esophagus | ESCC | lipopolysaccharide-mediated signaling pathway | 37/8552 | 60/18723 | 9.17e-03 | 3.19e-02 | 37 |
| GO:007121617 | Esophagus | ESCC | cellular response to biotic stimulus | 131/8552 | 246/18723 | 9.85e-03 | 3.39e-02 | 131 |
| GO:001003812 | Liver | Cirrhotic | response to metal ion | 150/4634 | 373/18723 | 2.27e-11 | 1.37e-09 | 150 |
| Page: 1 2 3 4 5 6 |
| Pathway ID | Tissue | Disease Stage | Description | Gene Ratio | Bg Ratio | pvalue | p.adjust | qvalue | Count |
| hsa05132211 | Esophagus | ESCC | Salmonella infection | 191/4205 | 249/8465 | 6.51e-19 | 5.45e-17 | 2.79e-17 | 191 |
| hsa05131211 | Esophagus | ESCC | Shigellosis | 176/4205 | 247/8465 | 2.27e-12 | 4.01e-11 | 2.05e-11 | 176 |
| hsa05417211 | Esophagus | ESCC | Lipid and atherosclerosis | 143/4205 | 215/8465 | 3.30e-07 | 2.45e-06 | 1.26e-06 | 143 |
| hsa0414530 | Esophagus | ESCC | Phagosome | 100/4205 | 152/8465 | 3.81e-05 | 1.72e-04 | 8.82e-05 | 100 |
| hsa052215 | Esophagus | ESCC | Acute myeloid leukemia | 49/4205 | 67/8465 | 7.43e-05 | 3.07e-04 | 1.57e-04 | 49 |
| hsa0513428 | Esophagus | ESCC | Legionellosis | 42/4205 | 57/8465 | 1.83e-04 | 6.90e-04 | 3.53e-04 | 42 |
| hsa051527 | Esophagus | ESCC | Tuberculosis | 111/4205 | 180/8465 | 7.14e-04 | 2.32e-03 | 1.19e-03 | 111 |
| hsa040645 | Esophagus | ESCC | NF-kappa B signaling pathway | 67/4205 | 104/8465 | 1.62e-03 | 4.89e-03 | 2.50e-03 | 67 |
| hsa052028 | Esophagus | ESCC | Transcriptional misregulation in cancer | 116/4205 | 193/8465 | 2.08e-03 | 5.95e-03 | 3.05e-03 | 116 |
| hsa051339 | Esophagus | ESCC | Pertussis | 48/4205 | 76/8465 | 1.21e-02 | 2.77e-02 | 1.42e-02 | 48 |
| hsa05132310 | Esophagus | ESCC | Salmonella infection | 191/4205 | 249/8465 | 6.51e-19 | 5.45e-17 | 2.79e-17 | 191 |
| hsa05131310 | Esophagus | ESCC | Shigellosis | 176/4205 | 247/8465 | 2.27e-12 | 4.01e-11 | 2.05e-11 | 176 |
| hsa05417310 | Esophagus | ESCC | Lipid and atherosclerosis | 143/4205 | 215/8465 | 3.30e-07 | 2.45e-06 | 1.26e-06 | 143 |
| hsa04145114 | Esophagus | ESCC | Phagosome | 100/4205 | 152/8465 | 3.81e-05 | 1.72e-04 | 8.82e-05 | 100 |
| hsa0522113 | Esophagus | ESCC | Acute myeloid leukemia | 49/4205 | 67/8465 | 7.43e-05 | 3.07e-04 | 1.57e-04 | 49 |
| hsa0513436 | Esophagus | ESCC | Legionellosis | 42/4205 | 57/8465 | 1.83e-04 | 6.90e-04 | 3.53e-04 | 42 |
| hsa0515212 | Esophagus | ESCC | Tuberculosis | 111/4205 | 180/8465 | 7.14e-04 | 2.32e-03 | 1.19e-03 | 111 |
| hsa0406412 | Esophagus | ESCC | NF-kappa B signaling pathway | 67/4205 | 104/8465 | 1.62e-03 | 4.89e-03 | 2.50e-03 | 67 |
| hsa0520213 | Esophagus | ESCC | Transcriptional misregulation in cancer | 116/4205 | 193/8465 | 2.08e-03 | 5.95e-03 | 3.05e-03 | 116 |
| hsa0513314 | Esophagus | ESCC | Pertussis | 48/4205 | 76/8465 | 1.21e-02 | 2.77e-02 | 1.42e-02 | 48 |
| Page: 1 2 3 4 |
Top |
Cell-cell communication analysis |
| Identification of potential cell-cell interactions between two cell types and their ligand-receptor pairs for different disease states |
| Ligand | Receptor | LRpair | Pathway | Tissue | Disease Stage |
| Page: 1 |
Top |
Single-cell gene regulatory network inference analysis |
| Find out the significant the regulons (TFs) and the target genes of each regulon across cell types for different disease states |
| TF | Cell Type | Tissue | Disease Stage | Target Gene | RSS | Regulon Activity |
| ∗The dot plots of a searched regulon are shown for all cell subpopulations in each disease state of each tissue based on the regulon specific score inferred using pySCENIC and by calculating the average expression. |
| Page: 1 |
Top |
Somatic mutation of malignant transformation related genes |
| Annotation of somatic variants for genes involved in malignant transformation |
| Hugo Symbol | Variant Class | Variant Classification | dbSNP RS | HGVSc | HGVSp | HGVSp Short | SWISSPROT | BIOTYPE | SIFT | PolyPhen | Tumor Sample Barcode | Tissue | Histology | Sex | Age | Stage | Therapy Types | Drugs | Outcome |
| CD14 | SNV | Missense_Mutation | c.887N>T | p.Pro296Leu | p.P296L | P08571 | protein_coding | deleterious(0) | probably_damaging(1) | TCGA-BH-A0EE-01 | Breast | breast invasive carcinoma | Female | >=65 | I/II | Chemotherapy | docetaxel | SD | |
| CD14 | SNV | Missense_Mutation | novel | c.248C>T | p.Ala83Val | p.A83V | P08571 | protein_coding | tolerated(1) | benign(0.025) | TCGA-C5-A902-01 | Cervix | cervical & endocervical cancer | Female | <65 | I/II | Chemotherapy | cisplatin | SD |
| CD14 | SNV | Missense_Mutation | novel | c.622N>T | p.Gly208Cys | p.G208C | P08571 | protein_coding | deleterious(0) | probably_damaging(0.987) | TCGA-EA-A3HU-01 | Cervix | cervical & endocervical cancer | Female | <65 | I/II | Unknown | Unknown | SD |
| CD14 | SNV | Missense_Mutation | rs777233725 | c.625N>A | p.Glu209Lys | p.E209K | P08571 | protein_coding | deleterious(0.03) | possibly_damaging(0.864) | TCGA-EK-A2RA-01 | Cervix | cervical & endocervical cancer | Female | >=65 | I/II | Unknown | Unknown | SD |
| CD14 | SNV | Missense_Mutation | c.406N>T | p.Pro136Ser | p.P136S | P08571 | protein_coding | tolerated(0.5) | benign(0.03) | TCGA-FU-A3HZ-01 | Cervix | cervical & endocervical cancer | Female | <65 | I/II | Chemotherapy | cisplatin | CR | |
| CD14 | SNV | Missense_Mutation | c.639N>A | p.Met213Ile | p.M213I | P08571 | protein_coding | tolerated(0.52) | benign(0) | TCGA-A6-6653-01 | Colorectum | colon adenocarcinoma | Male | >=65 | I/II | Unknown | Unknown | SD | |
| CD14 | SNV | Missense_Mutation | rs748409113 | c.1064C>T | p.Ser355Leu | p.S355L | P08571 | protein_coding | tolerated(0.2) | benign(0.02) | TCGA-AA-3680-01 | Colorectum | colon adenocarcinoma | Female | >=65 | III/IV | Chemotherapy | folinic | PD |
| CD14 | SNV | Missense_Mutation | c.439N>G | p.Leu147Val | p.L147V | P08571 | protein_coding | deleterious(0) | possibly_damaging(0.472) | TCGA-AZ-4315-01 | Colorectum | colon adenocarcinoma | Male | <65 | I/II | Unknown | Unknown | SD | |
| CD14 | SNV | Missense_Mutation | c.844A>C | p.Asn282His | p.N282H | P08571 | protein_coding | deleterious(0) | probably_damaging(0.954) | TCGA-CA-6718-01 | Colorectum | colon adenocarcinoma | Male | <65 | I/II | Unknown | Unknown | PD | |
| CD14 | SNV | Missense_Mutation | rs879447782 | c.1108G>A | p.Gly370Arg | p.G370R | P08571 | protein_coding | tolerated(0.11) | benign(0.046) | TCGA-CM-5341-01 | Colorectum | colon adenocarcinoma | Female | >=65 | III/IV | Chemotherapy | fluorouracil | SD |
| Page: 1 2 3 4 |
Top |
Related drugs of malignant transformation related genes |
| Identification of chemicals and drugs interact with genes involved in malignant transfromation |
| (DGIdb 4.0) |
| Entrez ID | Symbol | Category | Interaction Types | Drug Claim Name | Drug Name | PMIDs |
| 929 | CD14 | EXTERNAL SIDE OF PLASMA MEMBRANE, DRUGGABLE GENOME | IC14 | IC14 | ||
| 929 | CD14 | EXTERNAL SIDE OF PLASMA MEMBRANE, DRUGGABLE GENOME | inhibitor | CHEMBL2109330 | IC14 | |
| 929 | CD14 | EXTERNAL SIDE OF PLASMA MEMBRANE, DRUGGABLE GENOME | Tumor necrosis factor alpha (TNF-alpha) inhibitors | 24776844 | ||
| 929 | CD14 | EXTERNAL SIDE OF PLASMA MEMBRANE, DRUGGABLE GENOME | LOVASTATIN | LOVASTATIN | 7506029 | |
| 929 | CD14 | EXTERNAL SIDE OF PLASMA MEMBRANE, DRUGGABLE GENOME | IC14 | IC14 |
| Page: 1 |

Copyright 2023-Present -The University of Texas Health Science Center at Houston |