Schematic overview of the cellular and molecular mechanisms involved in the cancer progression, including the proposed cellular and molecular mechanisms in cancer cells trajectory. AT1: alveolar type 1 cells; AT2: alveolar type 2 cells; AAH: atypical adenomatous hyperplasia; AIS: adenocarcinoma in situ; MIA: minimally invasive adenocarcinoma; IA: invasive adenocarcinoma; EMT: epithelial-mesenchymal transition

Home

Download

Statistics

Help

Contact

Center for Computational Systems Medicine
leaf

Gene summary

leaf

Malignant transformation analysis

leaf

Malignant transformation related pathway analysis

leaf

Cell-cell communication analysis

leaf

Single-cell gene regulatory network inference analysis

leaf

Somatic mutation of malignant transformation related genes

leaf

Related drugs of malignant transformation related genes

Gene: CCT7

Gene summary for CCT7

check button Gene summary.

Gene informationSpeciesHuman
Gene symbol

CCT7

Gene ID

10574

Gene namechaperonin containing TCP1 subunit 7
Gene AliasCCTETA
Cytomap2p13.2
Gene Typeprotein-coding
GO ID

GO:0000003

UniProtAcc

Q99832


Top

Malignant transformation analysis

check button Identification of the aberrant gene expression in precancerous and cancerous lesions by comparing the gene expression of stem-like cells in diseased tissues with normal stem cells
check button Malignant transformation involving gene list.
Entrez IDSymbolReplicatesSpeciesOrganTissueAdj P-valueLog2FCMalignancy
10574CCT7HTA11_3410_2000001011HumanColorectumAD2.74e-174.82e-010.0155
10574CCT7HTA11_2487_2000001011HumanColorectumSER2.20e-074.66e-01-0.1808
10574CCT7HTA11_2951_2000001011HumanColorectumAD3.81e-056.21e-010.0216
10574CCT7HTA11_1938_2000001011HumanColorectumAD1.57e-158.98e-01-0.0811
10574CCT7HTA11_78_2000001011HumanColorectumAD2.93e-146.75e-01-0.1088
10574CCT7HTA11_347_2000001011HumanColorectumAD8.26e-225.73e-01-0.1954
10574CCT7HTA11_411_2000001011HumanColorectumSER2.82e-069.05e-01-0.2602
10574CCT7HTA11_2112_2000001011HumanColorectumSER5.97e-037.65e-01-0.2196
10574CCT7HTA11_3361_2000001011HumanColorectumAD2.32e-117.07e-01-0.1207
10574CCT7HTA11_83_2000001011HumanColorectumSER4.06e-096.39e-01-0.1526
10574CCT7HTA11_696_2000001011HumanColorectumAD1.29e-358.91e-01-0.1464
10574CCT7HTA11_866_2000001011HumanColorectumAD8.89e-215.97e-01-0.1001
10574CCT7HTA11_1391_2000001011HumanColorectumAD3.83e-341.26e+00-0.059
10574CCT7HTA11_2992_2000001011HumanColorectumSER1.63e-087.84e-01-0.1706
10574CCT7HTA11_5212_2000001011HumanColorectumAD1.61e-054.55e-01-0.2061
10574CCT7HTA11_5216_2000001011HumanColorectumSER2.17e-046.82e-01-0.1462
10574CCT7HTA11_546_2000001011HumanColorectumAD3.32e-148.60e-01-0.0842
10574CCT7HTA11_9341_2000001011HumanColorectumSER4.37e-046.51e-01-0.00410000000000005
10574CCT7HTA11_7862_2000001011HumanColorectumAD9.03e-116.75e-01-0.0179
10574CCT7HTA11_866_3004761011HumanColorectumAD2.52e-471.28e+000.096
Page: 1 2 3 4 5 6 7 8 9 10 

check button Transcriptomic changes along malignancy continuum.
TissueExpression DynamicsAbbreviation
Colorectum (GSE201348)The image shows the transcriptomic changes along malignancy continuum.log2FC in expression of this searched gene in stem-like cells from each diseased tissue sample relative to stem-like cells in normal samples in each tissue plotted against the malignancy continuum. Samples are colored based on if they are from different disease stage.FAP: Familial adenomatous polyposis
CRC: Colorectal cancer
Colorectum (HTA11)The image shows the transcriptomic changes along malignancy continuum.log2FC in expression of this searched gene in stem-like cells from each diseased tissue sample relative to stem-like cells in normal samples in each tissue plotted against the malignancy continuum. Samples are colored based on if they are from different disease stage.AD: Adenomas
SER: Sessile serrated lesions
MSI-H: Microsatellite-high colorectal cancer
MSS: Microsatellite stable colorectal cancer
EndometriumThe image shows the transcriptomic changes along malignancy continuum.log2FC in expression of this searched gene in stem-like cells from each diseased tissue sample relative to stem-like cells in normal samples in each tissue plotted against the malignancy continuum. Samples are colored based on if they are from different disease stage.
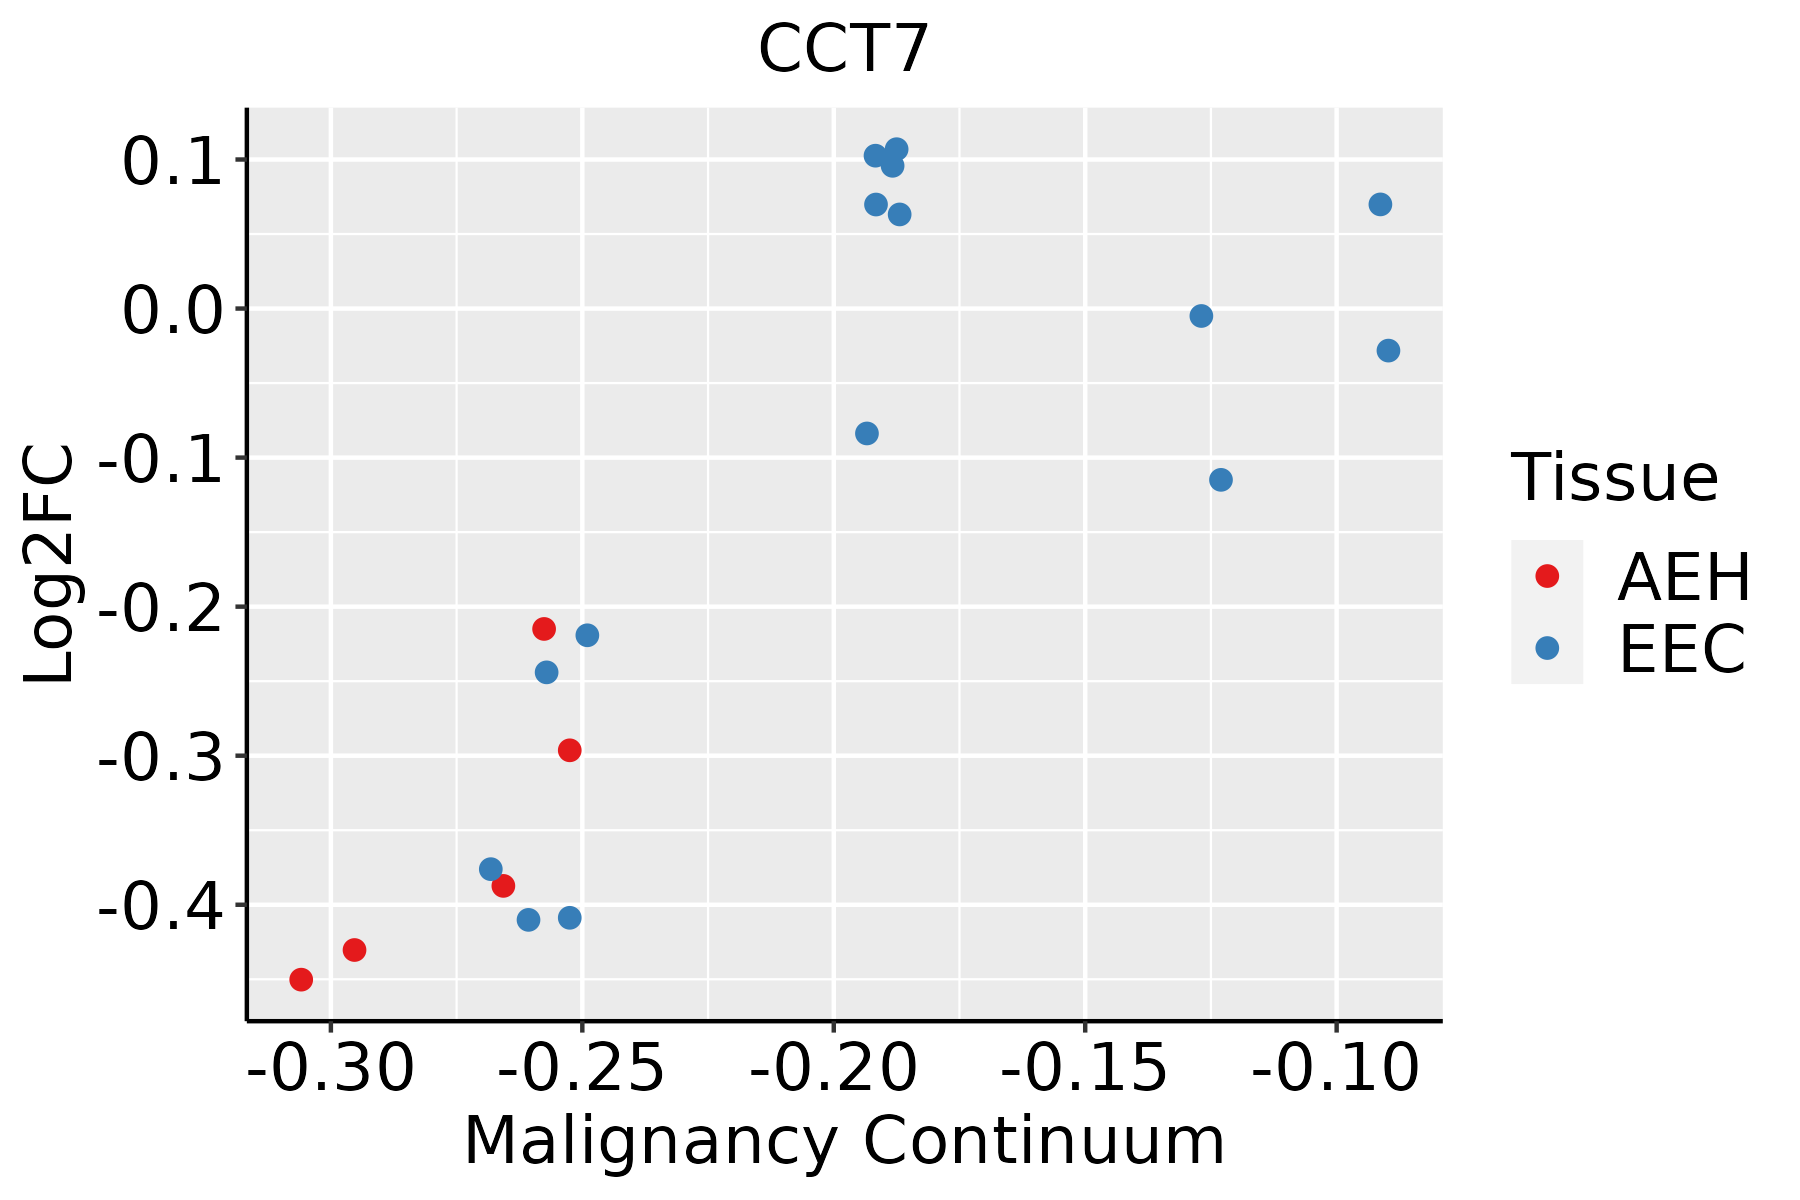
AEH: Atypical endometrial hyperplasia
EEC: Endometrioid Cancer
EsophagusThe image shows the transcriptomic changes along malignancy continuum.log2FC in expression of this searched gene in stem-like cells from each diseased tissue sample relative to stem-like cells in normal samples in each tissue plotted against the malignancy continuum. Samples are colored based on if they are from different disease stage.
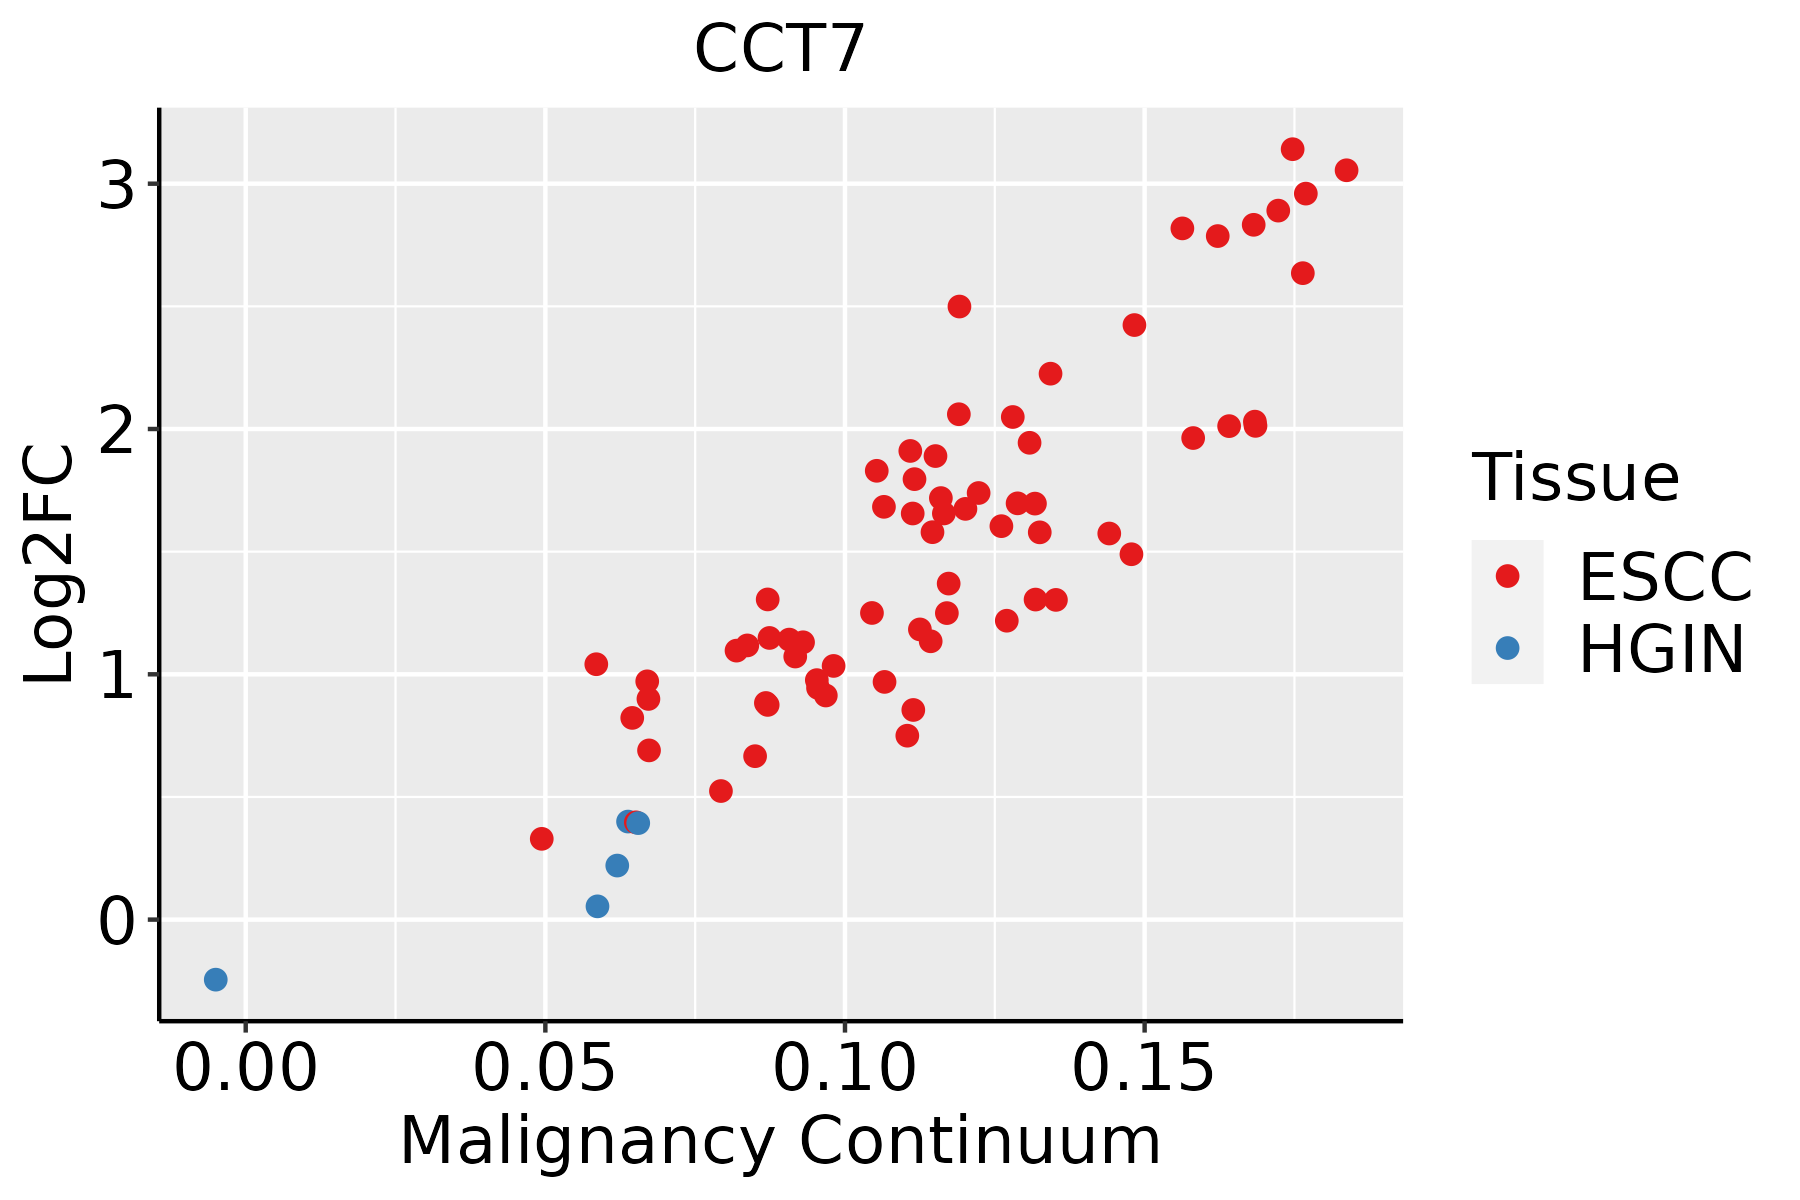
ESCC: Esophageal squamous cell carcinoma
HGIN: High-grade intraepithelial neoplasias
LGIN: Low-grade intraepithelial neoplasias
LiverThe image shows the transcriptomic changes along malignancy continuum.log2FC in expression of this searched gene in stem-like cells from each diseased tissue sample relative to stem-like cells in normal samples in each tissue plotted against the malignancy continuum. Samples are colored based on if they are from different disease stage.
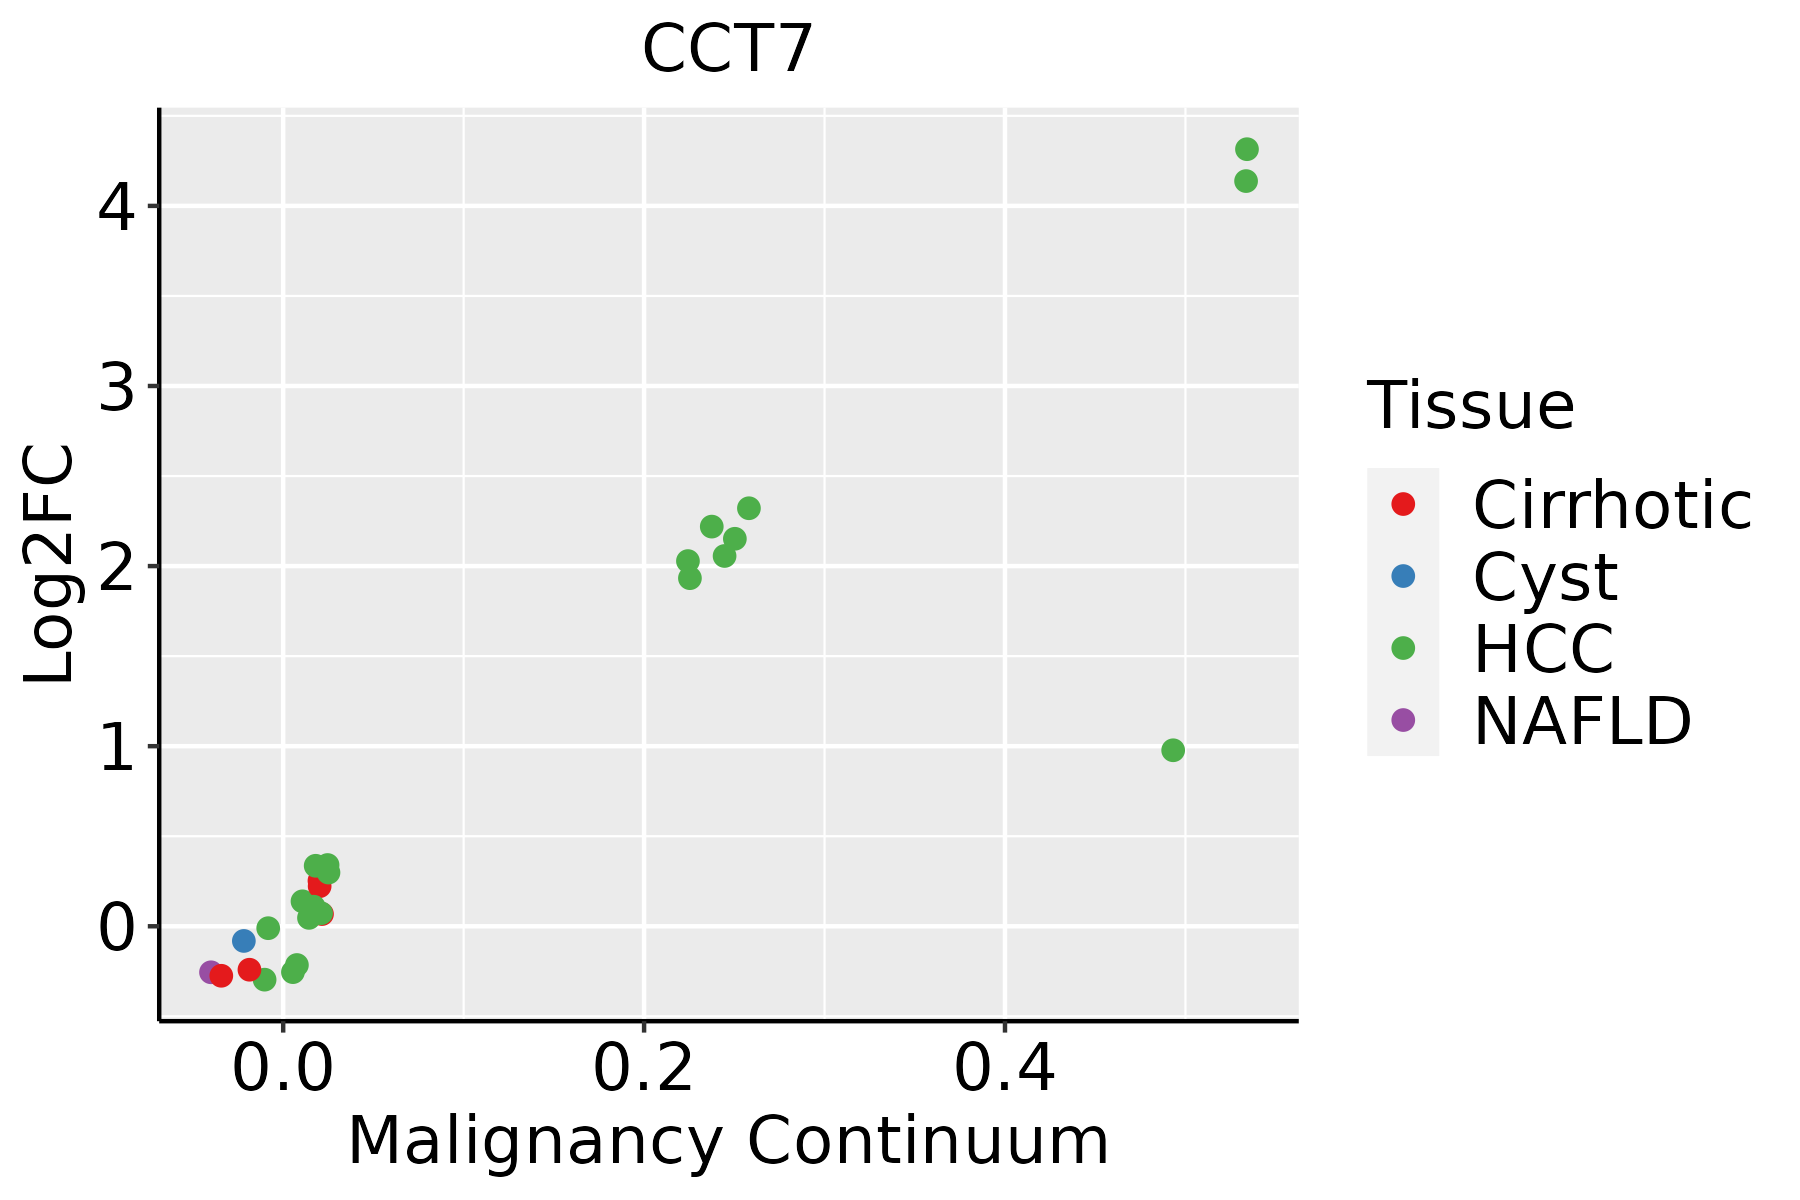
HCC: Hepatocellular carcinoma
NAFLD: Non-alcoholic fatty liver disease
Oral CavityThe image shows the transcriptomic changes along malignancy continuum.log2FC in expression of this searched gene in stem-like cells from each diseased tissue sample relative to stem-like cells in normal samples in each tissue plotted against the malignancy continuum. Samples are colored based on if they are from different disease stage.
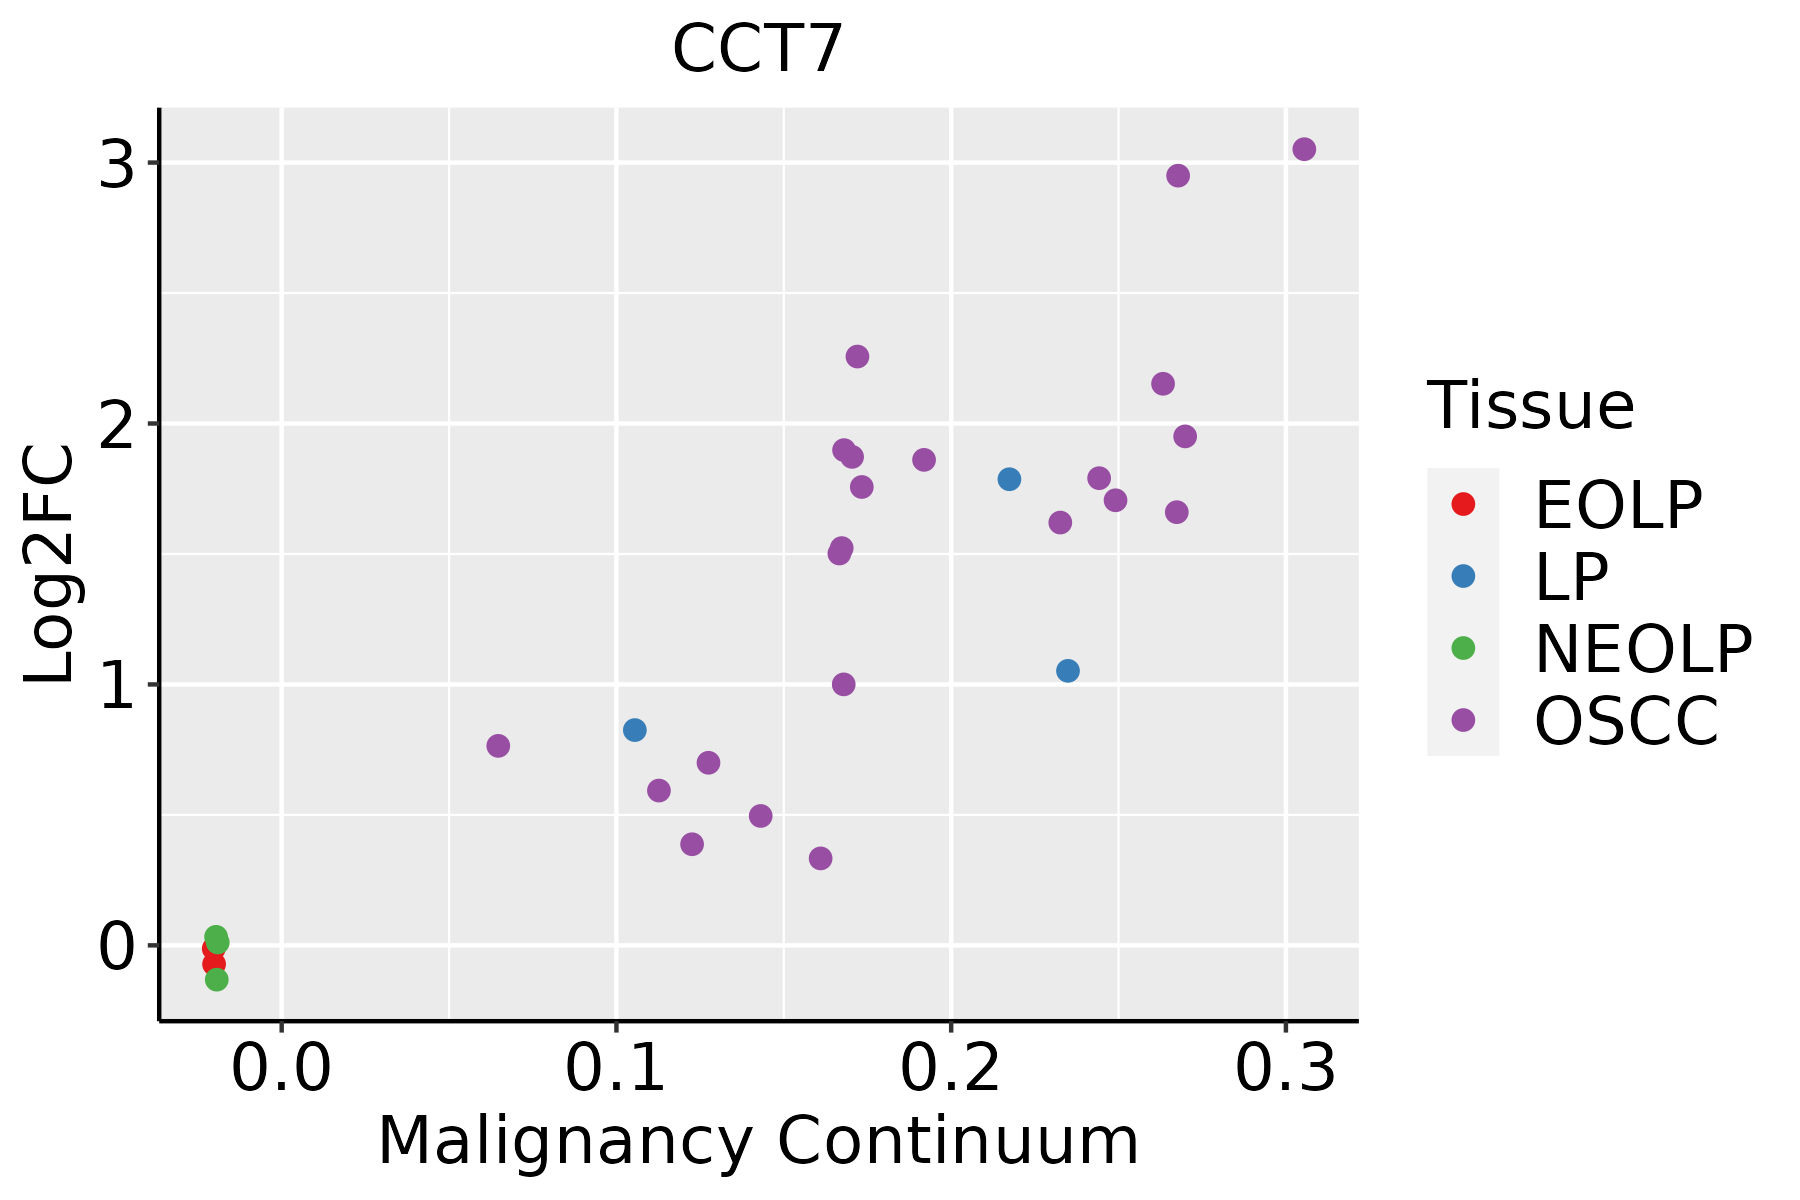
EOLP: Erosive Oral lichen planus
LP: leukoplakia
NEOLP: Non-erosive oral lichen planus
OSCC: Oral squamous cell carcinoma
ProstateThe image shows the transcriptomic changes along malignancy continuum.log2FC in expression of this searched gene in stem-like cells from each diseased tissue sample relative to stem-like cells in normal samples in each tissue plotted against the malignancy continuum. Samples are colored based on if they are from different disease stage.
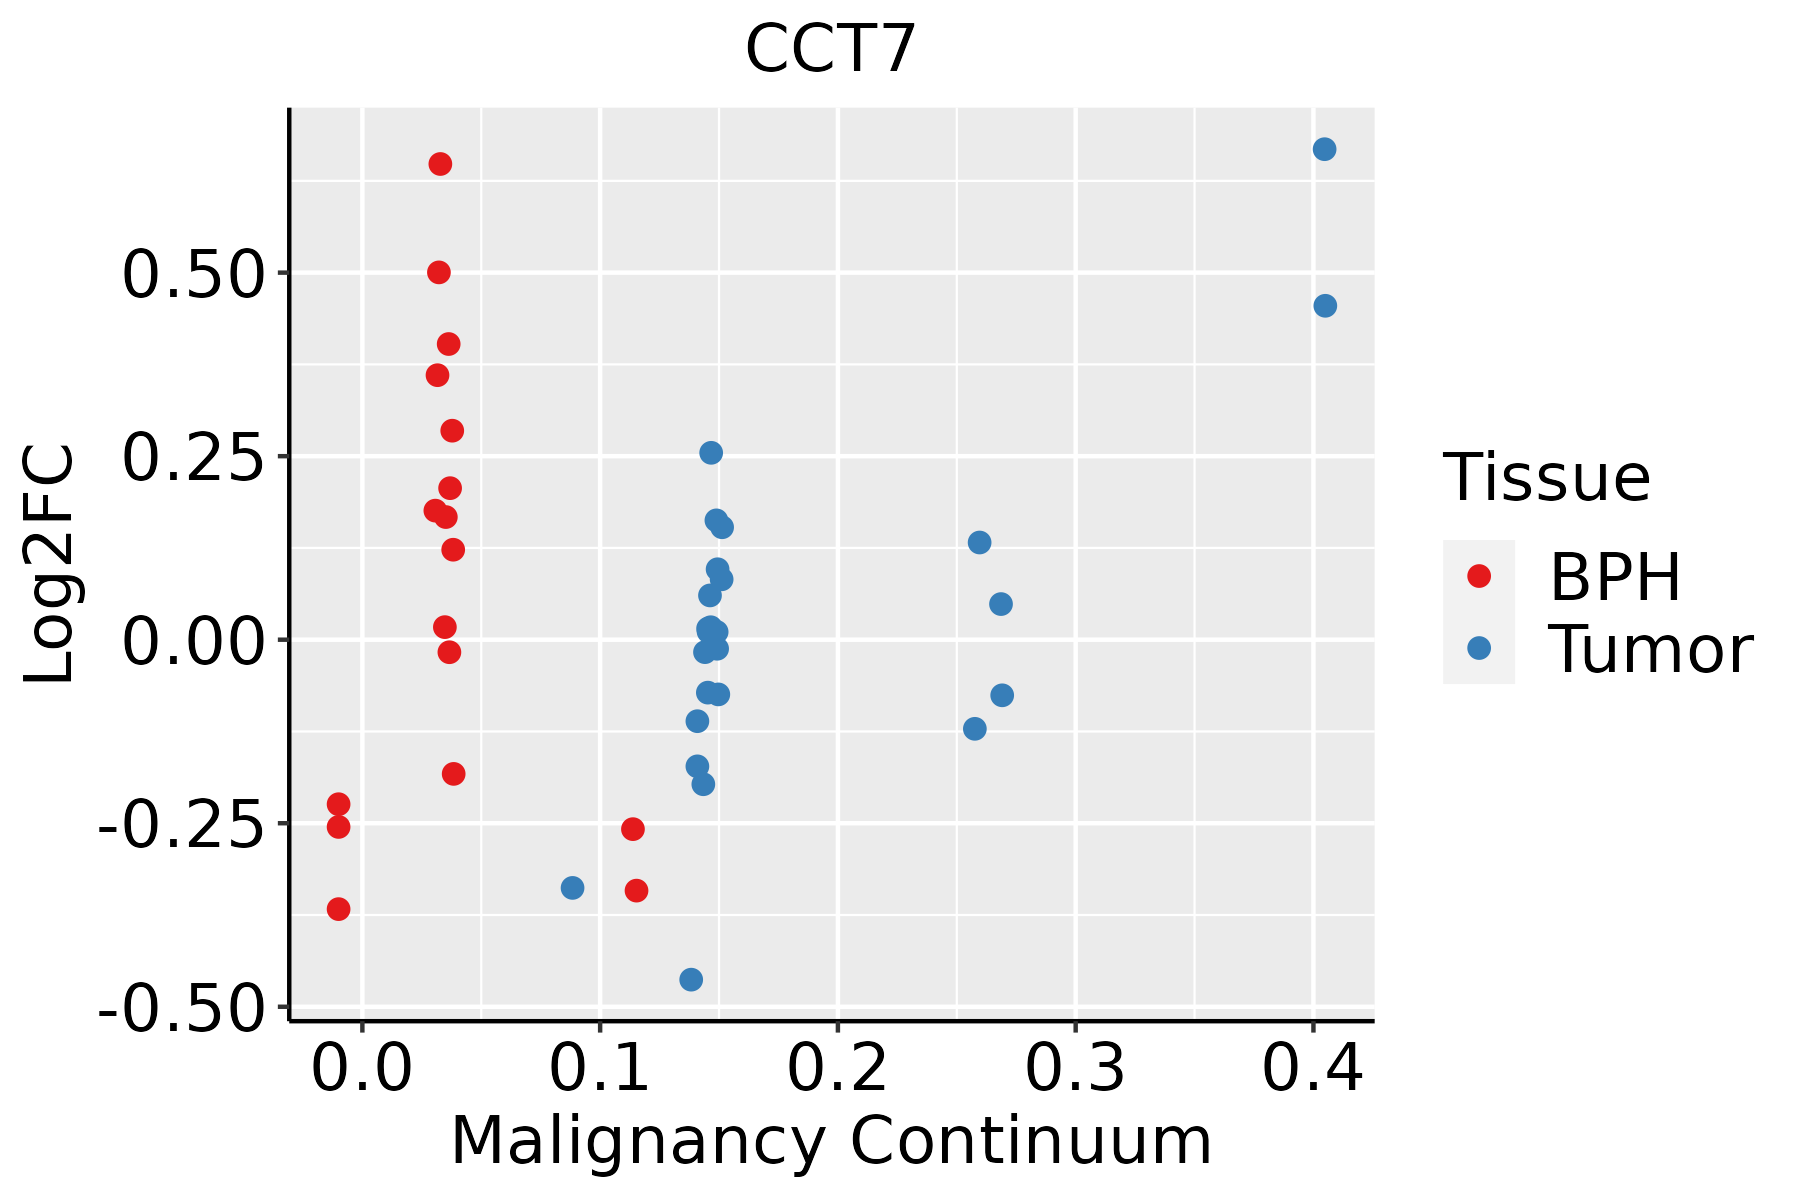
BPH: Benign Prostatic Hyperplasia
SkinThe image shows the transcriptomic changes along malignancy continuum.log2FC in expression of this searched gene in stem-like cells from each diseased tissue sample relative to stem-like cells in normal samples in each tissue plotted against the malignancy continuum. Samples are colored based on if they are from different disease stage.AK: Actinic keratosis
cSCC: Cutaneous squamous cell carcinoma
SCCIS:squamous cell carcinoma in situ
ThyroidThe image shows the transcriptomic changes along malignancy continuum.log2FC in expression of this searched gene in stem-like cells from each diseased tissue sample relative to stem-like cells in normal samples in each tissue plotted against the malignancy continuum. Samples are colored based on if they are from different disease stage.ATC: Anaplastic thyroid cancer
HT: Hashimoto's thyroiditis
PTC: Papillary thyroid cancer
∗log2FC in expression of this searched gene in stem-like cells from each diseased tissue sample relative to stem-like cells in normal samples in each tissue plotted against the malignancy continuum. Samples are colored based on if they are from different disease stage.

Top

Malignant transformation related pathway analysis

check buttonFind out the enriched GO biological processes and KEGG pathways involved in transition from healthy to precancer to cancer
check button Figure of enriched GO biological processes.
TissueDisease StageEnriched GO biological Processes
ColorectumADGO analysis - Figure of enriched GO biological processes: Top 15 enriched GO BP terms are showed in the bar plot of each disease state in each tissue. Each row represents a significant GO biological process which is colored according to the -log10(p.adjust).
ColorectumSERGO analysis - Figure of enriched GO biological processes: Top 15 enriched GO BP terms are showed in the bar plot of each disease state in each tissue. Each row represents a significant GO biological process which is colored according to the -log10(p.adjust).
ColorectumMSSGO analysis - Figure of enriched GO biological processes: Top 15 enriched GO BP terms are showed in the bar plot of each disease state in each tissue. Each row represents a significant GO biological process which is colored according to the -log10(p.adjust).
ColorectumMSI-HGO analysis - Figure of enriched GO biological processes: Top 15 enriched GO BP terms are showed in the bar plot of each disease state in each tissue. Each row represents a significant GO biological process which is colored according to the -log10(p.adjust).
ColorectumFAPGO analysis - Figure of enriched GO biological processes: Top 15 enriched GO BP terms are showed in the bar plot of each disease state in each tissue. Each row represents a significant GO biological process which is colored according to the -log10(p.adjust).
∗Top 15 enriched GO BP terms are showed in the bar plot of each disease state in each tissue. Each row represents a significant GO biological process which is colored according to the -log10(p.adjust).
Page: 1 2 3 4 5 6 7 8 9 

check button Enriched GO biological processes.
GO IDTissueDisease StageDescriptionGene RatioBg Ratiopvaluep.adjustCount
GO:1903829ColorectumADpositive regulation of cellular protein localization110/3918276/187234.58e-138.44e-11110
GO:0072594ColorectumADestablishment of protein localization to organelle148/3918422/187237.95e-121.04e-09148
GO:0031647ColorectumADregulation of protein stability108/3918298/187236.33e-105.08e-08108
GO:1904951ColorectumADpositive regulation of establishment of protein localization112/3918319/187232.55e-091.80e-07112
GO:0050821ColorectumADprotein stabilization73/3918191/187233.02e-081.64e-0673
GO:1900180ColorectumADregulation of protein localization to nucleus55/3918136/187231.70e-077.34e-0655
GO:0051052ColorectumADregulation of DNA metabolic process116/3918359/187232.47e-071.00e-05116
GO:0051054ColorectumADpositive regulation of DNA metabolic process73/3918201/187233.27e-071.29e-0573
GO:1900182ColorectumADpositive regulation of protein localization to nucleus38/391887/187231.43e-064.52e-0538
GO:0006403ColorectumADRNA localization71/3918201/187231.54e-064.76e-0571
GO:0034504ColorectumADprotein localization to nucleus94/3918290/187232.83e-068.09e-0594
GO:0006457ColorectumADprotein folding73/3918212/187233.24e-069.10e-0573
GO:2001252ColorectumADpositive regulation of chromosome organization35/391882/187236.90e-061.72e-0435
GO:2000278ColorectumADregulation of DNA biosynthetic process41/3918106/187232.17e-054.33e-0441
GO:2000573ColorectumADpositive regulation of DNA biosynthetic process28/391866/187236.35e-051.05e-0328
GO:0032206ColorectumADpositive regulation of telomere maintenance23/391852/187231.31e-041.88e-0323
GO:0032204ColorectumADregulation of telomere maintenance31/391880/187232.01e-042.67e-0331
GO:0033044ColorectumADregulation of chromosome organization60/3918187/187232.25e-042.94e-0360
GO:0000723ColorectumADtelomere maintenance43/3918131/187239.77e-049.20e-0343
GO:0010833ColorectumADtelomere maintenance via telomere lengthening29/391881/187231.42e-031.22e-0229
Page: 1 2 3 4 5 6 7 8 9 10 11 12 13 14 15 16 17 18 19 20 21 22 23 24 25 26 27 28 29 30 31 32 33 34 35 36 37 

check button Enriched KEGG pathways.
Pathway IDTissueDisease StageDescriptionGene RatioBg Ratiopvaluep.adjustqvalueCount
Page: 1 

Top

Cell-cell communication analysis

check buttonIdentification of potential cell-cell interactions between two cell types and their ligand-receptor pairs for different disease states
LigandReceptorLRpairPathwayTissueDisease Stage
Page: 1 

Top

Single-cell gene regulatory network inference analysis

check buttonFind out the significant the regulons (TFs) and the target genes of each regulon across cell types for different disease states
TFCell TypeTissueDisease StageTarget GeneRSSRegulon Activity
∗The dot plots of a searched regulon are shown for all cell subpopulations in each disease state of each tissue based on the regulon specific score inferred using pySCENIC and by calculating the average expression.
Page: 1 

Top

Somatic mutation of malignant transformation related genes

check buttonAnnotation of somatic variants for genes involved in malignant transformation
Hugo SymbolVariant ClassVariant ClassificationdbSNP RSHGVScHGVSpHGVSp ShortSWISSPROTBIOTYPESIFTPolyPhenTumor Sample BarcodeTissueHistologySexAgeStageTherapy TypesDrugsOutcome
CCT7SNVMissense_Mutationnovelc.938G>Cp.Arg313Prop.R313PQ99832protein_codingdeleterious(0.01)probably_damaging(0.973)TCGA-A2-A3XV-01Breastbreast invasive carcinomaFemale<65I/IIChemotherapycarboplatinCR
CCT7SNVMissense_Mutationc.667N>Cp.Ala223Prop.A223PQ99832protein_codingtolerated(0.07)probably_damaging(0.997)TCGA-A8-A09Z-01Breastbreast invasive carcinomaFemale>=65I/IIUnknownUnknownSD
CCT7SNVMissense_Mutationrs541718985c.1339N>Tp.Arg447Cysp.R447CQ99832protein_codingdeleterious(0)benign(0.12)TCGA-AR-A1AJ-01Breastbreast invasive carcinomaFemale>=65I/IIUnknownUnknownSD
CCT7SNVMissense_Mutationnovelc.256N>Ap.Gln86Lysp.Q86KQ99832protein_codingdeleterious(0)probably_damaging(0.999)TCGA-BH-A1FU-01Breastbreast invasive carcinomaFemale<65I/IIUnknownUnknownPD
CCT7SNVMissense_Mutationnovelc.257N>Tp.Gln86Leup.Q86LQ99832protein_codingdeleterious(0)probably_damaging(0.999)TCGA-BH-A1FU-01Breastbreast invasive carcinomaFemale<65I/IIUnknownUnknownPD
CCT7insertionFrame_Shift_Insnovelc.117_118insTp.Leu40SerfsTer21p.L40Sfs*21Q99832protein_codingTCGA-BH-A0E7-01Breastbreast invasive carcinomaFemale>=65I/IIHormone TherapyarimidexSD
CCT7insertionFrame_Shift_Insnovelc.118_119insAAGCTCTTGGCATCTTGCATTTp.Leu40GlnfsTer28p.L40Qfs*28Q99832protein_codingTCGA-BH-A0E7-01Breastbreast invasive carcinomaFemale>=65I/IIHormone TherapyarimidexSD
CCT7SNVMissense_Mutationnovelc.1242N>Cp.Met414Ilep.M414IQ99832protein_codingdeleterious(0.04)possibly_damaging(0.744)TCGA-AA-A01D-01Colorectumcolon adenocarcinomaFemale<65III/IVChemotherapycapecitabinePD
CCT7SNVMissense_Mutationc.779N>Cp.Val260Alap.V260AQ99832protein_codingtolerated(0.18)possibly_damaging(0.672)TCGA-F5-6811-01Colorectumrectum adenocarcinomaFemale>=65I/IIUnknownUnknownSD
CCT7SNVMissense_Mutationnovelc.656N>Tp.Thr219Ilep.T219IQ99832protein_codingdeleterious(0)probably_damaging(0.984)TCGA-A5-A0G1-01Endometriumuterine corpus endometrioid carcinomaFemale>=65I/IIUnknownUnknownSD
Page: 1 2 3 4 5 

Top

Related drugs of malignant transformation related genes

check buttonIdentification of chemicals and drugs interact with genes involved in malignant transfromation
(DGIdb 4.0)
Entrez IDSymbolCategoryInteraction TypesDrug Claim NameDrug NamePMIDs
Page: 1