
|
|||||
|
 | |
| |
| |
| |
| |
| |
|
Gene: CCT2 |
Gene summary for CCT2 |
| Gene information | Species | Human | Gene symbol | CCT2 | Gene ID | 10576 |
| Gene name | chaperonin containing TCP1 subunit 2 | |
| Gene Alias | 99D8.1 | |
| Cytomap | 12q15 | |
| Gene Type | protein-coding | GO ID | GO:0000003 | UniProtAcc | P78371 |
Top |
Malignant transformation analysis |
| Identification of the aberrant gene expression in precancerous and cancerous lesions by comparing the gene expression of stem-like cells in diseased tissues with normal stem cells |
| Entrez ID | Symbol | Replicates | Species | Organ | Tissue | Adj P-value | Log2FC | Malignancy |
| 10576 | CCT2 | GSM4909285 | Human | Breast | IDC | 7.99e-10 | 3.74e-01 | 0.21 |
| 10576 | CCT2 | GSM4909288 | Human | Breast | IDC | 3.04e-02 | -9.84e-02 | 0.0988 |
| 10576 | CCT2 | GSM4909291 | Human | Breast | IDC | 6.18e-87 | 1.31e+00 | 0.1753 |
| 10576 | CCT2 | GSM4909296 | Human | Breast | IDC | 3.05e-10 | -2.24e-01 | 0.1524 |
| 10576 | CCT2 | GSM4909297 | Human | Breast | IDC | 2.55e-13 | -2.03e-01 | 0.1517 |
| 10576 | CCT2 | GSM4909301 | Human | Breast | IDC | 3.50e-03 | -1.87e-01 | 0.1577 |
| 10576 | CCT2 | GSM4909311 | Human | Breast | IDC | 2.11e-29 | -3.18e-01 | 0.1534 |
| 10576 | CCT2 | GSM4909312 | Human | Breast | IDC | 2.57e-11 | -1.88e-01 | 0.1552 |
| 10576 | CCT2 | GSM4909317 | Human | Breast | IDC | 3.86e-02 | 2.65e-01 | 0.1355 |
| 10576 | CCT2 | GSM4909319 | Human | Breast | IDC | 5.48e-35 | -3.64e-01 | 0.1563 |
| 10576 | CCT2 | GSM4909320 | Human | Breast | IDC | 4.80e-15 | 5.44e-01 | 0.1575 |
| 10576 | CCT2 | GSM4909321 | Human | Breast | IDC | 8.17e-46 | 7.46e-01 | 0.1559 |
| 10576 | CCT2 | brca1 | Human | Breast | Precancer | 3.87e-09 | 4.08e-01 | -0.0338 |
| 10576 | CCT2 | brca2 | Human | Breast | Precancer | 2.58e-02 | 2.66e-01 | -0.024 |
| 10576 | CCT2 | brca3 | Human | Breast | Precancer | 1.98e-03 | 3.06e-01 | -0.0263 |
| 10576 | CCT2 | NCCBC14 | Human | Breast | DCIS | 8.67e-05 | -6.31e-02 | 0.2021 |
| 10576 | CCT2 | NCCBC5 | Human | Breast | DCIS | 7.11e-08 | 1.17e-02 | 0.2046 |
| 10576 | CCT2 | P1 | Human | Breast | IDC | 4.23e-12 | -2.62e-01 | 0.1527 |
| 10576 | CCT2 | DCIS2 | Human | Breast | DCIS | 4.29e-57 | 2.82e-01 | 0.0085 |
| 10576 | CCT2 | HTA11_3410_2000001011 | Human | Colorectum | AD | 6.17e-08 | 3.20e-01 | 0.0155 |
| Page: 1 2 3 4 5 6 7 8 9 10 11 |
| Tissue | Expression Dynamics | Abbreviation |
| Breast | 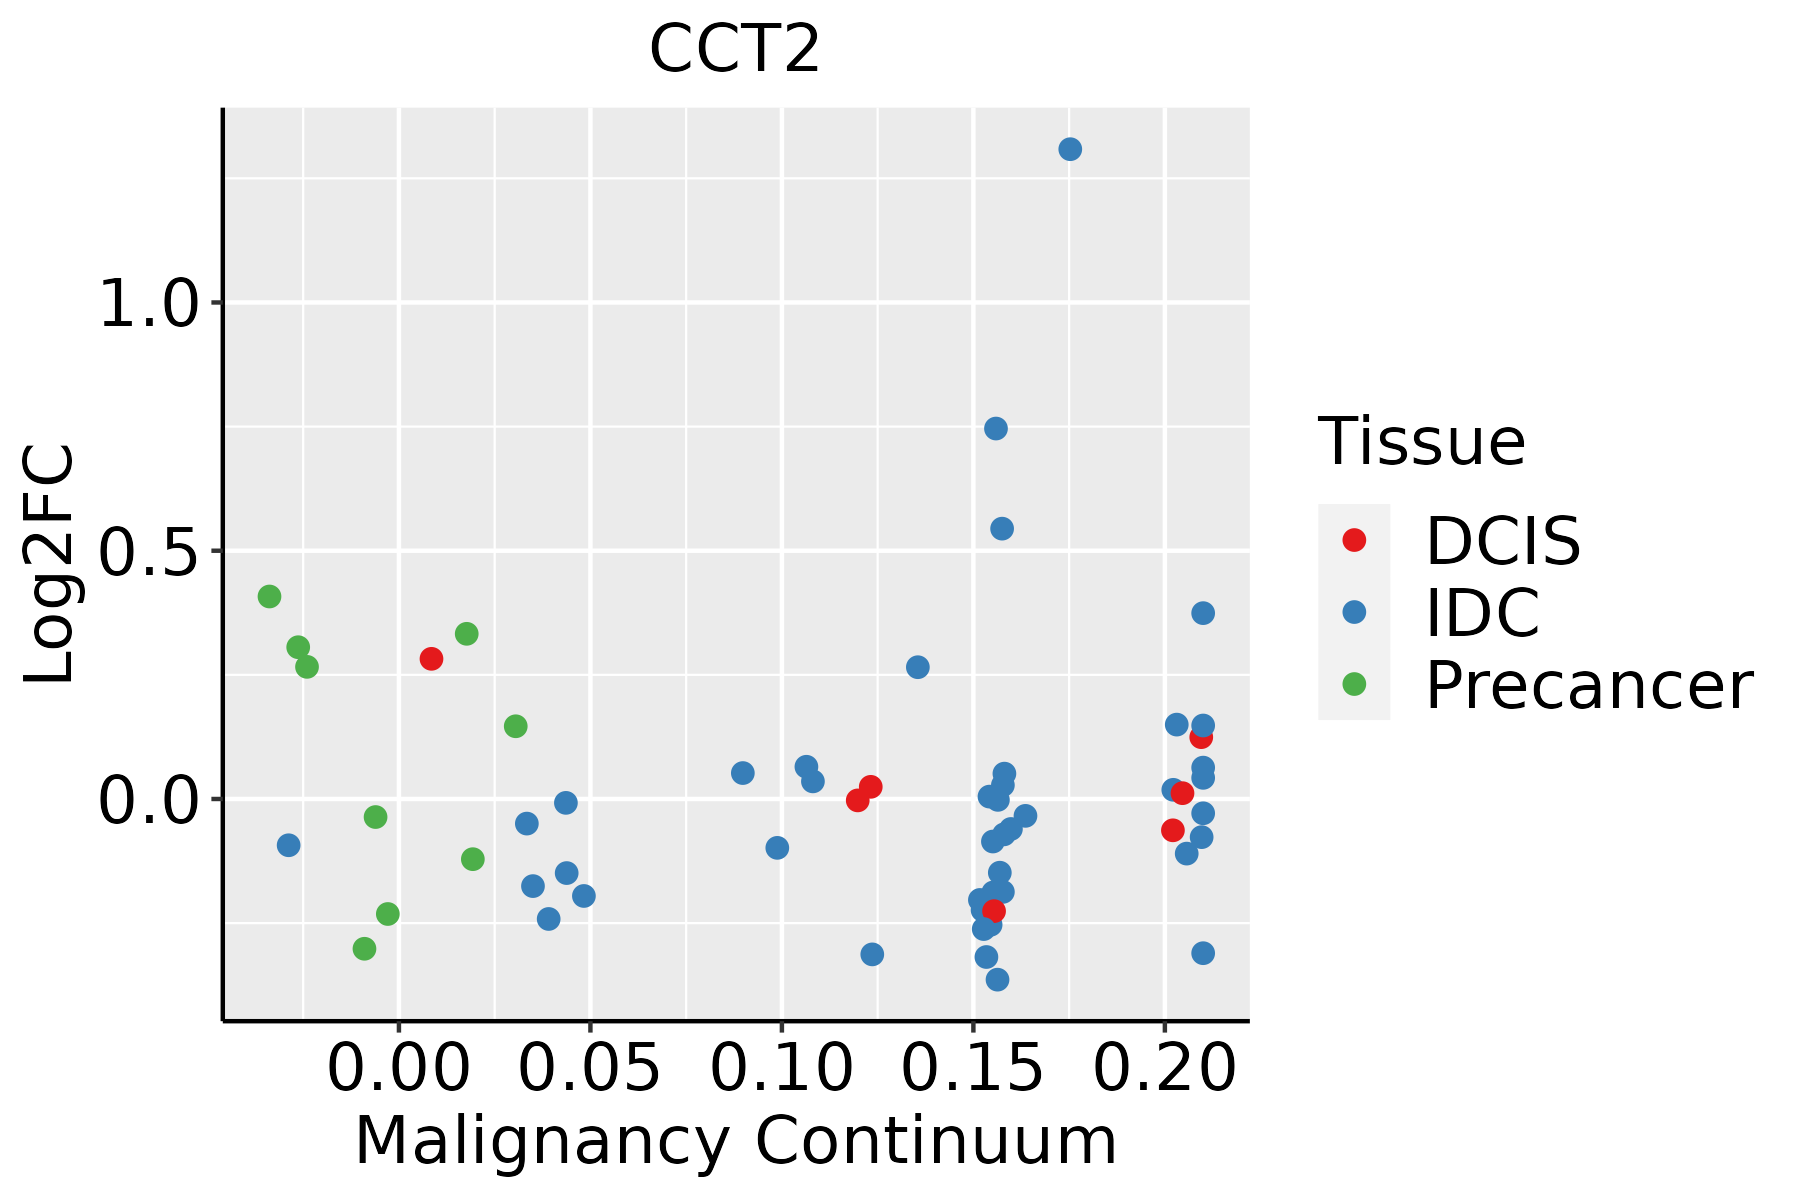 | IDC: Invasive ductal carcinoma |
| DCIS: Ductal carcinoma in situ | ||
| Precancer(BRCA1-mut): Precancerous lesion from BRCA1 mutation carriers | ||
| Colorectum (GSE201348) |  | FAP: Familial adenomatous polyposis |
| CRC: Colorectal cancer | ||
| Colorectum (HTA11) |  | AD: Adenomas |
| SER: Sessile serrated lesions | ||
| MSI-H: Microsatellite-high colorectal cancer | ||
| MSS: Microsatellite stable colorectal cancer | ||
| Endometrium | 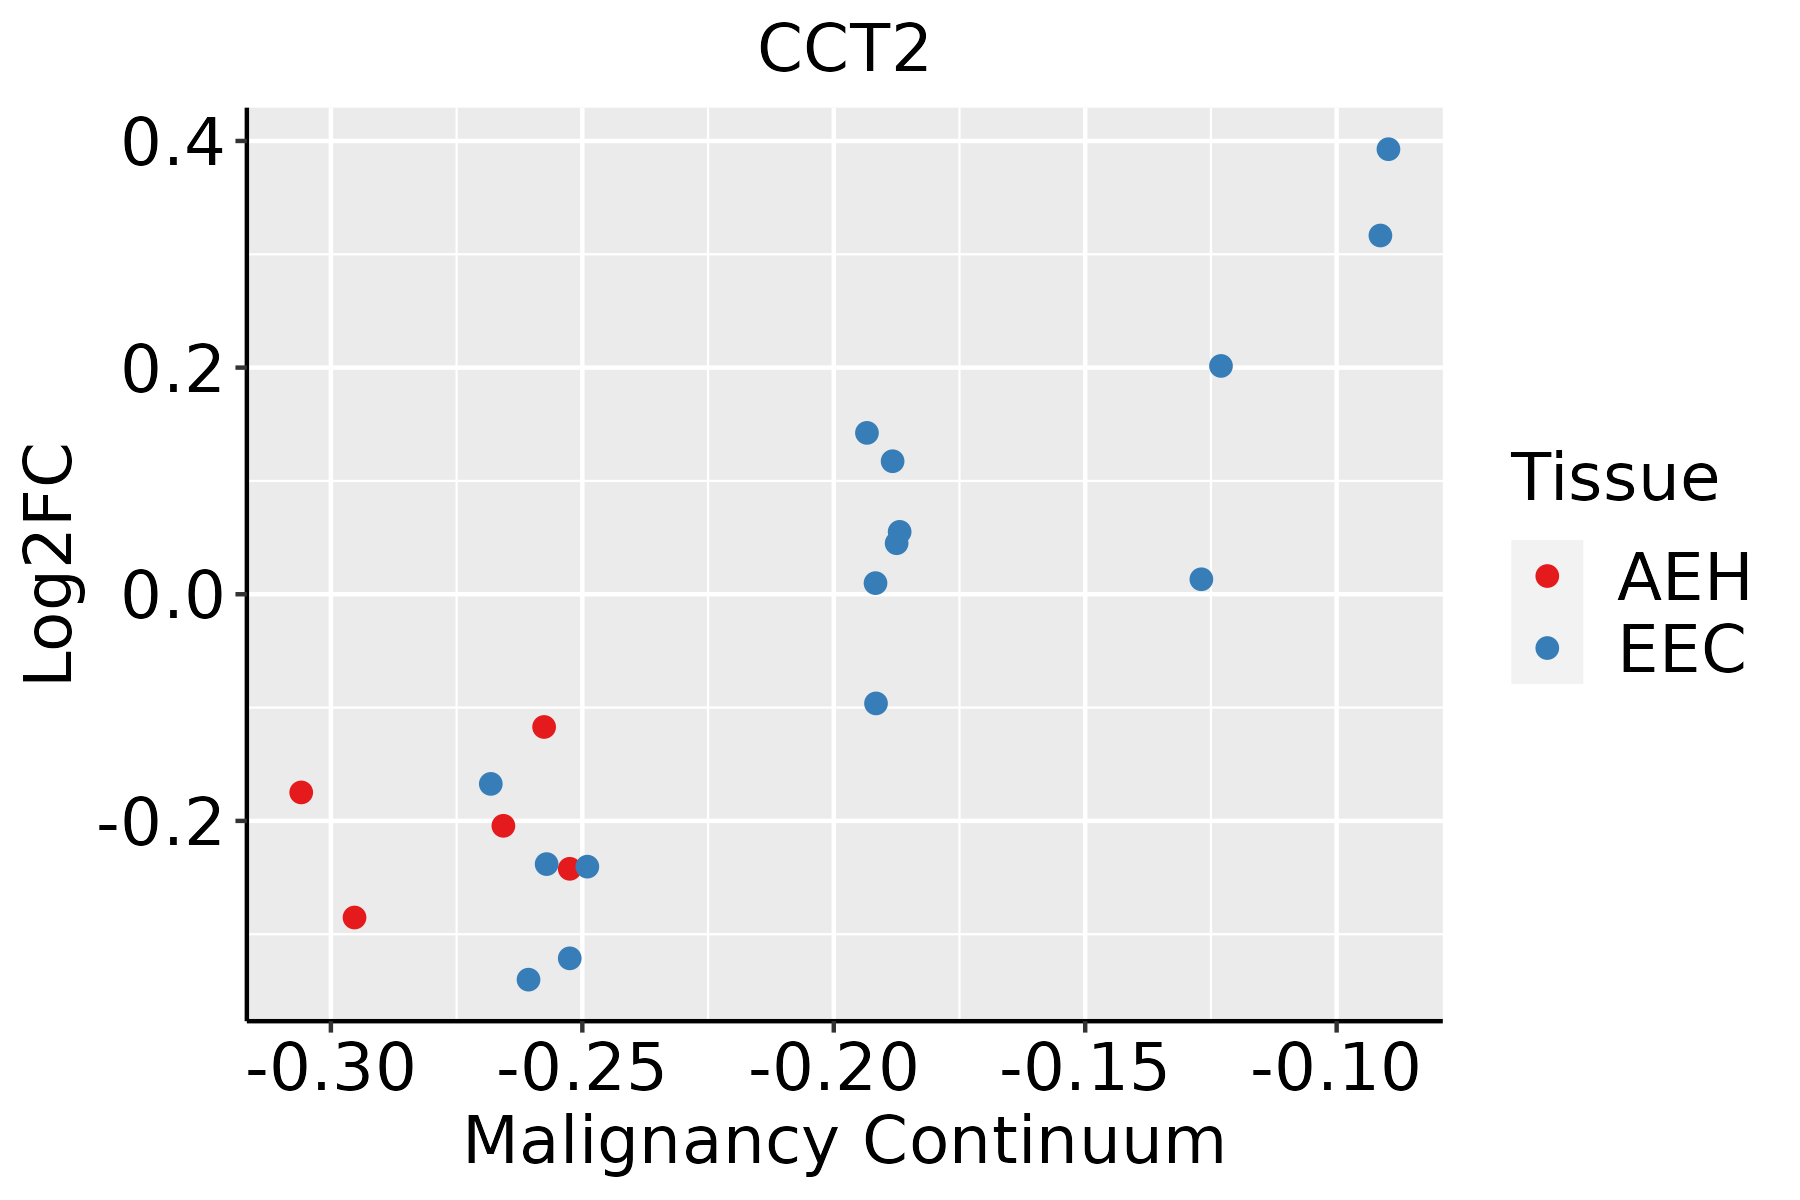 | AEH: Atypical endometrial hyperplasia |
| EEC: Endometrioid Cancer | ||
| Esophagus | 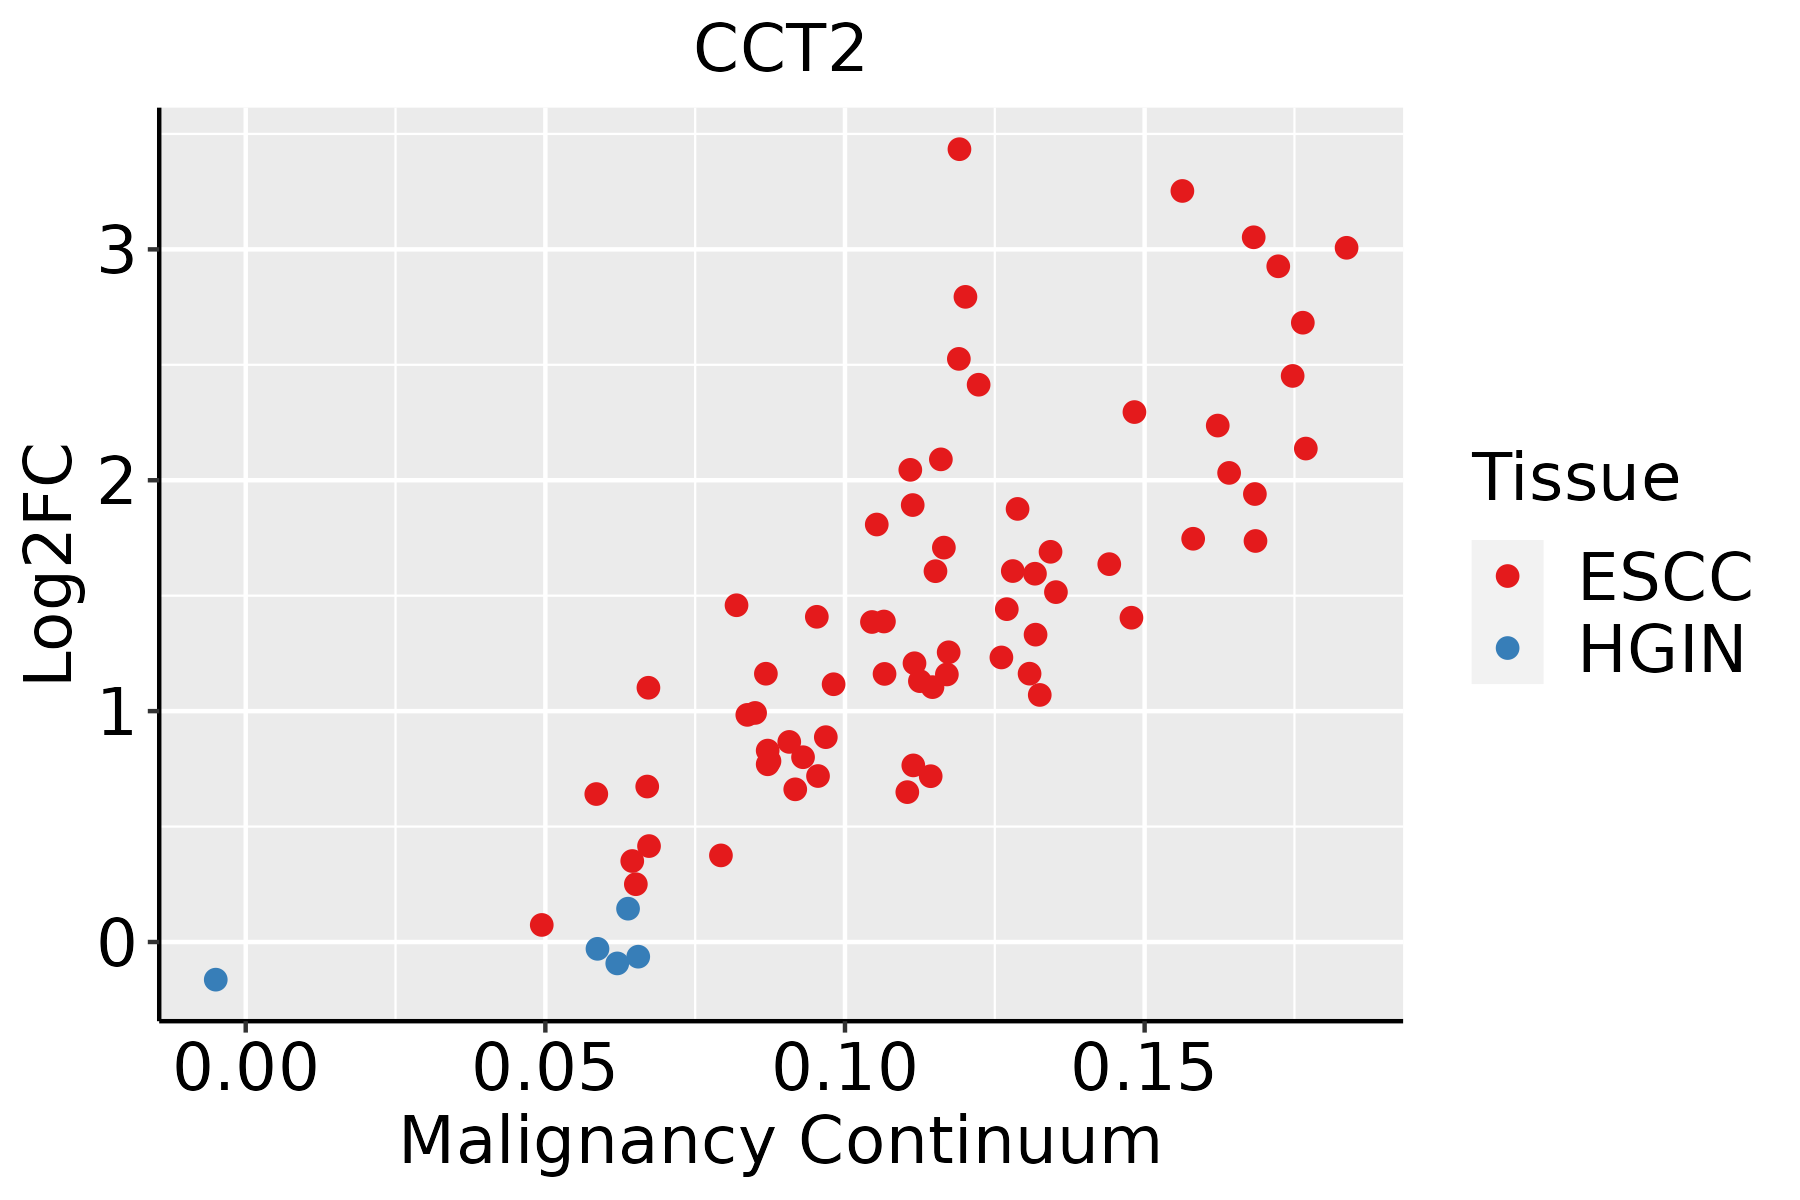 | ESCC: Esophageal squamous cell carcinoma |
| HGIN: High-grade intraepithelial neoplasias | ||
| LGIN: Low-grade intraepithelial neoplasias | ||
| Liver | 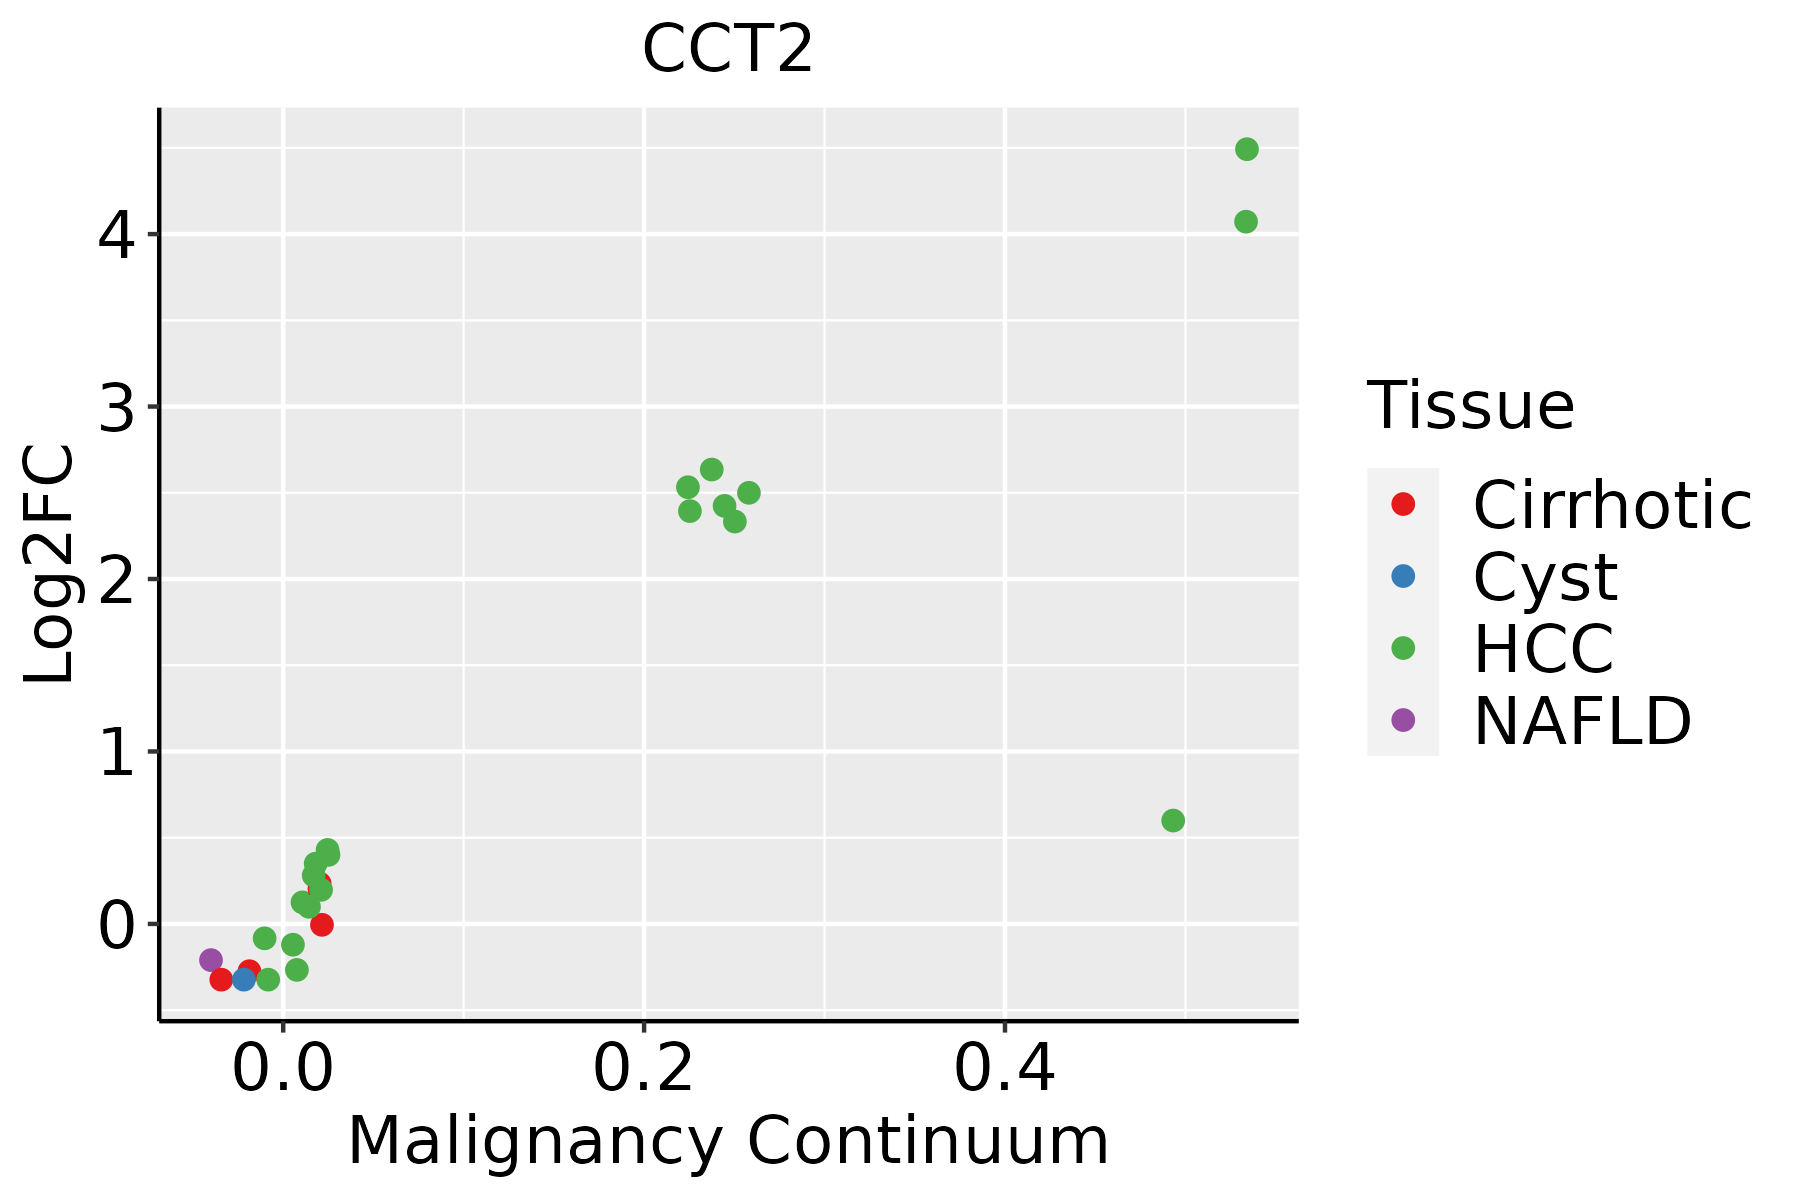 | HCC: Hepatocellular carcinoma |
| NAFLD: Non-alcoholic fatty liver disease | ||
| Oral Cavity |  | EOLP: Erosive Oral lichen planus |
| LP: leukoplakia | ||
| NEOLP: Non-erosive oral lichen planus | ||
| OSCC: Oral squamous cell carcinoma | ||
| Prostate |  | BPH: Benign Prostatic Hyperplasia |
| Skin |  | AK: Actinic keratosis |
| cSCC: Cutaneous squamous cell carcinoma | ||
| SCCIS:squamous cell carcinoma in situ | ||
| Thyroid | 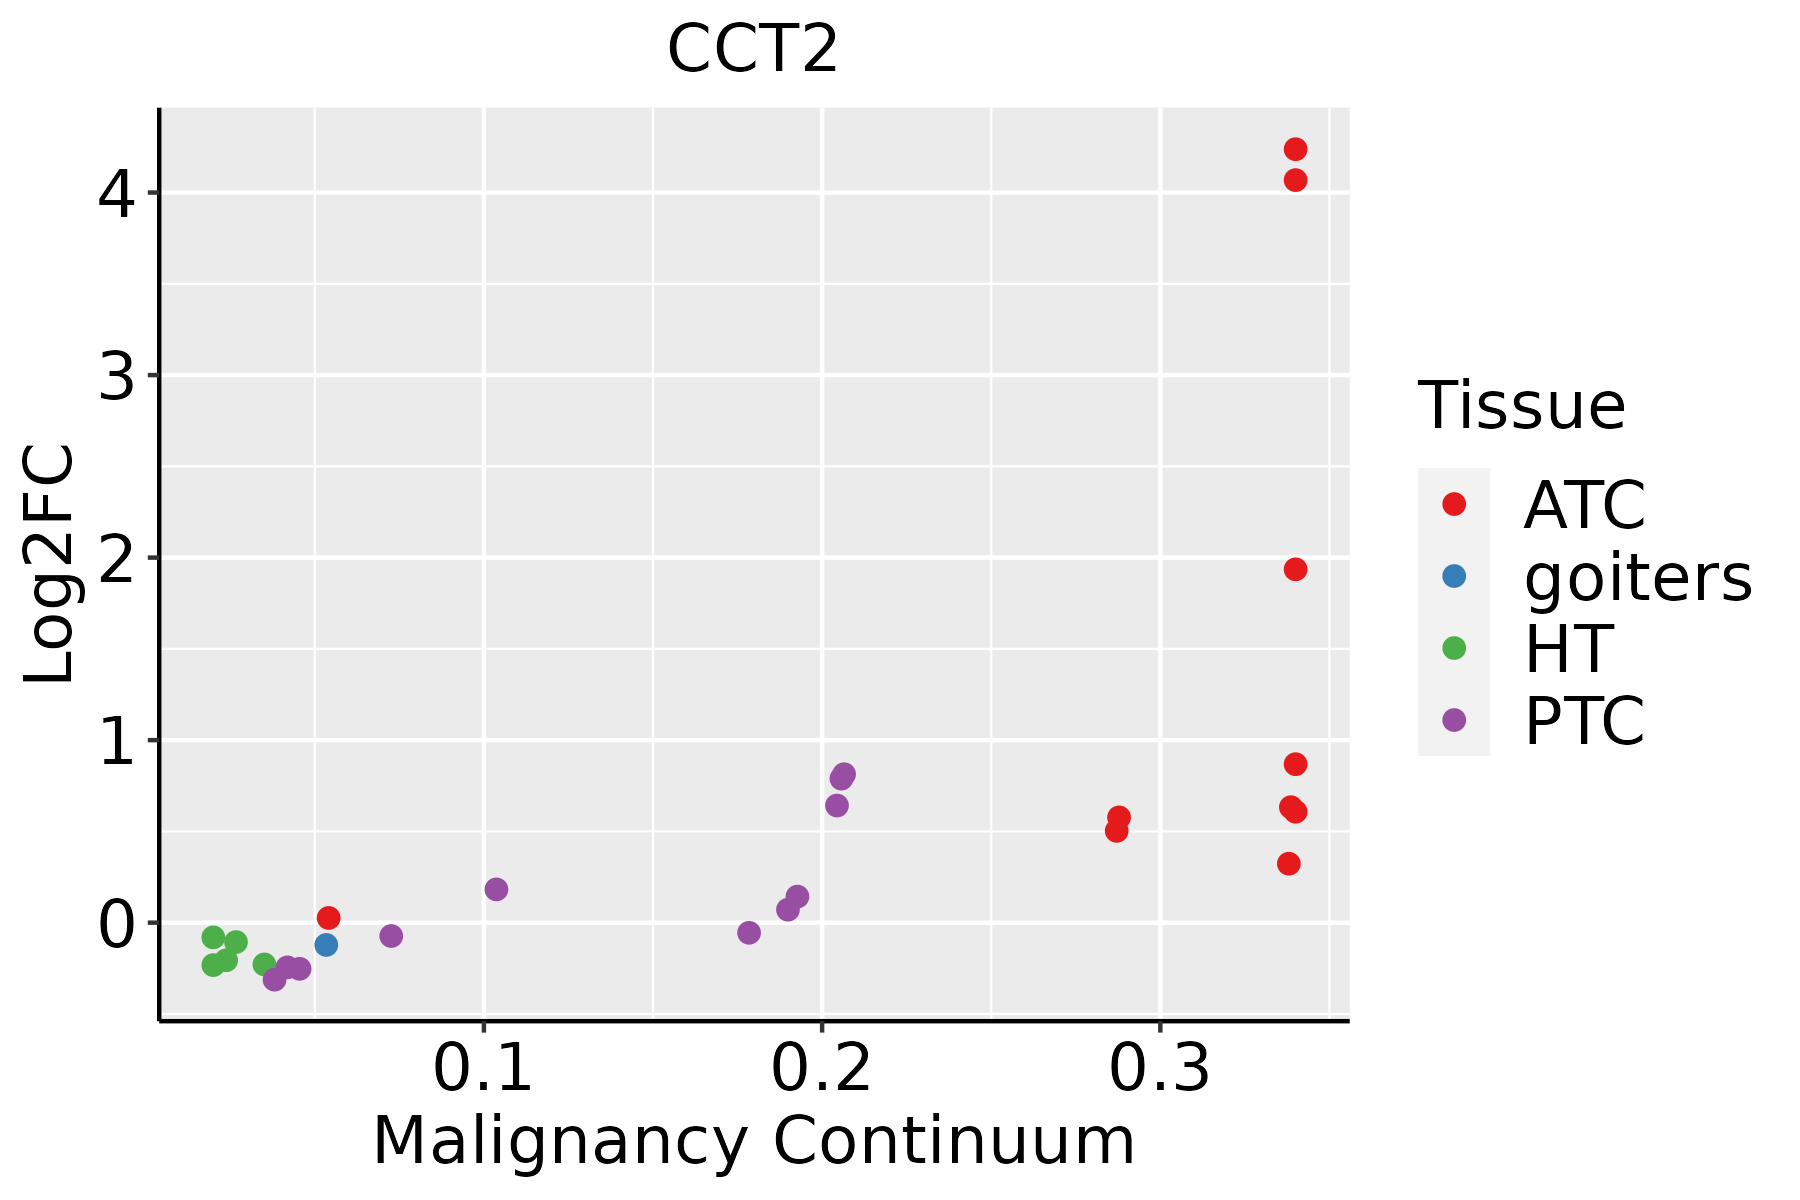 | ATC: Anaplastic thyroid cancer |
| HT: Hashimoto's thyroiditis | ||
| PTC: Papillary thyroid cancer |
| ∗log2FC in expression of this searched gene in stem-like cells from each diseased tissue sample relative to stem-like cells in normal samples in each tissue plotted against the malignancy continuum. Samples are colored based on if they are from different disease stage. |
Top |
Malignant transformation related pathway analysis |
| Find out the enriched GO biological processes and KEGG pathways involved in transition from healthy to precancer to cancer |
| Tissue | Disease Stage | Enriched GO biological Processes |
| Colorectum | AD |  |
| Colorectum | SER |  |
| Colorectum | MSS |  |
| Colorectum | MSI-H |  |
| Colorectum | FAP |  |
| ∗Top 15 enriched GO BP terms are showed in the bar plot of each disease state in each tissue. Each row represents a significant GO biological process which is colored according to the -log10(p.adjust). |
| Page: 1 2 3 4 5 6 7 8 9 |
| GO ID | Tissue | Disease Stage | Description | Gene Ratio | Bg Ratio | pvalue | p.adjust | Count |
| GO:00064578 | Breast | Precancer | protein folding | 43/1080 | 212/18723 | 3.48e-13 | 7.45e-11 | 43 |
| GO:00064588 | Breast | Precancer | 'de novo' protein folding | 16/1080 | 43/18723 | 8.14e-10 | 6.92e-08 | 16 |
| GO:00610778 | Breast | Precancer | chaperone-mediated protein folding | 19/1080 | 67/18723 | 4.22e-09 | 3.28e-07 | 19 |
| GO:00510848 | Breast | Precancer | 'de novo' posttranslational protein folding | 14/1080 | 39/18723 | 1.61e-08 | 1.12e-06 | 14 |
| GO:00508219 | Breast | Precancer | protein stabilization | 29/1080 | 191/18723 | 1.67e-06 | 6.08e-05 | 29 |
| GO:00316479 | Breast | Precancer | regulation of protein stability | 38/1080 | 298/18723 | 3.73e-06 | 1.19e-04 | 38 |
| GO:00108338 | Breast | Precancer | telomere maintenance via telomere lengthening | 15/1080 | 81/18723 | 5.31e-05 | 1.11e-03 | 15 |
| GO:00007238 | Breast | Precancer | telomere maintenance | 20/1080 | 131/18723 | 6.10e-05 | 1.25e-03 | 20 |
| GO:19901734 | Breast | Precancer | protein localization to nucleoplasm | 6/1080 | 14/18723 | 7.30e-05 | 1.44e-03 | 6 |
| GO:20005738 | Breast | Precancer | positive regulation of DNA biosynthetic process | 13/1080 | 66/18723 | 8.54e-05 | 1.63e-03 | 13 |
| GO:19049519 | Breast | Precancer | positive regulation of establishment of protein localization | 36/1080 | 319/18723 | 9.30e-05 | 1.75e-03 | 36 |
| GO:19048743 | Breast | Precancer | positive regulation of telomerase RNA localization to Cajal body | 6/1080 | 15/18723 | 1.16e-04 | 2.08e-03 | 6 |
| GO:19048516 | Breast | Precancer | positive regulation of establishment of protein localization to telomere | 5/1080 | 10/18723 | 1.25e-04 | 2.21e-03 | 5 |
| GO:00070047 | Breast | Precancer | telomere maintenance via telomerase | 13/1080 | 69/18723 | 1.37e-04 | 2.38e-03 | 13 |
| GO:19043567 | Breast | Precancer | regulation of telomere maintenance via telomere lengthening | 12/1080 | 61/18723 | 1.61e-04 | 2.69e-03 | 12 |
| GO:19043588 | Breast | Precancer | positive regulation of telomere maintenance via telomere lengthening | 9/1080 | 37/18723 | 1.96e-04 | 3.10e-03 | 9 |
| GO:00702034 | Breast | Precancer | regulation of establishment of protein localization to telomere | 5/1080 | 11/18723 | 2.18e-04 | 3.35e-03 | 5 |
| GO:19048694 | Breast | Precancer | regulation of protein localization to Cajal body | 5/1080 | 11/18723 | 2.18e-04 | 3.35e-03 | 5 |
| GO:19048714 | Breast | Precancer | positive regulation of protein localization to Cajal body | 5/1080 | 11/18723 | 2.18e-04 | 3.35e-03 | 5 |
| GO:00062786 | Breast | Precancer | RNA-dependent DNA biosynthetic process | 13/1080 | 75/18723 | 3.27e-04 | 4.64e-03 | 13 |
| Page: 1 2 3 4 5 6 7 8 9 10 11 12 13 14 15 16 17 18 19 20 21 22 23 24 25 26 27 28 29 30 31 32 33 34 35 36 37 38 39 40 41 42 43 44 45 46 47 48 49 50 51 52 53 54 55 |
| Pathway ID | Tissue | Disease Stage | Description | Gene Ratio | Bg Ratio | pvalue | p.adjust | qvalue | Count |
| Page: 1 |
Top |
Cell-cell communication analysis |
| Identification of potential cell-cell interactions between two cell types and their ligand-receptor pairs for different disease states |
| Ligand | Receptor | LRpair | Pathway | Tissue | Disease Stage |
| Page: 1 |
Top |
Single-cell gene regulatory network inference analysis |
| Find out the significant the regulons (TFs) and the target genes of each regulon across cell types for different disease states |
| TF | Cell Type | Tissue | Disease Stage | Target Gene | RSS | Regulon Activity |
| ∗The dot plots of a searched regulon are shown for all cell subpopulations in each disease state of each tissue based on the regulon specific score inferred using pySCENIC and by calculating the average expression. |
| Page: 1 |
Top |
Somatic mutation of malignant transformation related genes |
| Annotation of somatic variants for genes involved in malignant transformation |
| Hugo Symbol | Variant Class | Variant Classification | dbSNP RS | HGVSc | HGVSp | HGVSp Short | SWISSPROT | BIOTYPE | SIFT | PolyPhen | Tumor Sample Barcode | Tissue | Histology | Sex | Age | Stage | Therapy Types | Drugs | Outcome |
| CCT2 | SNV | Missense_Mutation | c.1057N>G | p.Met353Val | p.M353V | P78371 | protein_coding | tolerated(0.07) | benign(0.062) | TCGA-A8-A09Z-01 | Breast | breast invasive carcinoma | Female | >=65 | I/II | Unknown | Unknown | SD | |
| CCT2 | SNV | Missense_Mutation | c.901N>A | p.Glu301Lys | p.E301K | P78371 | protein_coding | deleterious(0) | probably_damaging(1) | TCGA-AC-A23H-01 | Breast | breast invasive carcinoma | Female | >=65 | I/II | Unknown | Unknown | PD | |
| CCT2 | SNV | Missense_Mutation | c.131N>A | p.Gly44Glu | p.G44E | P78371 | protein_coding | deleterious(0) | probably_damaging(1) | TCGA-AR-A0TX-01 | Breast | breast invasive carcinoma | Female | <65 | I/II | Unknown | Unknown | SD | |
| CCT2 | SNV | Missense_Mutation | c.196G>C | p.Asp66His | p.D66H | P78371 | protein_coding | deleterious(0) | probably_damaging(1) | TCGA-BH-A0EE-01 | Breast | breast invasive carcinoma | Female | >=65 | I/II | Chemotherapy | docetaxel | SD | |
| CCT2 | SNV | Missense_Mutation | c.1248N>C | p.Leu416Phe | p.L416F | P78371 | protein_coding | tolerated(0.38) | possibly_damaging(0.752) | TCGA-BH-A18T-01 | Breast | breast invasive carcinoma | Female | >=65 | I/II | Unknown | Unknown | PD | |
| CCT2 | SNV | Missense_Mutation | c.898N>T | p.Pro300Ser | p.P300S | P78371 | protein_coding | deleterious(0) | probably_damaging(1) | TCGA-DR-A0ZM-01 | Cervix | cervical & endocervical cancer | Female | <65 | III/IV | Unspecific | Cisplatin | SD | |
| CCT2 | SNV | Missense_Mutation | c.1242N>C | p.Glu414Asp | p.E414D | P78371 | protein_coding | deleterious(0.02) | probably_damaging(0.966) | TCGA-MU-A51Y-01 | Cervix | cervical & endocervical cancer | Female | <65 | I/II | Unknown | Unknown | SD | |
| CCT2 | SNV | Missense_Mutation | novel | c.562N>T | p.Leu188Phe | p.L188F | P78371 | protein_coding | deleterious(0.03) | possibly_damaging(0.837) | TCGA-AZ-4315-01 | Colorectum | colon adenocarcinoma | Male | <65 | I/II | Unknown | Unknown | SD |
| CCT2 | SNV | Missense_Mutation | novel | c.1143N>C | p.Gln381His | p.Q381H | P78371 | protein_coding | tolerated(0.52) | probably_damaging(0.991) | TCGA-CA-6717-01 | Colorectum | colon adenocarcinoma | Male | <65 | I/II | Chemotherapy | oxaliplatin | CR |
| CCT2 | SNV | Missense_Mutation | novel | c.1243N>C | p.Met415Leu | p.M415L | P78371 | protein_coding | tolerated(0.11) | benign(0.091) | TCGA-AG-A002-01 | Colorectum | rectum adenocarcinoma | Male | <65 | I/II | Unknown | Unknown | SD |
| Page: 1 2 3 4 5 6 |
Top |
Related drugs of malignant transformation related genes |
| Identification of chemicals and drugs interact with genes involved in malignant transfromation |
| (DGIdb 4.0) |
| Entrez ID | Symbol | Category | Interaction Types | Drug Claim Name | Drug Name | PMIDs |
| Page: 1 |

Copyright 2023-Present -The University of Texas Health Science Center at Houston |