
|
|||||
|
 | |
| |
| |
| |
| |
| |
|
Gene: CCR7 |
Gene summary for CCR7 |
| Gene information | Species | Human | Gene symbol | CCR7 | Gene ID | 1236 |
| Gene name | C-C motif chemokine receptor 7 | |
| Gene Alias | BLR2 | |
| Cytomap | 17q21.2 | |
| Gene Type | protein-coding | GO ID | GO:0000165 | UniProtAcc | P32248 |
Top |
Malignant transformation analysis |
| Identification of the aberrant gene expression in precancerous and cancerous lesions by comparing the gene expression of stem-like cells in diseased tissues with normal stem cells |
| Entrez ID | Symbol | Replicates | Species | Organ | Tissue | Adj P-value | Log2FC | Malignancy |
| 1236 | CCR7 | Adj_PTCwithHT_6 | Human | Thyroid | HT | 1.73e-13 | 8.14e-01 | 0.02 |
| 1236 | CCR7 | PTCwithHT_6 | Human | Thyroid | HT | 3.60e-05 | 5.03e-01 | 0.02 |
| Page: 1 |
| Tissue | Expression Dynamics | Abbreviation |
| Thyroid | 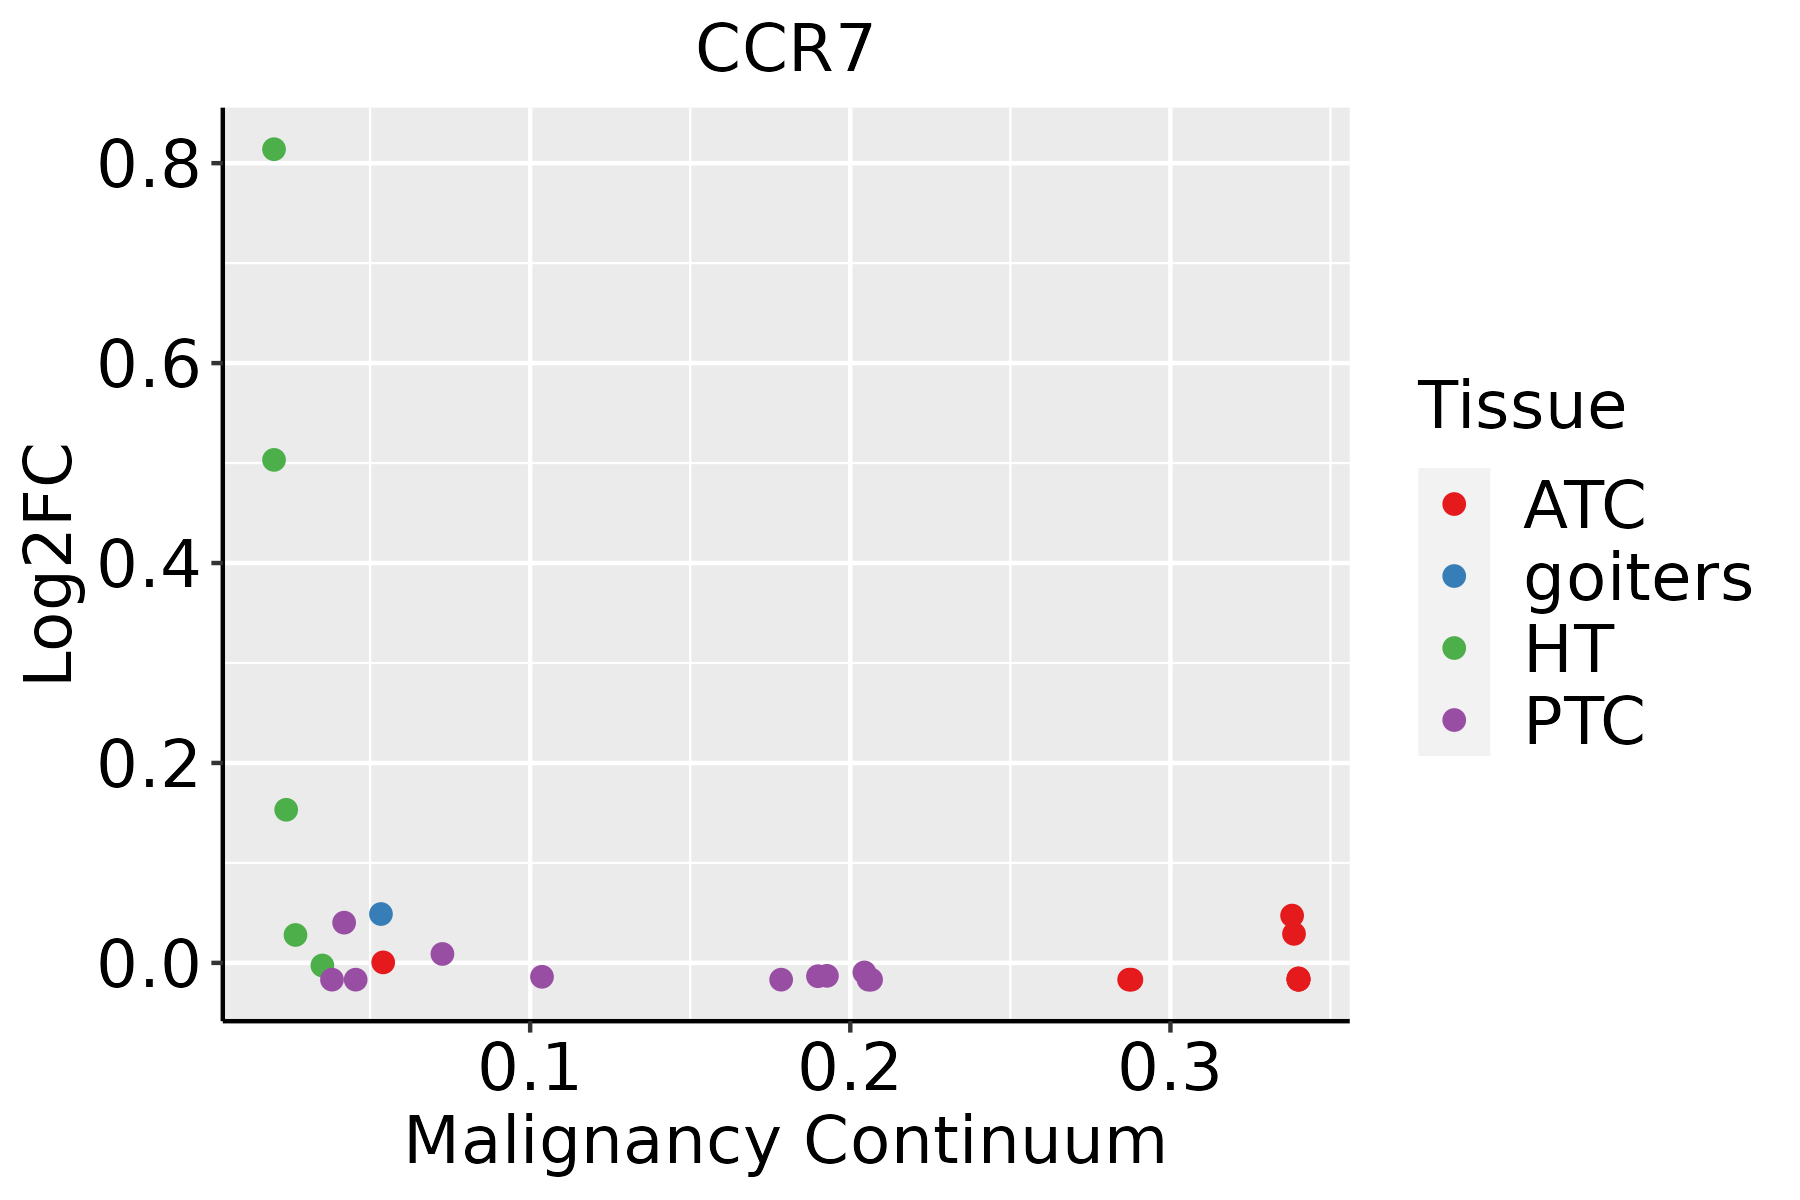 | ATC: Anaplastic thyroid cancer |
| HT: Hashimoto's thyroiditis | ||
| PTC: Papillary thyroid cancer |
| ∗log2FC in expression of this searched gene in stem-like cells from each diseased tissue sample relative to stem-like cells in normal samples in each tissue plotted against the malignancy continuum. Samples are colored based on if they are from different disease stage. |
Top |
Malignant transformation related pathway analysis |
| Find out the enriched GO biological processes and KEGG pathways involved in transition from healthy to precancer to cancer |
| Tissue | Disease Stage | Enriched GO biological Processes |
| Colorectum | AD |  |
| Colorectum | SER |  |
| Colorectum | MSS |  |
| Colorectum | MSI-H |  |
| Colorectum | FAP |  |
| ∗Top 15 enriched GO BP terms are showed in the bar plot of each disease state in each tissue. Each row represents a significant GO biological process which is colored according to the -log10(p.adjust). |
| Page: 1 2 3 4 5 6 7 8 9 |
| GO ID | Tissue | Disease Stage | Description | Gene Ratio | Bg Ratio | pvalue | p.adjust | Count |
| GO:005086319 | Thyroid | HT | regulation of T cell activation | 51/1272 | 329/18723 | 2.58e-08 | 1.97e-06 | 51 |
| GO:004578530 | Thyroid | HT | positive regulation of cell adhesion | 62/1272 | 437/18723 | 2.61e-08 | 1.97e-06 | 62 |
| GO:002240726 | Thyroid | HT | regulation of cell-cell adhesion | 63/1272 | 448/18723 | 2.83e-08 | 2.07e-06 | 63 |
| GO:000715920 | Thyroid | HT | leukocyte cell-cell adhesion | 54/1272 | 371/18723 | 8.84e-08 | 5.23e-06 | 54 |
| GO:190303720 | Thyroid | HT | regulation of leukocyte cell-cell adhesion | 49/1272 | 336/18723 | 3.27e-07 | 1.52e-05 | 49 |
| GO:005087018 | Thyroid | HT | positive regulation of T cell activation | 36/1272 | 216/18723 | 4.86e-07 | 2.11e-05 | 36 |
| GO:001988228 | Thyroid | HT | antigen processing and presentation | 23/1272 | 106/18723 | 5.40e-07 | 2.33e-05 | 23 |
| GO:00512519 | Thyroid | HT | positive regulation of lymphocyte activation | 51/1272 | 362/18723 | 5.57e-07 | 2.38e-05 | 51 |
| GO:004211020 | Thyroid | HT | T cell activation | 63/1272 | 487/18723 | 5.95e-07 | 2.51e-05 | 63 |
| GO:000181919 | Thyroid | HT | positive regulation of cytokine production | 61/1272 | 467/18723 | 6.46e-07 | 2.68e-05 | 61 |
| GO:000269610 | Thyroid | HT | positive regulation of leukocyte activation | 55/1272 | 409/18723 | 9.17e-07 | 3.70e-05 | 55 |
| GO:00508679 | Thyroid | HT | positive regulation of cell activation | 55/1272 | 420/18723 | 2.11e-06 | 7.61e-05 | 55 |
| GO:00507297 | Thyroid | HT | positive regulation of inflammatory response | 26/1272 | 142/18723 | 3.14e-06 | 1.08e-04 | 26 |
| GO:00321039 | Thyroid | HT | positive regulation of response to external stimulus | 55/1272 | 427/18723 | 3.50e-06 | 1.16e-04 | 55 |
| GO:002240924 | Thyroid | HT | positive regulation of cell-cell adhesion | 41/1272 | 284/18723 | 3.80e-06 | 1.24e-04 | 41 |
| GO:00313497 | Thyroid | HT | positive regulation of defense response | 40/1272 | 278/18723 | 5.40e-06 | 1.66e-04 | 40 |
| GO:190303919 | Thyroid | HT | positive regulation of leukocyte cell-cell adhesion | 36/1272 | 239/18723 | 5.54e-06 | 1.68e-04 | 36 |
| GO:19031319 | Thyroid | HT | mononuclear cell differentiation | 54/1272 | 426/18723 | 6.88e-06 | 2.00e-04 | 54 |
| GO:004887230 | Thyroid | HT | homeostasis of number of cells | 38/1272 | 272/18723 | 1.82e-05 | 4.31e-04 | 38 |
| GO:003109820 | Thyroid | HT | stress-activated protein kinase signaling cascade | 35/1272 | 247/18723 | 2.84e-05 | 6.14e-04 | 35 |
| Page: 1 2 3 4 5 |
| Pathway ID | Tissue | Disease Stage | Description | Gene Ratio | Bg Ratio | pvalue | p.adjust | qvalue | Count |
| Page: 1 |
Top |
Cell-cell communication analysis |
| Identification of potential cell-cell interactions between two cell types and their ligand-receptor pairs for different disease states |
| Ligand | Receptor | LRpair | Pathway | Tissue | Disease Stage |
| CCL21 | CCR7 | CCL21_CCR7 | CCL | Breast | ADJ |
| CCL21 | CCR7 | CCL21_CCR7 | CCL | Breast | Healthy |
| CCL21 | CCR7 | CCL21_CCR7 | CCL | Breast | IDC |
| CCL21 | CCR7 | CCL21_CCR7 | CCL | Breast | Precancer |
| CCL21 | CCR7 | CCL21_CCR7 | CCL | Endometrium | ADJ |
| CCL21 | CCR7 | CCL21_CCR7 | CCL | Endometrium | AEH |
| CCL21 | CCR7 | CCL21_CCR7 | CCL | Endometrium | EEC |
| CCL21 | CCR7 | CCL21_CCR7 | CCL | Endometrium | Healthy |
| CCL19 | CCR7 | CCL19_CCR7 | CCL | GC | ADJ |
| CCL21 | CCR7 | CCL21_CCR7 | CCL | GC | ADJ |
| CCL19 | CCR7 | CCL19_CCR7 | CCL | GC | GC |
| CCL21 | CCR7 | CCL21_CCR7 | CCL | GC | GC |
| CCL21 | CCR7 | CCL21_CCR7 | CCL | HNSCC | ADJ |
| CCL21 | CCR7 | CCL21_CCR7 | CCL | HNSCC | OSCC |
| CCL19 | CCR7 | CCL19_CCR7 | CCL | HNSCC | Precancer |
| CCL21 | CCR7 | CCL21_CCR7 | CCL | Lung | ADJ |
| CCL21 | CCR7 | CCL21_CCR7 | CCL | Lung | AIS |
| CCL19 | CCR7 | CCL19_CCR7 | CCL | Lung | IAC |
| CCL21 | CCR7 | CCL21_CCR7 | CCL | Lung | IAC |
| CCL21 | CCR7 | CCL21_CCR7 | CCL | Lung | MIAC |
| Page: 1 |
Top |
Single-cell gene regulatory network inference analysis |
| Find out the significant the regulons (TFs) and the target genes of each regulon across cell types for different disease states |
| TF | Cell Type | Tissue | Disease Stage | Target Gene | RSS | Regulon Activity |
| ∗The dot plots of a searched regulon are shown for all cell subpopulations in each disease state of each tissue based on the regulon specific score inferred using pySCENIC and by calculating the average expression. |
| Page: 1 |
Top |
Somatic mutation of malignant transformation related genes |
| Annotation of somatic variants for genes involved in malignant transformation |
| Hugo Symbol | Variant Class | Variant Classification | dbSNP RS | HGVSc | HGVSp | HGVSp Short | SWISSPROT | BIOTYPE | SIFT | PolyPhen | Tumor Sample Barcode | Tissue | Histology | Sex | Age | Stage | Therapy Types | Drugs | Outcome |
| CCR7 | SNV | Missense_Mutation | c.415N>T | p.Ser139Cys | p.S139C | P32248 | protein_coding | deleterious(0) | probably_damaging(0.984) | TCGA-A8-A09A-01 | Breast | breast invasive carcinoma | Female | <65 | I/II | Hormone Therapy | tamoxiphen | SD | |
| CCR7 | SNV | Missense_Mutation | c.7N>A | p.Leu3Met | p.L3M | P32248 | protein_coding | tolerated_low_confidence(0.16) | benign(0) | TCGA-AN-A0AK-01 | Breast | breast invasive carcinoma | Female | >=65 | I/II | Unknown | Unknown | SD | |
| CCR7 | SNV | Missense_Mutation | c.8T>A | p.Leu3Gln | p.L3Q | P32248 | protein_coding | tolerated_low_confidence(0.5) | benign(0.013) | TCGA-D8-A1JG-01 | Breast | breast invasive carcinoma | Female | <65 | I/II | Chemotherapy | doxorubicin | SD | |
| CCR7 | SNV | Missense_Mutation | novel | c.944N>A | p.Ala315Asp | p.A315D | P32248 | protein_coding | deleterious(0) | probably_damaging(1) | TCGA-2W-A8YY-01 | Cervix | cervical & endocervical cancer | Female | <65 | I/II | Chemotherapy | cisplatin | CR |
| CCR7 | SNV | Missense_Mutation | c.252C>G | p.Ile84Met | p.I84M | P32248 | protein_coding | deleterious(0.03) | possibly_damaging(0.657) | TCGA-C5-A1MH-01 | Cervix | cervical & endocervical cancer | Female | >=65 | III/IV | Chemotherapy | cisplatin | PD | |
| CCR7 | SNV | Missense_Mutation | rs775899752 | c.919N>A | p.Ala307Thr | p.A307T | P32248 | protein_coding | tolerated(0.05) | possibly_damaging(0.692) | TCGA-EA-A410-01 | Cervix | cervical & endocervical cancer | Female | <65 | I/II | Unknown | Unknown | SD |
| CCR7 | SNV | Missense_Mutation | rs374797000 | c.1088G>A | p.Arg363His | p.R363H | P32248 | protein_coding | deleterious(0.01) | benign(0.005) | TCGA-5M-AAT6-01 | Colorectum | colon adenocarcinoma | Female | <65 | III/IV | Unknown | Unknown | PD |
| CCR7 | SNV | Missense_Mutation | rs753561165 | c.626N>A | p.Arg209Gln | p.R209Q | P32248 | protein_coding | tolerated(0.36) | possibly_damaging(0.846) | TCGA-A6-5662-01 | Colorectum | colon adenocarcinoma | Male | <65 | I/II | Chemotherapy | oxaliplatin | PD |
| CCR7 | SNV | Missense_Mutation | rs764245161 | c.799N>A | p.Ala267Thr | p.A267T | P32248 | protein_coding | deleterious(0.03) | possibly_damaging(0.692) | TCGA-AA-3506-01 | Colorectum | colon adenocarcinoma | Male | >=65 | I/II | Unknown | Unknown | SD |
| CCR7 | SNV | Missense_Mutation | c.926A>G | p.Asp309Gly | p.D309G | P32248 | protein_coding | deleterious(0.01) | possibly_damaging(0.636) | TCGA-AA-3663-01 | Colorectum | colon adenocarcinoma | Male | <65 | I/II | Unknown | Unknown | SD |
| Page: 1 2 3 4 5 |
Top |
Related drugs of malignant transformation related genes |
| Identification of chemicals and drugs interact with genes involved in malignant transfromation |
| (DGIdb 4.0) |
| Entrez ID | Symbol | Category | Interaction Types | Drug Claim Name | Drug Name | PMIDs |
| 1236 | CCR7 | DRUGGABLE GENOME, CELL SURFACE, EXTERNAL SIDE OF PLASMA MEMBRANE, G PROTEIN COUPLED RECEPTOR | agonist | 135651670 | ||
| 1236 | CCR7 | DRUGGABLE GENOME, CELL SURFACE, EXTERNAL SIDE OF PLASMA MEMBRANE, G PROTEIN COUPLED RECEPTOR | agonist | 178100552 | ||
| 1236 | CCR7 | DRUGGABLE GENOME, CELL SURFACE, EXTERNAL SIDE OF PLASMA MEMBRANE, G PROTEIN COUPLED RECEPTOR | agonist | 135651663 | ||
| 1236 | CCR7 | DRUGGABLE GENOME, CELL SURFACE, EXTERNAL SIDE OF PLASMA MEMBRANE, G PROTEIN COUPLED RECEPTOR | agonist | 252166852 | ||
| 1236 | CCR7 | DRUGGABLE GENOME, CELL SURFACE, EXTERNAL SIDE OF PLASMA MEMBRANE, G PROTEIN COUPLED RECEPTOR | agonist | 178100551 |
| Page: 1 |

Copyright 2023-Present -The University of Texas Health Science Center at Houston |