Schematic overview of the cellular and molecular mechanisms involved in the cancer progression, including the proposed cellular and molecular mechanisms in cancer cells trajectory. AT1: alveolar type 1 cells; AT2: alveolar type 2 cells; AAH: atypical adenomatous hyperplasia; AIS: adenocarcinoma in situ; MIA: minimally invasive adenocarcinoma; IA: invasive adenocarcinoma; EMT: epithelial-mesenchymal transition

Home

Download

Statistics

Help

Contact

Center for Computational Systems Medicine
leaf

Gene summary

leaf

Malignant transformation analysis

leaf

Malignant transformation related pathway analysis

leaf

Cell-cell communication analysis

leaf

Single-cell gene regulatory network inference analysis

leaf

Somatic mutation of malignant transformation related genes

leaf

Related drugs of malignant transformation related genes

Gene: CCPG1

Gene summary for CCPG1

check button Gene summary.

Gene informationSpeciesHuman
Gene symbol

CCPG1

Gene ID

9236

Gene namecell cycle progression 1
Gene AliasCPR8
Cytomap15q21.3
Gene Typeprotein-coding
GO ID

GO:0006139

UniProtAcc

Q9ULG6


Top

Malignant transformation analysis

check button Identification of the aberrant gene expression in precancerous and cancerous lesions by comparing the gene expression of stem-like cells in diseased tissues with normal stem cells
check button Malignant transformation involving gene list.
Entrez IDSymbolReplicatesSpeciesOrganTissueAdj P-valueLog2FCMalignancy
9236CCPG1LZE4THumanEsophagusESCC9.27e-154.20e-010.0811
9236CCPG1LZE5THumanEsophagusESCC1.29e-046.96e-010.0514
9236CCPG1LZE7THumanEsophagusESCC1.29e-065.02e-010.0667
9236CCPG1LZE8THumanEsophagusESCC1.70e-113.24e-010.067
9236CCPG1LZE22THumanEsophagusESCC4.79e-043.01e-010.068
9236CCPG1LZE24THumanEsophagusESCC1.44e-053.11e-010.0596
9236CCPG1LZE6THumanEsophagusESCC7.02e-083.35e-010.0845
9236CCPG1P1T-EHumanEsophagusESCC6.70e-075.66e-010.0875
9236CCPG1P2T-EHumanEsophagusESCC7.73e-172.47e-010.1177
9236CCPG1P4T-EHumanEsophagusESCC3.26e-134.41e-010.1323
9236CCPG1P5T-EHumanEsophagusESCC9.03e-163.79e-010.1327
9236CCPG1P8T-EHumanEsophagusESCC4.08e-491.01e+000.0889
9236CCPG1P9T-EHumanEsophagusESCC3.00e-134.44e-010.1131
9236CCPG1P10T-EHumanEsophagusESCC5.45e-102.07e-010.116
9236CCPG1P11T-EHumanEsophagusESCC6.20e-177.16e-010.1426
9236CCPG1P12T-EHumanEsophagusESCC4.26e-153.45e-010.1122
9236CCPG1P15T-EHumanEsophagusESCC3.26e-052.74e-010.1149
9236CCPG1P16T-EHumanEsophagusESCC3.29e-092.11e-010.1153
9236CCPG1P19T-EHumanEsophagusESCC8.33e-057.29e-010.1662
9236CCPG1P20T-EHumanEsophagusESCC2.44e-071.88e-010.1124
Page: 1 2 3 4 5 

check button Transcriptomic changes along malignancy continuum.
TissueExpression DynamicsAbbreviation
EsophagusThe image shows the transcriptomic changes along malignancy continuum.log2FC in expression of this searched gene in stem-like cells from each diseased tissue sample relative to stem-like cells in normal samples in each tissue plotted against the malignancy continuum. Samples are colored based on if they are from different disease stage.ESCC: Esophageal squamous cell carcinoma
HGIN: High-grade intraepithelial neoplasias
LGIN: Low-grade intraepithelial neoplasias
LiverThe image shows the transcriptomic changes along malignancy continuum.log2FC in expression of this searched gene in stem-like cells from each diseased tissue sample relative to stem-like cells in normal samples in each tissue plotted against the malignancy continuum. Samples are colored based on if they are from different disease stage.
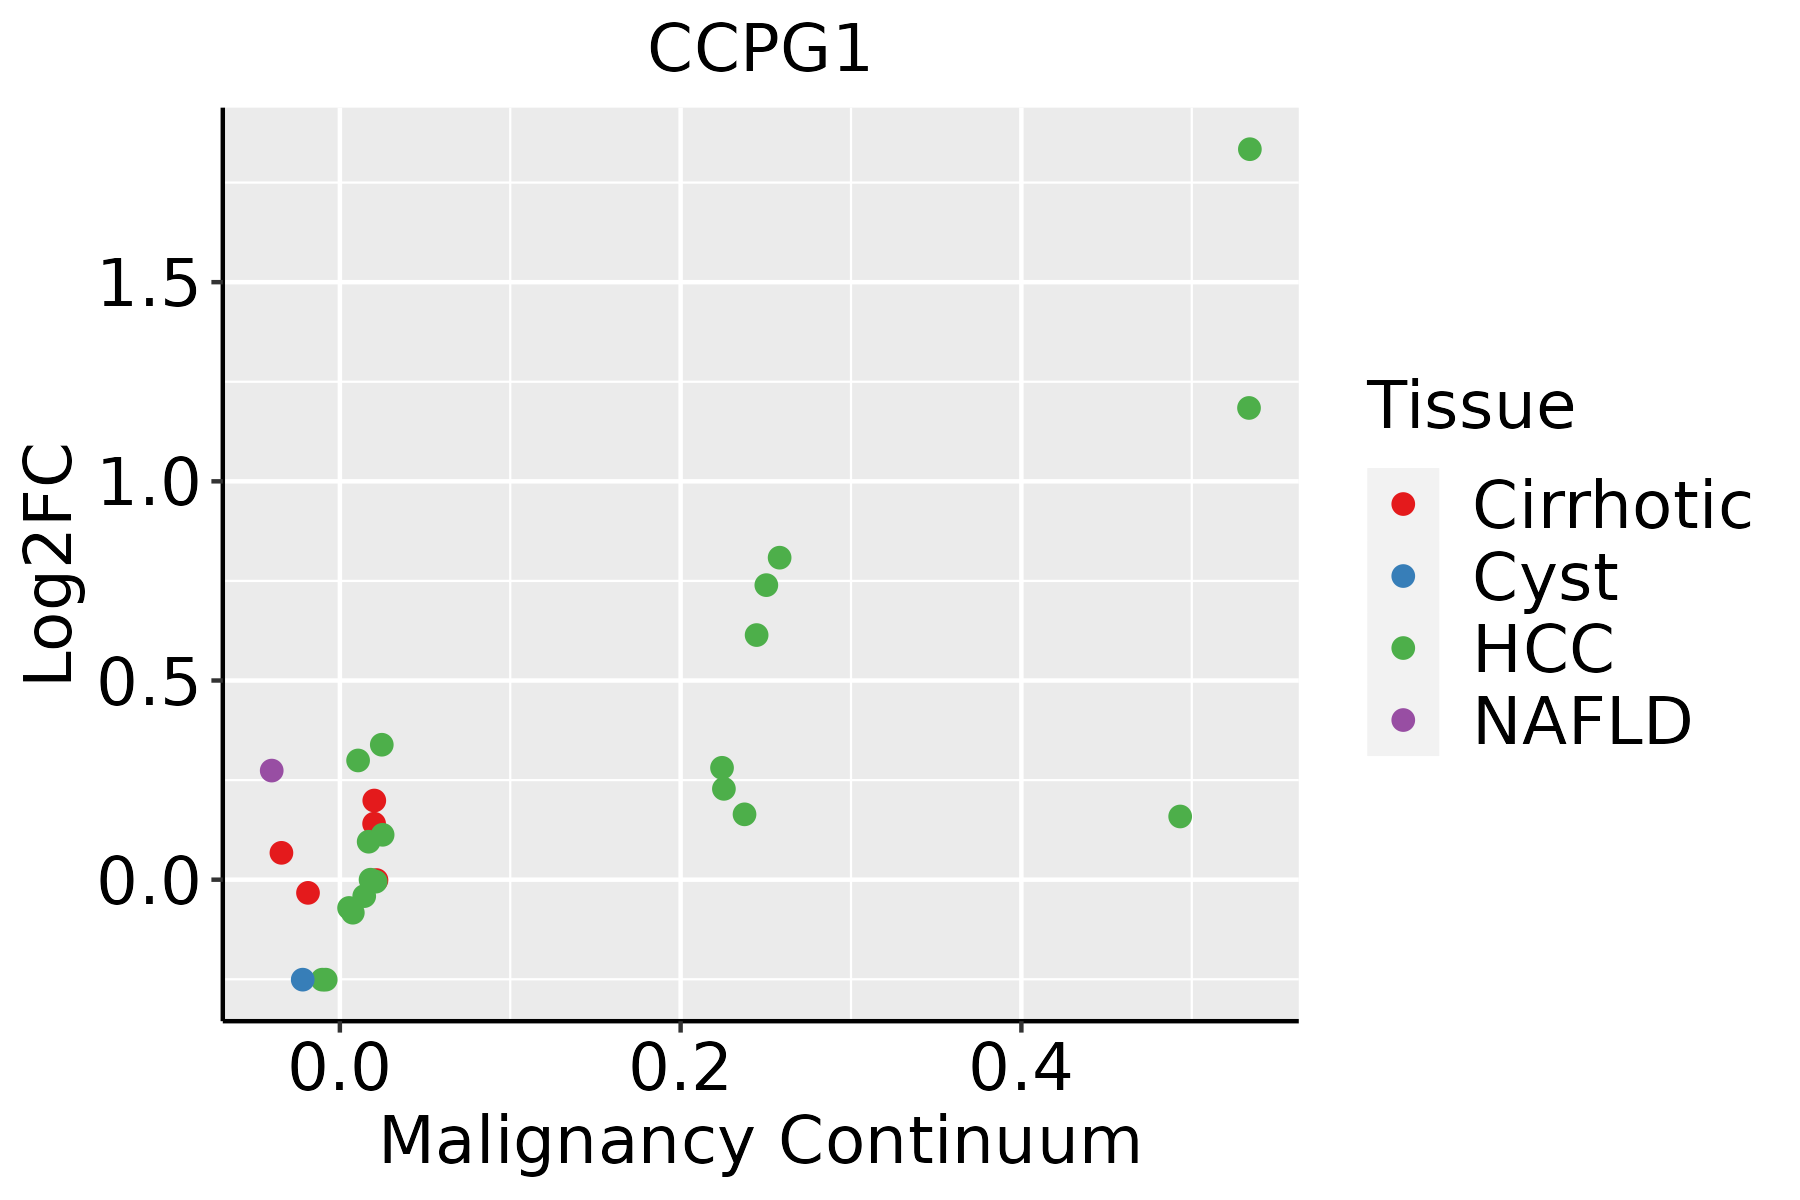
HCC: Hepatocellular carcinoma
NAFLD: Non-alcoholic fatty liver disease
Oral CavityThe image shows the transcriptomic changes along malignancy continuum.log2FC in expression of this searched gene in stem-like cells from each diseased tissue sample relative to stem-like cells in normal samples in each tissue plotted against the malignancy continuum. Samples are colored based on if they are from different disease stage.EOLP: Erosive Oral lichen planus
LP: leukoplakia
NEOLP: Non-erosive oral lichen planus
OSCC: Oral squamous cell carcinoma
ProstateThe image shows the transcriptomic changes along malignancy continuum.log2FC in expression of this searched gene in stem-like cells from each diseased tissue sample relative to stem-like cells in normal samples in each tissue plotted against the malignancy continuum. Samples are colored based on if they are from different disease stage.BPH: Benign Prostatic Hyperplasia
ThyroidThe image shows the transcriptomic changes along malignancy continuum.log2FC in expression of this searched gene in stem-like cells from each diseased tissue sample relative to stem-like cells in normal samples in each tissue plotted against the malignancy continuum. Samples are colored based on if they are from different disease stage.
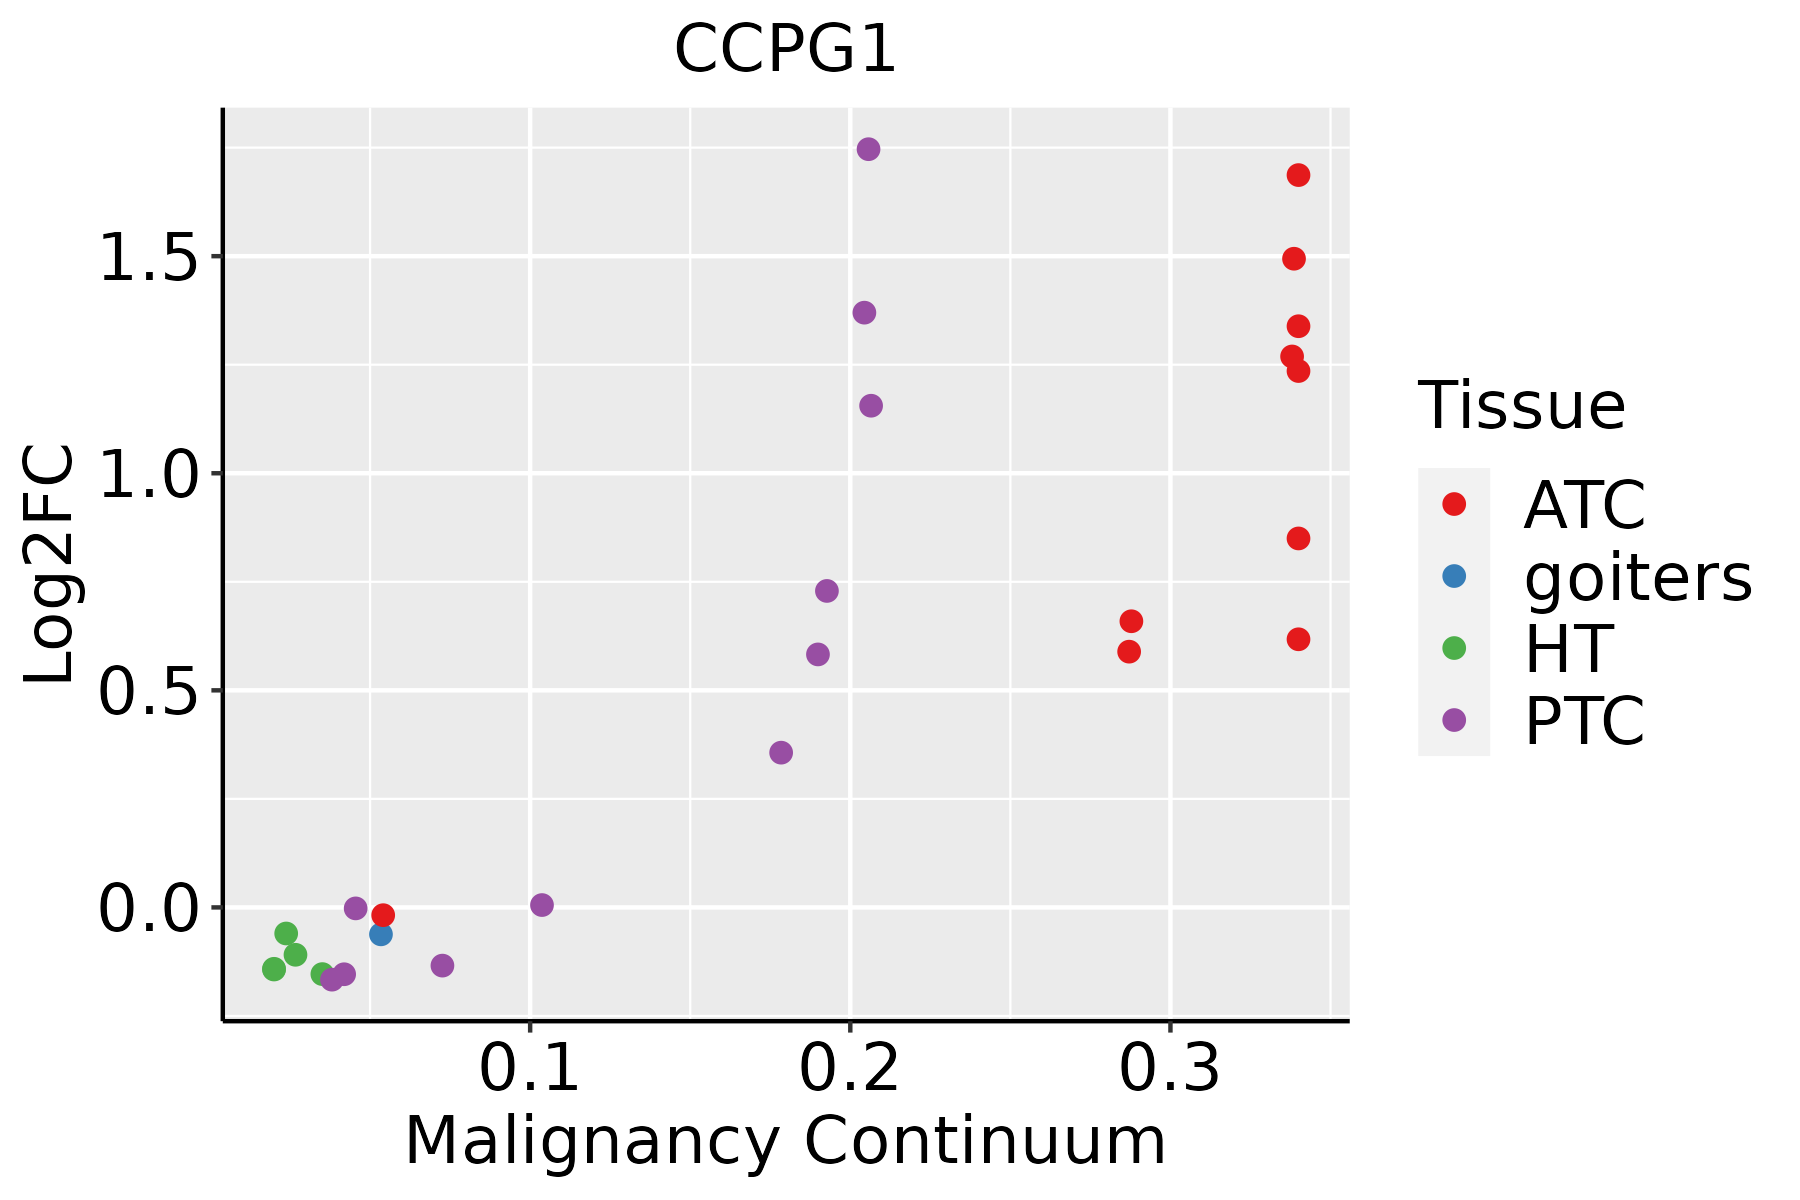
ATC: Anaplastic thyroid cancer
HT: Hashimoto's thyroiditis
PTC: Papillary thyroid cancer
∗log2FC in expression of this searched gene in stem-like cells from each diseased tissue sample relative to stem-like cells in normal samples in each tissue plotted against the malignancy continuum. Samples are colored based on if they are from different disease stage.

Top

Malignant transformation related pathway analysis

check buttonFind out the enriched GO biological processes and KEGG pathways involved in transition from healthy to precancer to cancer
check button Figure of enriched GO biological processes.
TissueDisease StageEnriched GO biological Processes
ColorectumADGO analysis - Figure of enriched GO biological processes: Top 15 enriched GO BP terms are showed in the bar plot of each disease state in each tissue. Each row represents a significant GO biological process which is colored according to the -log10(p.adjust).
ColorectumSERGO analysis - Figure of enriched GO biological processes: Top 15 enriched GO BP terms are showed in the bar plot of each disease state in each tissue. Each row represents a significant GO biological process which is colored according to the -log10(p.adjust).
ColorectumMSSGO analysis - Figure of enriched GO biological processes: Top 15 enriched GO BP terms are showed in the bar plot of each disease state in each tissue. Each row represents a significant GO biological process which is colored according to the -log10(p.adjust).
ColorectumMSI-HGO analysis - Figure of enriched GO biological processes: Top 15 enriched GO BP terms are showed in the bar plot of each disease state in each tissue. Each row represents a significant GO biological process which is colored according to the -log10(p.adjust).
ColorectumFAPGO analysis - Figure of enriched GO biological processes: Top 15 enriched GO BP terms are showed in the bar plot of each disease state in each tissue. Each row represents a significant GO biological process which is colored according to the -log10(p.adjust).
∗Top 15 enriched GO BP terms are showed in the bar plot of each disease state in each tissue. Each row represents a significant GO biological process which is colored according to the -log10(p.adjust).
Page: 1 2 3 4 5 6 7 8 9 

check button Enriched GO biological processes.
GO IDTissueDisease StageDescriptionGene RatioBg Ratiopvaluep.adjustCount
GO:0051098111EsophagusESCCregulation of binding251/8552363/187236.73e-208.46e-18251
GO:004578710EsophagusESCCpositive regulation of cell cycle196/8552313/187239.27e-102.24e-08196
GO:004308715EsophagusESCCregulation of GTPase activity183/8552348/187235.34e-032.00e-02183
GO:005109812LiverCirrhoticregulation of binding148/4634363/187239.14e-125.97e-10148
GO:00457874LiverCirrhoticpositive regulation of cell cycle97/4634313/187236.88e-033.38e-0297
GO:005109822LiverHCCregulation of binding225/7958363/187233.78e-142.37e-12225
GO:004578711LiverHCCpositive regulation of cell cycle172/7958313/187235.29e-066.58e-05172
GO:005109820Oral cavityOSCCregulation of binding212/7305363/187233.88e-142.15e-12212
GO:00457879Oral cavityOSCCpositive regulation of cell cycle173/7305313/187233.28e-097.44e-08173
GO:004308710Oral cavityOSCCregulation of GTPase activity165/7305348/187237.94e-044.27e-03165
GO:005109819ProstateTumorregulation of binding122/3246363/187232.86e-143.63e-12122
GO:004578714ProstateTumorpositive regulation of cell cycle81/3246313/187238.45e-058.46e-0481
GO:004308713ProstateTumorregulation of GTPase activity88/3246348/187231.04e-041.00e-0388
GO:0051098113ThyroidPTCregulation of binding195/5968363/187233.21e-183.37e-16195
GO:004578718ThyroidPTCpositive regulation of cell cycle144/5968313/187239.93e-081.99e-06144
GO:004308718ThyroidPTCregulation of GTPase activity148/5968348/187231.63e-051.71e-04148
GO:1904424ThyroidPTCregulation of GTP binding11/596815/187231.19e-036.84e-0311
GO:005109834ThyroidATCregulation of binding203/6293363/187231.18e-181.55e-16203
GO:004578719ThyroidATCpositive regulation of cell cycle158/6293313/187234.18e-101.14e-08158
GO:004308719ThyroidATCregulation of GTPase activity153/6293348/187233.24e-052.68e-04153
Page: 1 2 

check button Enriched KEGG pathways.
Pathway IDTissueDisease StageDescriptionGene RatioBg Ratiopvaluep.adjustqvalueCount
Page: 1 

Top

Cell-cell communication analysis

check buttonIdentification of potential cell-cell interactions between two cell types and their ligand-receptor pairs for different disease states
LigandReceptorLRpairPathwayTissueDisease Stage
Page: 1 

Top

Single-cell gene regulatory network inference analysis

check buttonFind out the significant the regulons (TFs) and the target genes of each regulon across cell types for different disease states
TFCell TypeTissueDisease StageTarget GeneRSSRegulon Activity
∗The dot plots of a searched regulon are shown for all cell subpopulations in each disease state of each tissue based on the regulon specific score inferred using pySCENIC and by calculating the average expression.
Page: 1 

Top

Somatic mutation of malignant transformation related genes

check buttonAnnotation of somatic variants for genes involved in malignant transformation
Hugo SymbolVariant ClassVariant ClassificationdbSNP RSHGVScHGVSpHGVSp ShortSWISSPROTBIOTYPESIFTPolyPhenTumor Sample BarcodeTissueHistologySexAgeStageTherapy TypesDrugsOutcome
CCPG1SNVMissense_Mutationc.419C>Gp.Ser140Cysp.S140CQ9ULG6protein_codingtolerated(0.17)probably_damaging(0.974)TCGA-A1-A0SI-01Breastbreast invasive carcinomaFemale<65I/IIUnknownUnknownSD
CCPG1SNVMissense_Mutationc.1321G>Ap.Glu441Lysp.E441KQ9ULG6protein_codingdeleterious(0)probably_damaging(0.997)TCGA-AN-A046-01Breastbreast invasive carcinomaFemale>=65I/IIUnknownUnknownSD
CCPG1SNVMissense_Mutationc.357T>Gp.Asn119Lysp.N119KQ9ULG6protein_codingtolerated(0.59)benign(0.019)TCGA-D8-A1JM-01Breastbreast invasive carcinomaFemale<65I/IIChemotherapyHormone TherapydoxorubicineSD
CCPG1SNVMissense_Mutationc.91N>Tp.Thr31Serp.T31SQ9ULG6protein_codingtolerated(0.36)benign(0.018)TCGA-E9-A24A-01Breastbreast invasive carcinomaFemale>=65I/IIHormone TherapytamoxiphenSD
CCPG1SNVMissense_Mutationc.536N>Ap.Arg179Hisp.R179HQ9ULG6protein_codingdeleterious(0)probably_damaging(0.999)TCGA-E9-A5FL-01Breastbreast invasive carcinomaFemale>=65I/IIUnknownUnknownSD
CCPG1insertionFrame_Shift_Insnovelc.836_837insCTCAGAAAACGAACCTTGCTACp.Lys279AsnfsTer19p.K279Nfs*19Q9ULG6protein_codingTCGA-A2-A0T2-01Breastbreast invasive carcinomaFemale>=65III/IVChemotherapyxelodaPD
CCPG1insertionFrame_Shift_Insnovelc.1931_1932insAATCCTTATCTTAGGGATACTTGAACACAAACACTGTGGTAGGAp.Phe644LeufsTer20p.F644Lfs*20Q9ULG6protein_codingTCGA-AR-A0TY-01Breastbreast invasive carcinomaFemale<65I/IIUnspecificPaclitaxelPD
CCPG1SNVMissense_Mutationc.121N>Ap.Glu41Lysp.E41KQ9ULG6protein_codingdeleterious(0.04)possibly_damaging(0.773)TCGA-C5-A7CL-01Cervixcervical & endocervical cancerFemale<65III/IVChemotherapycisplatinPD
CCPG1SNVMissense_Mutationc.563C>Tp.Ser188Leup.S188LQ9ULG6protein_codingdeleterious(0.02)probably_damaging(0.952)TCGA-DR-A0ZM-01Cervixcervical & endocervical cancerFemale<65III/IVUnspecificCisplatinSD
CCPG1SNVMissense_Mutationc.1183G>Tp.Ala395Serp.A395SQ9ULG6protein_codingtolerated(0.21)benign(0.432)TCGA-DS-A0VM-01Cervixcervical & endocervical cancerFemale<65I/IIChemotherapycisplatinPD
Page: 1 2 3 4 5 6 7 8 9 

Top

Related drugs of malignant transformation related genes

check buttonIdentification of chemicals and drugs interact with genes involved in malignant transfromation
(DGIdb 4.0)
Entrez IDSymbolCategoryInteraction TypesDrug Claim NameDrug NamePMIDs
Page: 1