
|
|||||
|
 | |
| |
| |
| |
| |
| |
|
Gene: CCNYL1 |
Gene summary for CCNYL1 |
| Gene information | Species | Human | Gene symbol | CCNYL1 | Gene ID | 151195 |
| Gene name | cyclin Y like 1 | |
| Gene Alias | CCNYL1 | |
| Cytomap | 2q33.3 | |
| Gene Type | protein-coding | GO ID | GO:0001932 | UniProtAcc | Q8N7R7 |
Top |
Malignant transformation analysis |
| Identification of the aberrant gene expression in precancerous and cancerous lesions by comparing the gene expression of stem-like cells in diseased tissues with normal stem cells |
| Entrez ID | Symbol | Replicates | Species | Organ | Tissue | Adj P-value | Log2FC | Malignancy |
| 151195 | CCNYL1 | CA_HPV_2 | Human | Cervix | CC | 1.68e-03 | 1.16e-01 | 0.0391 |
| 151195 | CCNYL1 | CCI_2 | Human | Cervix | CC | 6.07e-05 | 9.12e-01 | 0.5249 |
| 151195 | CCNYL1 | CCI_3 | Human | Cervix | CC | 6.51e-04 | 5.56e-01 | 0.516 |
| 151195 | CCNYL1 | Tumor | Human | Cervix | CC | 2.09e-02 | 1.11e-01 | 0.1241 |
| 151195 | CCNYL1 | sample3 | Human | Cervix | CC | 1.22e-04 | 1.73e-01 | 0.1387 |
| 151195 | CCNYL1 | T3 | Human | Cervix | CC | 3.59e-05 | 1.62e-01 | 0.1389 |
| 151195 | CCNYL1 | HTA11_347_2000001011 | Human | Colorectum | AD | 6.95e-18 | 6.20e-01 | -0.1954 |
| 151195 | CCNYL1 | A015-C-203 | Human | Colorectum | FAP | 1.35e-09 | -2.00e-01 | -0.1294 |
| 151195 | CCNYL1 | A002-C-201 | Human | Colorectum | FAP | 9.94e-03 | -1.99e-01 | 0.0324 |
| 151195 | CCNYL1 | A002-C-203 | Human | Colorectum | FAP | 5.79e-04 | -1.84e-01 | 0.2786 |
| 151195 | CCNYL1 | A001-C-108 | Human | Colorectum | FAP | 8.12e-04 | -1.41e-01 | -0.0272 |
| 151195 | CCNYL1 | A002-C-205 | Human | Colorectum | FAP | 2.62e-03 | -2.08e-01 | -0.1236 |
| 151195 | CCNYL1 | A015-C-006 | Human | Colorectum | FAP | 1.51e-02 | -2.38e-01 | -0.0994 |
| 151195 | CCNYL1 | A015-C-106 | Human | Colorectum | FAP | 1.75e-05 | -1.93e-01 | -0.0511 |
| 151195 | CCNYL1 | A002-C-114 | Human | Colorectum | FAP | 3.47e-02 | -1.90e-01 | -0.1561 |
| 151195 | CCNYL1 | A015-C-104 | Human | Colorectum | FAP | 6.38e-10 | -1.96e-01 | -0.1899 |
| 151195 | CCNYL1 | A001-C-014 | Human | Colorectum | FAP | 6.48e-04 | -1.58e-01 | 0.0135 |
| 151195 | CCNYL1 | A002-C-016 | Human | Colorectum | FAP | 2.07e-08 | -2.00e-01 | 0.0521 |
| 151195 | CCNYL1 | A001-C-203 | Human | Colorectum | FAP | 4.66e-03 | -1.45e-01 | -0.0481 |
| 151195 | CCNYL1 | A002-C-116 | Human | Colorectum | FAP | 4.73e-09 | -2.10e-01 | -0.0452 |
| Page: 1 2 3 4 |
| Tissue | Expression Dynamics | Abbreviation |
| Cervix | 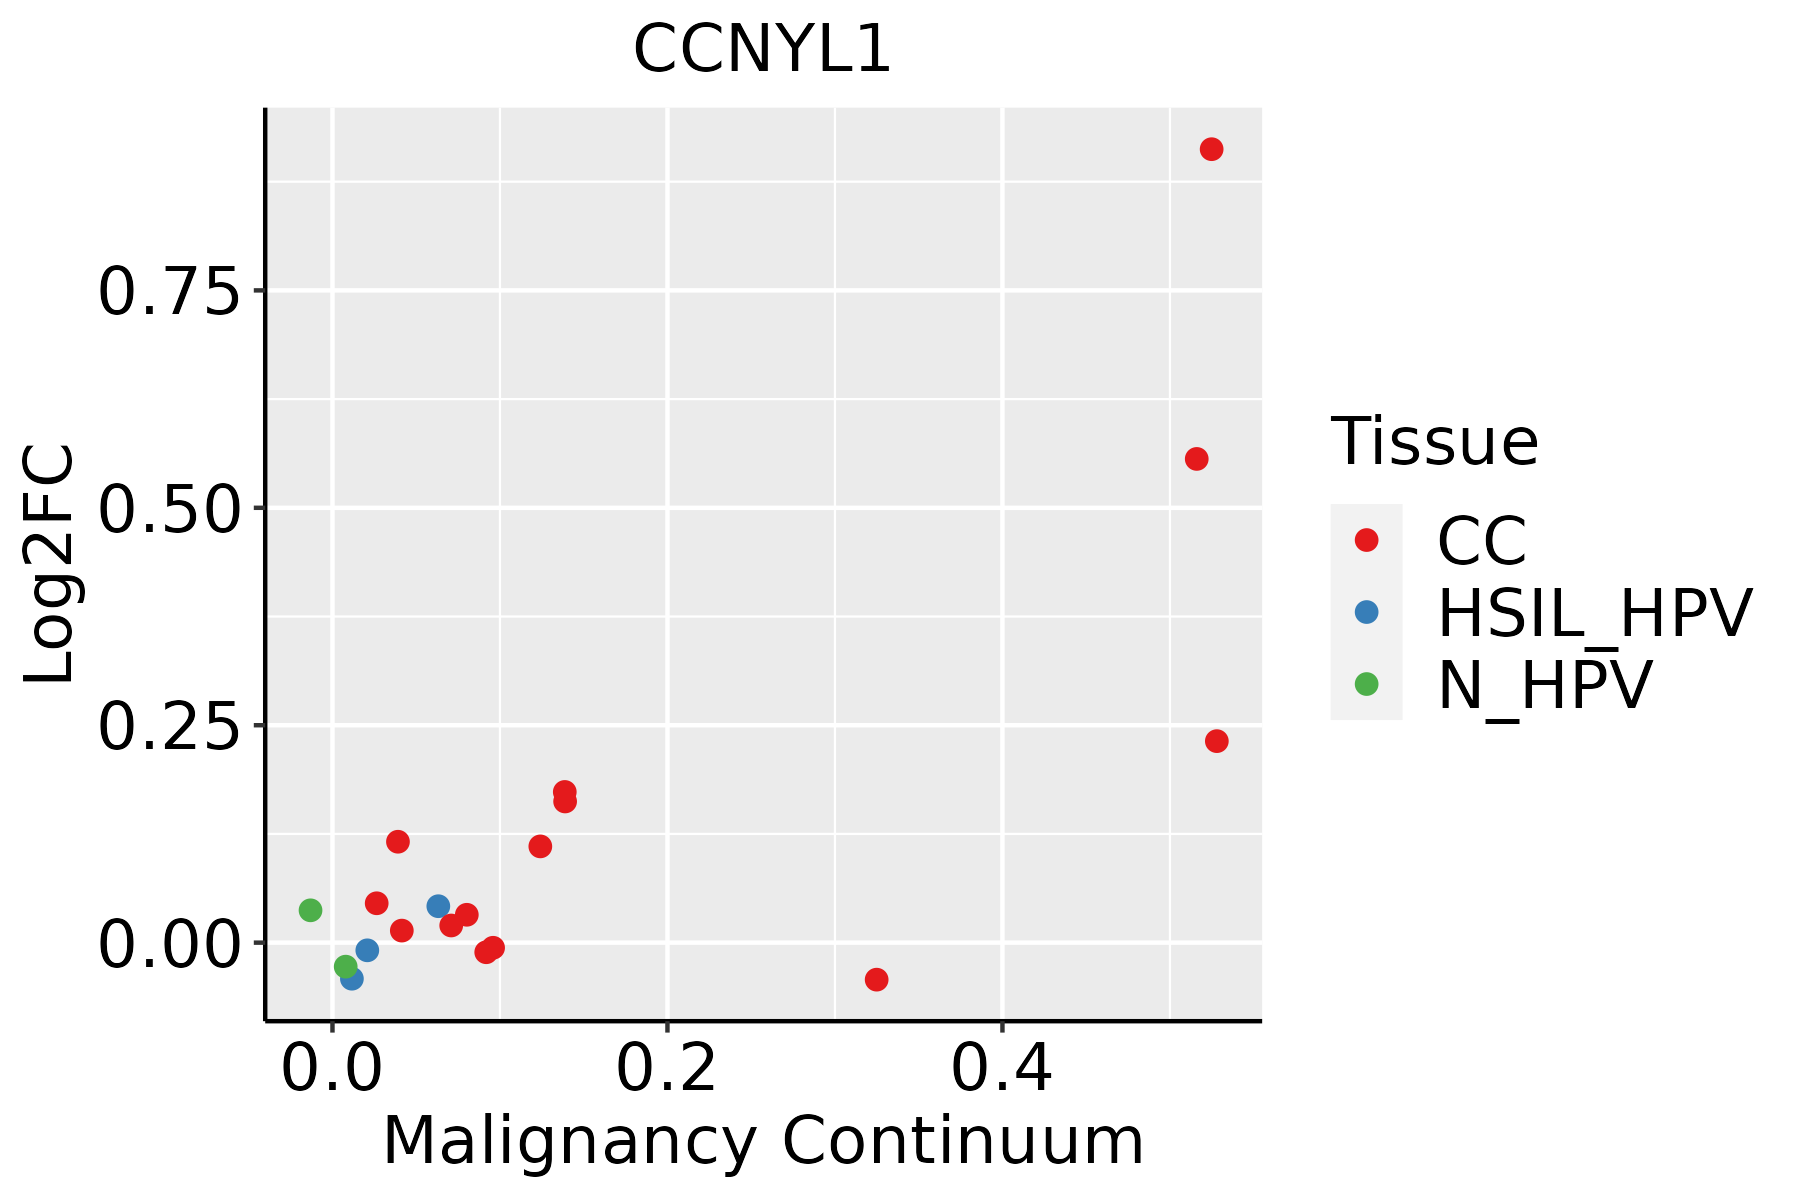 | CC: Cervix cancer |
| HSIL_HPV: HPV-infected high-grade squamous intraepithelial lesions | ||
| N_HPV: HPV-infected normal cervix | ||
| Colorectum (GSE201348) |  | FAP: Familial adenomatous polyposis |
| CRC: Colorectal cancer | ||
| Colorectum (HTA11) |  | AD: Adenomas |
| SER: Sessile serrated lesions | ||
| MSI-H: Microsatellite-high colorectal cancer | ||
| MSS: Microsatellite stable colorectal cancer | ||
| Esophagus |  | ESCC: Esophageal squamous cell carcinoma |
| HGIN: High-grade intraepithelial neoplasias | ||
| LGIN: Low-grade intraepithelial neoplasias | ||
| Prostate |  | BPH: Benign Prostatic Hyperplasia |
| ∗log2FC in expression of this searched gene in stem-like cells from each diseased tissue sample relative to stem-like cells in normal samples in each tissue plotted against the malignancy continuum. Samples are colored based on if they are from different disease stage. |
Top |
Malignant transformation related pathway analysis |
| Find out the enriched GO biological processes and KEGG pathways involved in transition from healthy to precancer to cancer |
| Tissue | Disease Stage | Enriched GO biological Processes |
| Colorectum | AD |  |
| Colorectum | SER |  |
| Colorectum | MSS |  |
| Colorectum | MSI-H |  |
| Colorectum | FAP |  |
| ∗Top 15 enriched GO BP terms are showed in the bar plot of each disease state in each tissue. Each row represents a significant GO biological process which is colored according to the -log10(p.adjust). |
| Page: 1 2 3 4 5 6 7 8 9 |
| GO ID | Tissue | Disease Stage | Description | Gene Ratio | Bg Ratio | pvalue | p.adjust | Count |
| GO:00160557 | Cervix | CC | Wnt signaling pathway | 98/2311 | 444/18723 | 4.82e-09 | 4.65e-07 | 98 |
| GO:01987387 | Cervix | CC | cell-cell signaling by wnt | 98/2311 | 446/18723 | 6.16e-09 | 5.58e-07 | 98 |
| GO:00301117 | Cervix | CC | regulation of Wnt signaling pathway | 76/2311 | 328/18723 | 3.05e-08 | 2.08e-06 | 76 |
| GO:00608287 | Cervix | CC | regulation of canonical Wnt signaling pathway | 58/2311 | 253/18723 | 1.83e-06 | 5.89e-05 | 58 |
| GO:00600707 | Cervix | CC | canonical Wnt signaling pathway | 66/2311 | 303/18723 | 2.47e-06 | 7.35e-05 | 66 |
| GO:0030111 | Colorectum | AD | regulation of Wnt signaling pathway | 102/3918 | 328/18723 | 8.51e-06 | 2.03e-04 | 102 |
| GO:0016055 | Colorectum | AD | Wnt signaling pathway | 130/3918 | 444/18723 | 1.60e-05 | 3.37e-04 | 130 |
| GO:0198738 | Colorectum | AD | cell-cell signaling by wnt | 130/3918 | 446/18723 | 2.02e-05 | 4.10e-04 | 130 |
| GO:0060070 | Colorectum | AD | canonical Wnt signaling pathway | 90/3918 | 303/18723 | 1.76e-04 | 2.38e-03 | 90 |
| GO:0060828 | Colorectum | AD | regulation of canonical Wnt signaling pathway | 77/3918 | 253/18723 | 2.19e-04 | 2.87e-03 | 77 |
| GO:00160553 | Colorectum | FAP | Wnt signaling pathway | 104/2622 | 444/18723 | 4.92e-08 | 3.92e-06 | 104 |
| GO:01987383 | Colorectum | FAP | cell-cell signaling by wnt | 104/2622 | 446/18723 | 6.26e-08 | 4.54e-06 | 104 |
| GO:00301113 | Colorectum | FAP | regulation of Wnt signaling pathway | 81/2622 | 328/18723 | 1.44e-07 | 9.03e-06 | 81 |
| GO:00608283 | Colorectum | FAP | regulation of canonical Wnt signaling pathway | 62/2622 | 253/18723 | 5.26e-06 | 1.69e-04 | 62 |
| GO:00600703 | Colorectum | FAP | canonical Wnt signaling pathway | 71/2622 | 303/18723 | 6.23e-06 | 1.96e-04 | 71 |
| GO:00160554 | Colorectum | CRC | Wnt signaling pathway | 88/2078 | 444/18723 | 3.91e-08 | 5.28e-06 | 88 |
| GO:01987384 | Colorectum | CRC | cell-cell signaling by wnt | 88/2078 | 446/18723 | 4.85e-08 | 6.04e-06 | 88 |
| GO:00301114 | Colorectum | CRC | regulation of Wnt signaling pathway | 68/2078 | 328/18723 | 2.41e-07 | 2.27e-05 | 68 |
| GO:00608284 | Colorectum | CRC | regulation of canonical Wnt signaling pathway | 52/2078 | 253/18723 | 7.85e-06 | 2.85e-04 | 52 |
| GO:00600704 | Colorectum | CRC | canonical Wnt signaling pathway | 59/2078 | 303/18723 | 1.15e-05 | 3.74e-04 | 59 |
| Page: 1 2 |
| Pathway ID | Tissue | Disease Stage | Description | Gene Ratio | Bg Ratio | pvalue | p.adjust | qvalue | Count |
| Page: 1 |
Top |
Cell-cell communication analysis |
| Identification of potential cell-cell interactions between two cell types and their ligand-receptor pairs for different disease states |
| Ligand | Receptor | LRpair | Pathway | Tissue | Disease Stage |
| Page: 1 |
Top |
Single-cell gene regulatory network inference analysis |
| Find out the significant the regulons (TFs) and the target genes of each regulon across cell types for different disease states |
| TF | Cell Type | Tissue | Disease Stage | Target Gene | RSS | Regulon Activity |
| ∗The dot plots of a searched regulon are shown for all cell subpopulations in each disease state of each tissue based on the regulon specific score inferred using pySCENIC and by calculating the average expression. |
| Page: 1 |
Top |
Somatic mutation of malignant transformation related genes |
| Annotation of somatic variants for genes involved in malignant transformation |
| Hugo Symbol | Variant Class | Variant Classification | dbSNP RS | HGVSc | HGVSp | HGVSp Short | SWISSPROT | BIOTYPE | SIFT | PolyPhen | Tumor Sample Barcode | Tissue | Histology | Sex | Age | Stage | Therapy Types | Drugs | Outcome |
| CCNYL1 | SNV | Missense_Mutation | c.320N>C | p.His107Pro | p.H107P | Q8N7R7 | protein_coding | deleterious(0.04) | benign(0.418) | TCGA-AN-A0AM-01 | Breast | breast invasive carcinoma | Female | <65 | I/II | Unknown | Unknown | SD | |
| CCNYL1 | SNV | Missense_Mutation | novel | c.406C>T | p.Pro136Ser | p.P136S | Q8N7R7 | protein_coding | deleterious(0.04) | probably_damaging(0.995) | TCGA-EW-A6SC-01 | Breast | breast invasive carcinoma | Female | <65 | I/II | Hormone Therapy | aromatase | SD |
| CCNYL1 | insertion | Nonsense_Mutation | novel | c.600_601insACTTAGGCCA | p.Ala201ThrfsTer2 | p.A201Tfs*2 | Q8N7R7 | protein_coding | TCGA-A2-A0CU-01 | Breast | breast invasive carcinoma | Female | >=65 | I/II | Hormone Therapy | tamoxiphen | SD | ||
| CCNYL1 | insertion | Frame_Shift_Ins | novel | c.589_590insAGACTTTCGAGCCTACAAGTAGTTTACATTTTGATAGAATT | p.Thr197LysfsTer22 | p.T197Kfs*22 | Q8N7R7 | protein_coding | TCGA-B6-A0RE-01 | Breast | breast invasive carcinoma | Female | <65 | I/II | Unknown | Unknown | SD | ||
| CCNYL1 | deletion | Frame_Shift_Del | novel | c.643delT | p.Tyr215ThrfsTer2 | p.Y215Tfs*2 | Q8N7R7 | protein_coding | TCGA-D8-A27V-01 | Breast | breast invasive carcinoma | Female | <65 | I/II | Hormone Therapy | tamoxiphen | SD | ||
| CCNYL1 | SNV | Missense_Mutation | novel | c.803A>G | p.Asp268Gly | p.D268G | Q8N7R7 | protein_coding | deleterious(0) | possibly_damaging(0.895) | TCGA-AA-3949-01 | Colorectum | colon adenocarcinoma | Female | >=65 | III/IV | Unknown | Unknown | SD |
| CCNYL1 | SNV | Missense_Mutation | c.799N>A | p.Glu267Lys | p.E267K | Q8N7R7 | protein_coding | tolerated(0.19) | benign(0.042) | TCGA-AZ-6599-01 | Colorectum | colon adenocarcinoma | Male | >=65 | I/II | Unknown | Unknown | SD | |
| CCNYL1 | SNV | Missense_Mutation | novel | c.586N>T | p.Arg196Cys | p.R196C | Q8N7R7 | protein_coding | tolerated(0.1) | probably_damaging(0.989) | TCGA-A5-A0G2-01 | Endometrium | uterine corpus endometrioid carcinoma | Female | <65 | III/IV | Unknown | Unknown | SD |
| CCNYL1 | SNV | Missense_Mutation | novel | c.757N>C | p.Trp253Arg | p.W253R | Q8N7R7 | protein_coding | deleterious(0.02) | probably_damaging(0.938) | TCGA-B5-A3FA-01 | Endometrium | uterine corpus endometrioid carcinoma | Female | >=65 | I/II | Unknown | Unknown | SD |
| CCNYL1 | SNV | Missense_Mutation | novel | c.419N>T | p.Thr140Ile | p.T140I | Q8N7R7 | protein_coding | tolerated(0.38) | benign(0.007) | TCGA-B5-A3FC-01 | Endometrium | uterine corpus endometrioid carcinoma | Female | <65 | I/II | Unknown | Unknown | SD |
| Page: 1 2 3 |
Top |
Related drugs of malignant transformation related genes |
| Identification of chemicals and drugs interact with genes involved in malignant transfromation |
| (DGIdb 4.0) |
| Entrez ID | Symbol | Category | Interaction Types | Drug Claim Name | Drug Name | PMIDs |
| Page: 1 |

Copyright 2023-Present -The University of Texas Health Science Center at Houston |