
|
|||||
|
 | |
| |
| |
| |
| |
| |
|
Gene: CCNO |
Gene summary for CCNO |
| Gene information | Species | Human | Gene symbol | CCNO | Gene ID | 10309 |
| Gene name | cyclin O | |
| Gene Alias | CCNU | |
| Cytomap | 5q11.2 | |
| Gene Type | protein-coding | GO ID | GO:0000079 | UniProtAcc | P22674 |
Top |
Malignant transformation analysis |
| Identification of the aberrant gene expression in precancerous and cancerous lesions by comparing the gene expression of stem-like cells in diseased tissues with normal stem cells |
| Entrez ID | Symbol | Replicates | Species | Organ | Tissue | Adj P-value | Log2FC | Malignancy |
| 10309 | CCNO | P2T-E | Human | Esophagus | ESCC | 1.91e-07 | 1.33e-01 | 0.1177 |
| 10309 | CCNO | P4T-E | Human | Esophagus | ESCC | 3.09e-03 | 1.54e-01 | 0.1323 |
| 10309 | CCNO | P5T-E | Human | Esophagus | ESCC | 2.14e-15 | 4.13e-01 | 0.1327 |
| 10309 | CCNO | P8T-E | Human | Esophagus | ESCC | 2.49e-39 | 1.13e+00 | 0.0889 |
| 10309 | CCNO | P9T-E | Human | Esophagus | ESCC | 1.06e-02 | 1.06e-01 | 0.1131 |
| 10309 | CCNO | P10T-E | Human | Esophagus | ESCC | 2.52e-10 | 8.72e-02 | 0.116 |
| 10309 | CCNO | P16T-E | Human | Esophagus | ESCC | 8.78e-10 | 2.16e-01 | 0.1153 |
| 10309 | CCNO | P20T-E | Human | Esophagus | ESCC | 8.29e-09 | 2.09e-01 | 0.1124 |
| 10309 | CCNO | P21T-E | Human | Esophagus | ESCC | 4.82e-09 | 1.65e-01 | 0.1617 |
| 10309 | CCNO | P22T-E | Human | Esophagus | ESCC | 6.89e-06 | 1.63e-01 | 0.1236 |
| 10309 | CCNO | P23T-E | Human | Esophagus | ESCC | 3.83e-08 | 2.47e-01 | 0.108 |
| 10309 | CCNO | P24T-E | Human | Esophagus | ESCC | 3.16e-02 | 3.45e-02 | 0.1287 |
| 10309 | CCNO | P26T-E | Human | Esophagus | ESCC | 7.49e-06 | 1.19e-01 | 0.1276 |
| 10309 | CCNO | P27T-E | Human | Esophagus | ESCC | 3.97e-10 | 1.98e-01 | 0.1055 |
| 10309 | CCNO | P28T-E | Human | Esophagus | ESCC | 6.59e-11 | 1.75e-01 | 0.1149 |
| 10309 | CCNO | P30T-E | Human | Esophagus | ESCC | 2.31e-02 | 1.52e-01 | 0.137 |
| 10309 | CCNO | P31T-E | Human | Esophagus | ESCC | 1.78e-03 | 1.06e-01 | 0.1251 |
| 10309 | CCNO | P37T-E | Human | Esophagus | ESCC | 1.11e-11 | 1.41e-01 | 0.1371 |
| 10309 | CCNO | P42T-E | Human | Esophagus | ESCC | 1.83e-05 | 1.29e-01 | 0.1175 |
| 10309 | CCNO | P47T-E | Human | Esophagus | ESCC | 3.06e-02 | 2.98e-02 | 0.1067 |
| Page: 1 2 |
| Tissue | Expression Dynamics | Abbreviation |
| Esophagus | 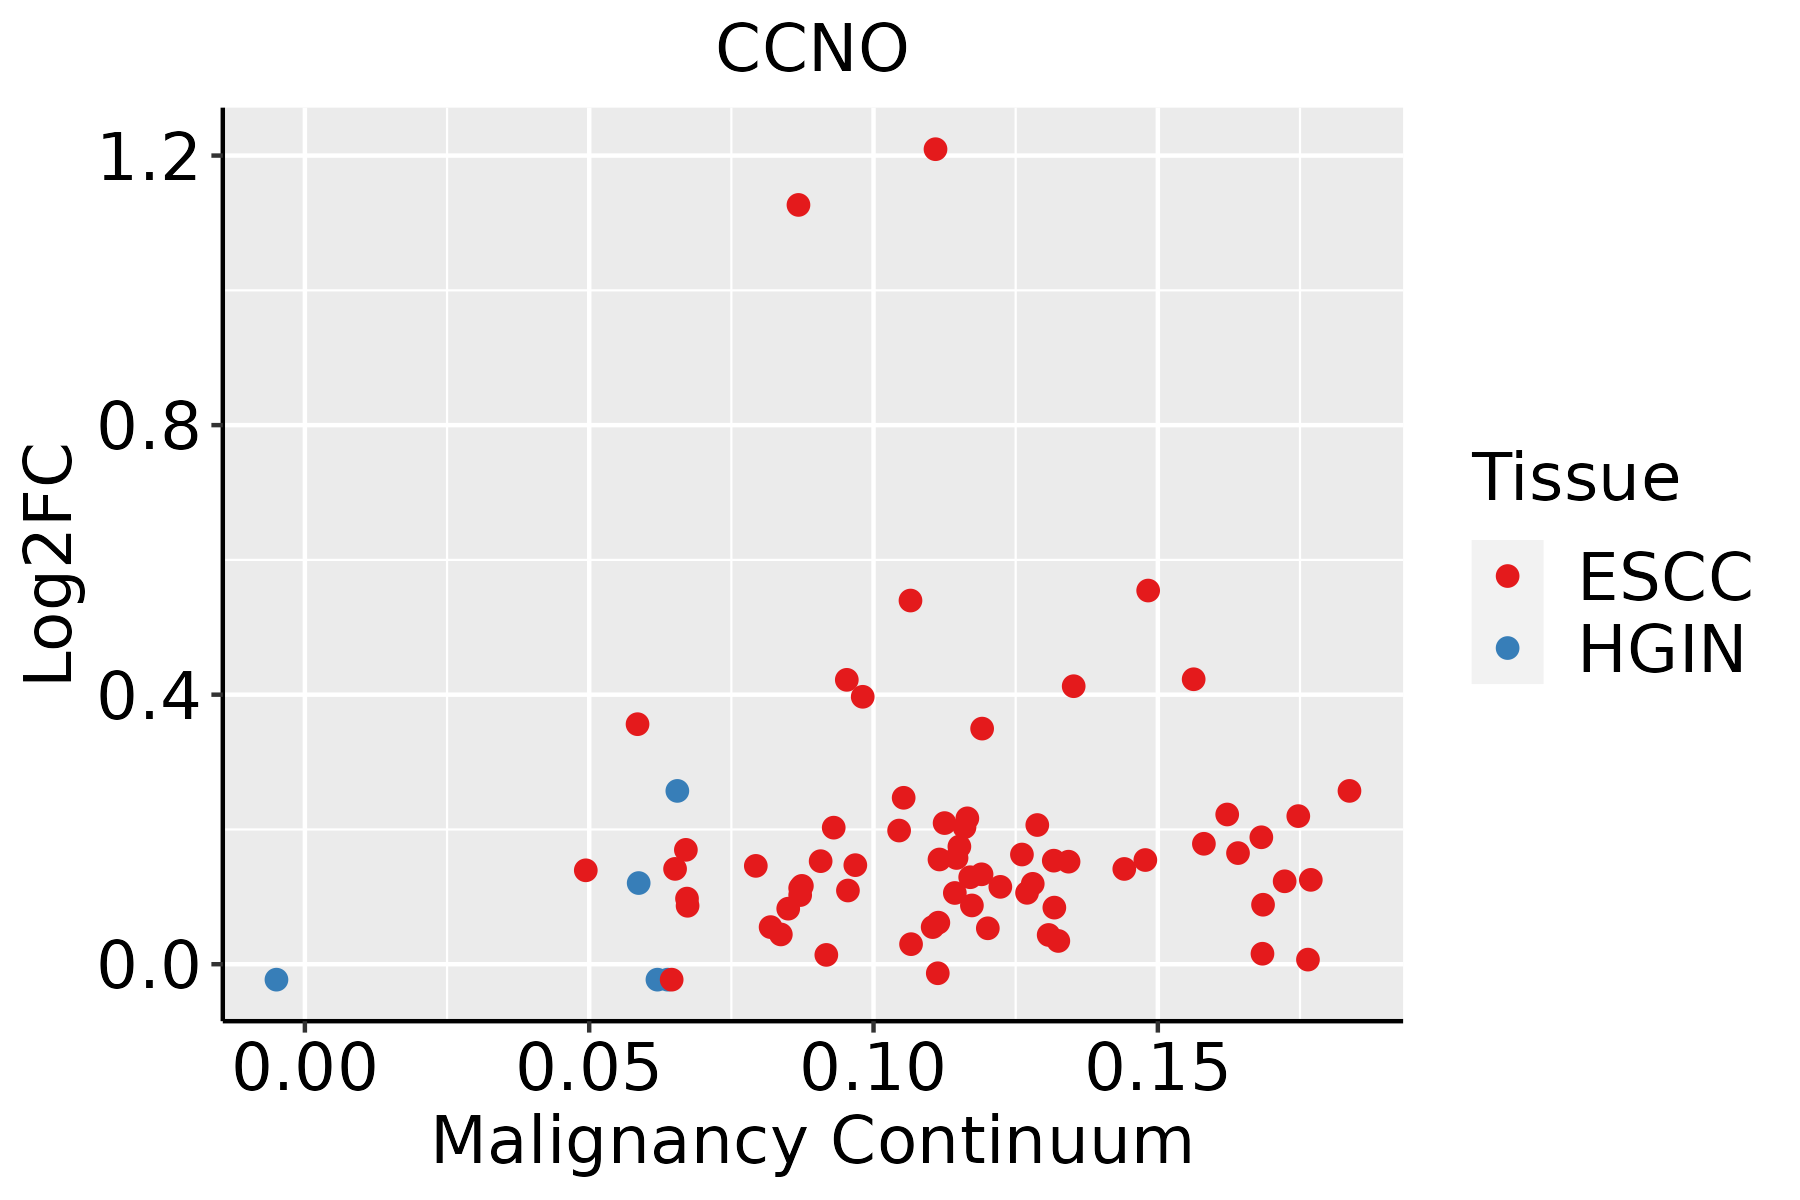 | ESCC: Esophageal squamous cell carcinoma |
| HGIN: High-grade intraepithelial neoplasias | ||
| LGIN: Low-grade intraepithelial neoplasias |
| ∗log2FC in expression of this searched gene in stem-like cells from each diseased tissue sample relative to stem-like cells in normal samples in each tissue plotted against the malignancy continuum. Samples are colored based on if they are from different disease stage. |
Top |
Malignant transformation related pathway analysis |
| Find out the enriched GO biological processes and KEGG pathways involved in transition from healthy to precancer to cancer |
| Tissue | Disease Stage | Enriched GO biological Processes |
| Colorectum | AD |  |
| Colorectum | SER |  |
| Colorectum | MSS |  |
| Colorectum | MSI-H |  |
| Colorectum | FAP |  |
| ∗Top 15 enriched GO BP terms are showed in the bar plot of each disease state in each tissue. Each row represents a significant GO biological process which is colored according to the -log10(p.adjust). |
| Page: 1 2 3 4 5 6 7 8 9 |
| GO ID | Tissue | Disease Stage | Description | Gene Ratio | Bg Ratio | pvalue | p.adjust | Count |
| GO:004477216 | Esophagus | ESCC | mitotic cell cycle phase transition | 281/8552 | 424/18723 | 4.63e-18 | 4.45e-16 | 281 |
| GO:007190016 | Esophagus | ESCC | regulation of protein serine/threonine kinase activity | 227/8552 | 359/18723 | 1.12e-11 | 4.10e-10 | 227 |
| GO:19040294 | Esophagus | ESCC | regulation of cyclin-dependent protein kinase activity | 69/8552 | 98/18723 | 6.04e-07 | 7.91e-06 | 69 |
| GO:00000794 | Esophagus | ESCC | regulation of cyclin-dependent protein serine/threonine kinase activity | 66/8552 | 94/18723 | 1.24e-06 | 1.53e-05 | 66 |
| GO:000941020 | Esophagus | ESCC | response to xenobiotic stimulus | 253/8552 | 462/18723 | 4.55e-05 | 3.58e-04 | 253 |
| Page: 1 |
| Pathway ID | Tissue | Disease Stage | Description | Gene Ratio | Bg Ratio | pvalue | p.adjust | qvalue | Count |
| Page: 1 |
Top |
Cell-cell communication analysis |
| Identification of potential cell-cell interactions between two cell types and their ligand-receptor pairs for different disease states |
| Ligand | Receptor | LRpair | Pathway | Tissue | Disease Stage |
| Page: 1 |
Top |
Single-cell gene regulatory network inference analysis |
| Find out the significant the regulons (TFs) and the target genes of each regulon across cell types for different disease states |
| TF | Cell Type | Tissue | Disease Stage | Target Gene | RSS | Regulon Activity |
| ∗The dot plots of a searched regulon are shown for all cell subpopulations in each disease state of each tissue based on the regulon specific score inferred using pySCENIC and by calculating the average expression. |
| Page: 1 |
Top |
Somatic mutation of malignant transformation related genes |
| Annotation of somatic variants for genes involved in malignant transformation |
| Hugo Symbol | Variant Class | Variant Classification | dbSNP RS | HGVSc | HGVSp | HGVSp Short | SWISSPROT | BIOTYPE | SIFT | PolyPhen | Tumor Sample Barcode | Tissue | Histology | Sex | Age | Stage | Therapy Types | Drugs | Outcome |
| CCNO | deletion | Frame_Shift_Del | novel | c.990delN | p.Leu331Ter | p.L331* | P22674 | protein_coding | TCGA-AC-A3QQ-01 | Breast | breast invasive carcinoma | Female | <65 | I/II | Unknown | Unknown | SD | ||
| CCNO | SNV | Missense_Mutation | novel | c.829N>C | p.Ser277Arg | p.S277R | P22674 | protein_coding | tolerated(0.33) | benign(0.003) | TCGA-AA-3947-01 | Colorectum | colon adenocarcinoma | Female | <65 | I/II | Unknown | Unknown | SD |
| CCNO | deletion | Frame_Shift_Del | rs756680122 | c.248_252delNNNNN | p.Leu83ArgfsTer51 | p.L83Rfs*51 | P22674 | protein_coding | TCGA-CM-5861-01 | Colorectum | colon adenocarcinoma | Female | <65 | I/II | Unknown | Unknown | PD | ||
| CCNO | deletion | Frame_Shift_Del | c.793delG | p.Val265TrpfsTer4 | p.V265Wfs*4 | P22674 | protein_coding | TCGA-NH-A5IV-01 | Colorectum | colon adenocarcinoma | Female | >=65 | I/II | Unknown | Unknown | SD | |||
| CCNO | SNV | Missense_Mutation | c.525N>A | p.Phe175Leu | p.F175L | P22674 | protein_coding | tolerated(0.29) | possibly_damaging(0.735) | TCGA-AP-A059-01 | Endometrium | uterine corpus endometrioid carcinoma | Female | >=65 | I/II | Unknown | Unknown | SD | |
| CCNO | SNV | Missense_Mutation | rs754329141 | c.970N>A | p.Val324Met | p.V324M | P22674 | protein_coding | deleterious(0) | probably_damaging(1) | TCGA-AP-A05N-01 | Endometrium | uterine corpus endometrioid carcinoma | Female | <65 | I/II | Unknown | Unknown | SD |
| CCNO | SNV | Missense_Mutation | novel | c.542N>T | p.Thr181Ile | p.T181I | P22674 | protein_coding | deleterious(0) | probably_damaging(0.93) | TCGA-AP-A05O-01 | Endometrium | uterine corpus endometrioid carcinoma | Female | >=65 | I/II | Chemotherapy | carboplatin | PD |
| CCNO | SNV | Missense_Mutation | novel | c.935C>T | p.Ala312Val | p.A312V | P22674 | protein_coding | tolerated(0.44) | benign(0) | TCGA-AP-A0LM-01 | Endometrium | uterine corpus endometrioid carcinoma | Female | <65 | III/IV | Chemotherapy | cisplatin | SD |
| CCNO | SNV | Missense_Mutation | novel | c.1046N>T | p.Ser349Leu | p.S349L | P22674 | protein_coding | tolerated_low_confidence(1) | benign(0) | TCGA-AX-A2HA-01 | Endometrium | uterine corpus endometrioid carcinoma | Female | <65 | I/II | Unknown | Unknown | SD |
| CCNO | SNV | Missense_Mutation | c.701N>A | p.Ser234Asn | p.S234N | P22674 | protein_coding | tolerated(0.44) | benign(0.007) | TCGA-D1-A15X-01 | Endometrium | uterine corpus endometrioid carcinoma | Female | <65 | I/II | Unknown | Unknown | SD |
| Page: 1 2 3 |
Top |
Related drugs of malignant transformation related genes |
| Identification of chemicals and drugs interact with genes involved in malignant transfromation |
| (DGIdb 4.0) |
| Entrez ID | Symbol | Category | Interaction Types | Drug Claim Name | Drug Name | PMIDs |
| Page: 1 |

Copyright 2023-Present -The University of Texas Health Science Center at Houston |