
|
|||||
|
 | |
| |
| |
| |
| |
| |
|
Gene: CCNL1 |
Gene summary for CCNL1 |
| Gene information | Species | Human | Gene symbol | CCNL1 | Gene ID | 57018 |
| Gene name | cyclin L1 | |
| Gene Alias | ANIA6A | |
| Cytomap | 3q25.31 | |
| Gene Type | protein-coding | GO ID | GO:0000079 | UniProtAcc | Q9UK58 |
Top |
Malignant transformation analysis |
| Identification of the aberrant gene expression in precancerous and cancerous lesions by comparing the gene expression of stem-like cells in diseased tissues with normal stem cells |
| Entrez ID | Symbol | Replicates | Species | Organ | Tissue | Adj P-value | Log2FC | Malignancy |
| 57018 | CCNL1 | GSM4909285 | Human | Breast | IDC | 2.56e-08 | 3.22e-01 | 0.21 |
| 57018 | CCNL1 | GSM4909286 | Human | Breast | IDC | 6.14e-06 | -2.60e-01 | 0.1081 |
| 57018 | CCNL1 | GSM4909287 | Human | Breast | IDC | 3.56e-02 | 1.33e-01 | 0.2057 |
| 57018 | CCNL1 | GSM4909288 | Human | Breast | IDC | 3.16e-03 | -5.22e-01 | 0.0988 |
| 57018 | CCNL1 | GSM4909290 | Human | Breast | IDC | 4.82e-06 | -4.06e-01 | 0.2096 |
| 57018 | CCNL1 | GSM4909294 | Human | Breast | IDC | 1.91e-32 | -6.71e-01 | 0.2022 |
| 57018 | CCNL1 | GSM4909296 | Human | Breast | IDC | 2.15e-21 | -5.39e-01 | 0.1524 |
| 57018 | CCNL1 | GSM4909297 | Human | Breast | IDC | 1.17e-21 | -3.65e-01 | 0.1517 |
| 57018 | CCNL1 | GSM4909299 | Human | Breast | IDC | 2.88e-03 | 3.03e-01 | 0.035 |
| 57018 | CCNL1 | GSM4909302 | Human | Breast | IDC | 2.40e-06 | -3.59e-01 | 0.1545 |
| 57018 | CCNL1 | GSM4909304 | Human | Breast | IDC | 2.87e-08 | -4.43e-01 | 0.1636 |
| 57018 | CCNL1 | GSM4909306 | Human | Breast | IDC | 5.90e-04 | -2.68e-01 | 0.1564 |
| 57018 | CCNL1 | GSM4909307 | Human | Breast | IDC | 2.01e-10 | -4.50e-01 | 0.1569 |
| 57018 | CCNL1 | GSM4909311 | Human | Breast | IDC | 3.92e-45 | -6.94e-01 | 0.1534 |
| 57018 | CCNL1 | GSM4909312 | Human | Breast | IDC | 4.18e-15 | -3.64e-01 | 0.1552 |
| 57018 | CCNL1 | GSM4909315 | Human | Breast | IDC | 1.49e-11 | -4.17e-01 | 0.21 |
| 57018 | CCNL1 | GSM4909316 | Human | Breast | IDC | 4.90e-07 | -5.79e-01 | 0.21 |
| 57018 | CCNL1 | GSM4909318 | Human | Breast | IDC | 3.81e-03 | -6.21e-01 | 0.2031 |
| 57018 | CCNL1 | GSM4909319 | Human | Breast | IDC | 9.81e-53 | -7.06e-01 | 0.1563 |
| 57018 | CCNL1 | GSM4909320 | Human | Breast | IDC | 5.87e-09 | -4.80e-01 | 0.1575 |
| Page: 1 2 3 4 5 6 7 8 9 10 11 12 13 14 |
| Tissue | Expression Dynamics | Abbreviation |
| Breast | 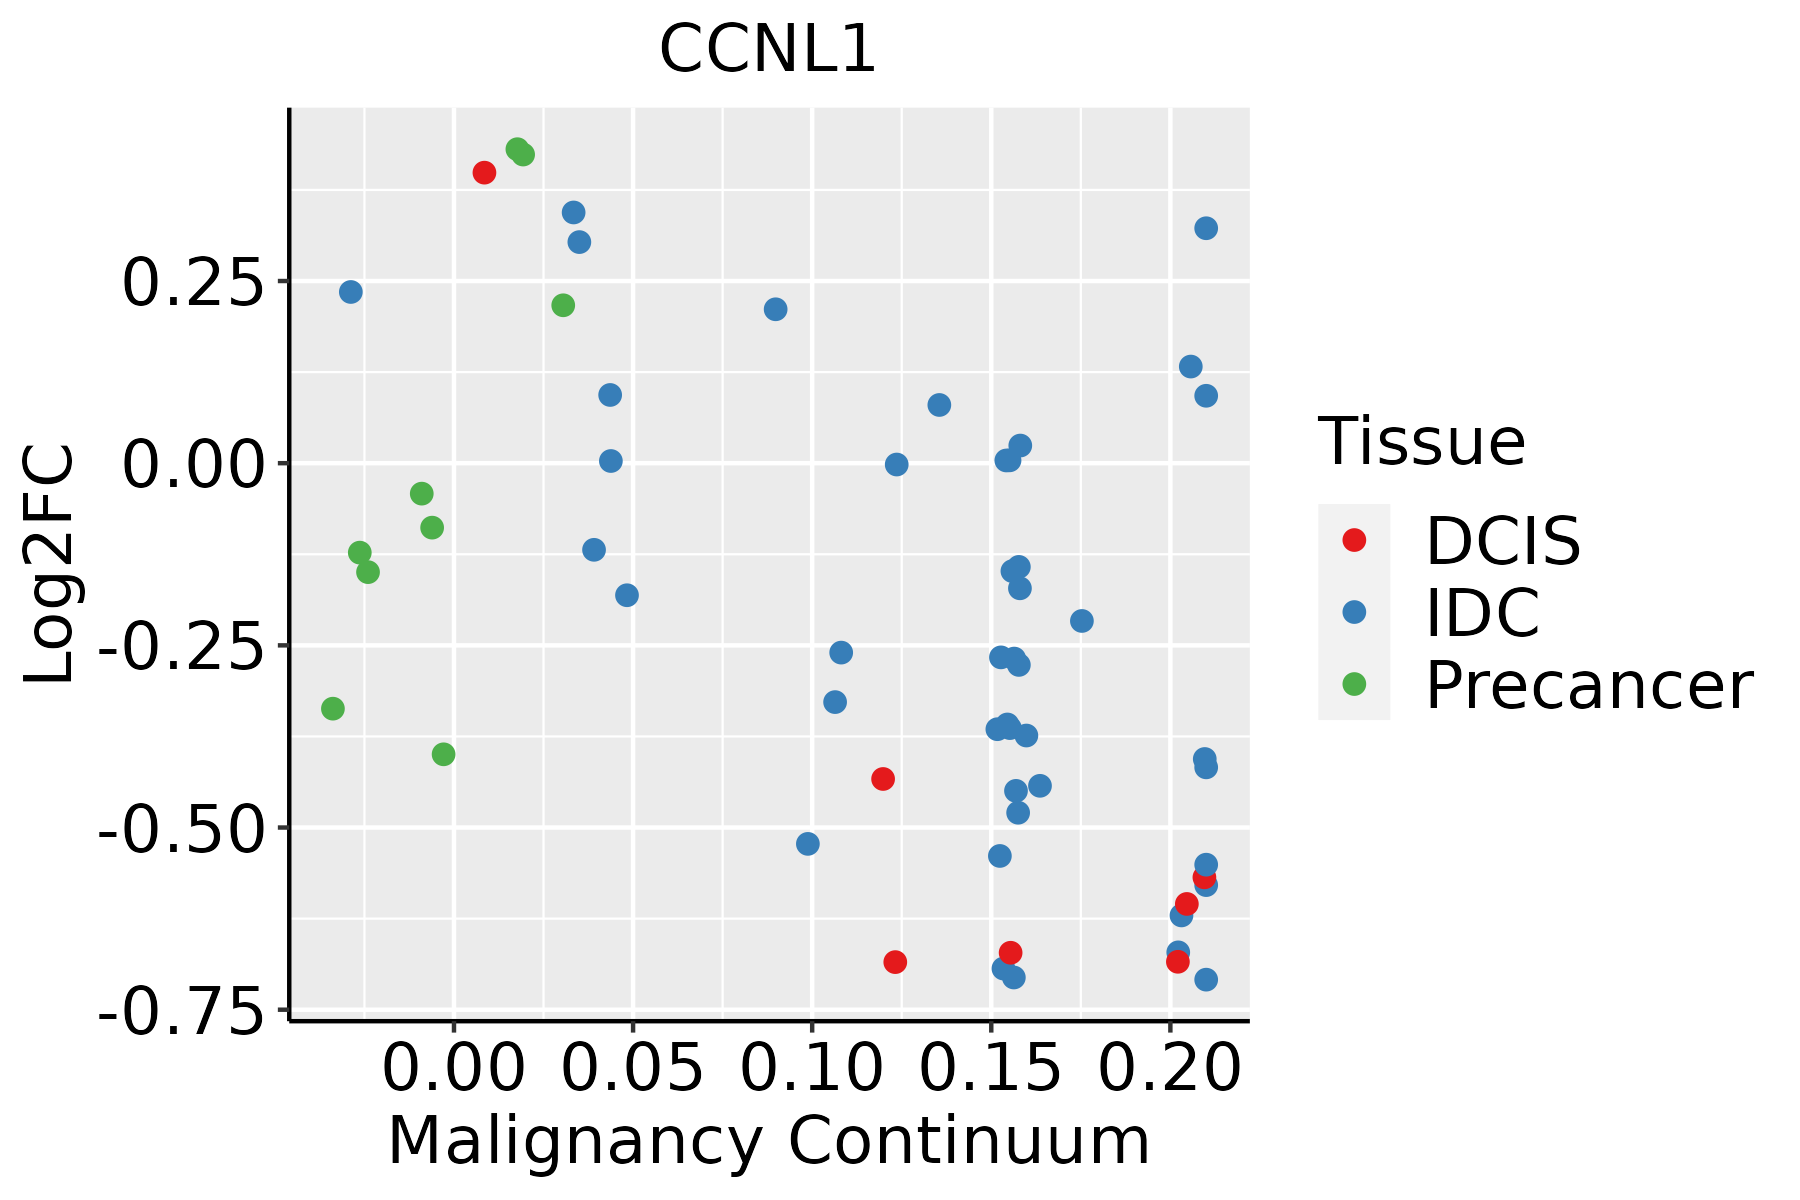 | IDC: Invasive ductal carcinoma |
| DCIS: Ductal carcinoma in situ | ||
| Precancer(BRCA1-mut): Precancerous lesion from BRCA1 mutation carriers | ||
| Cervix | 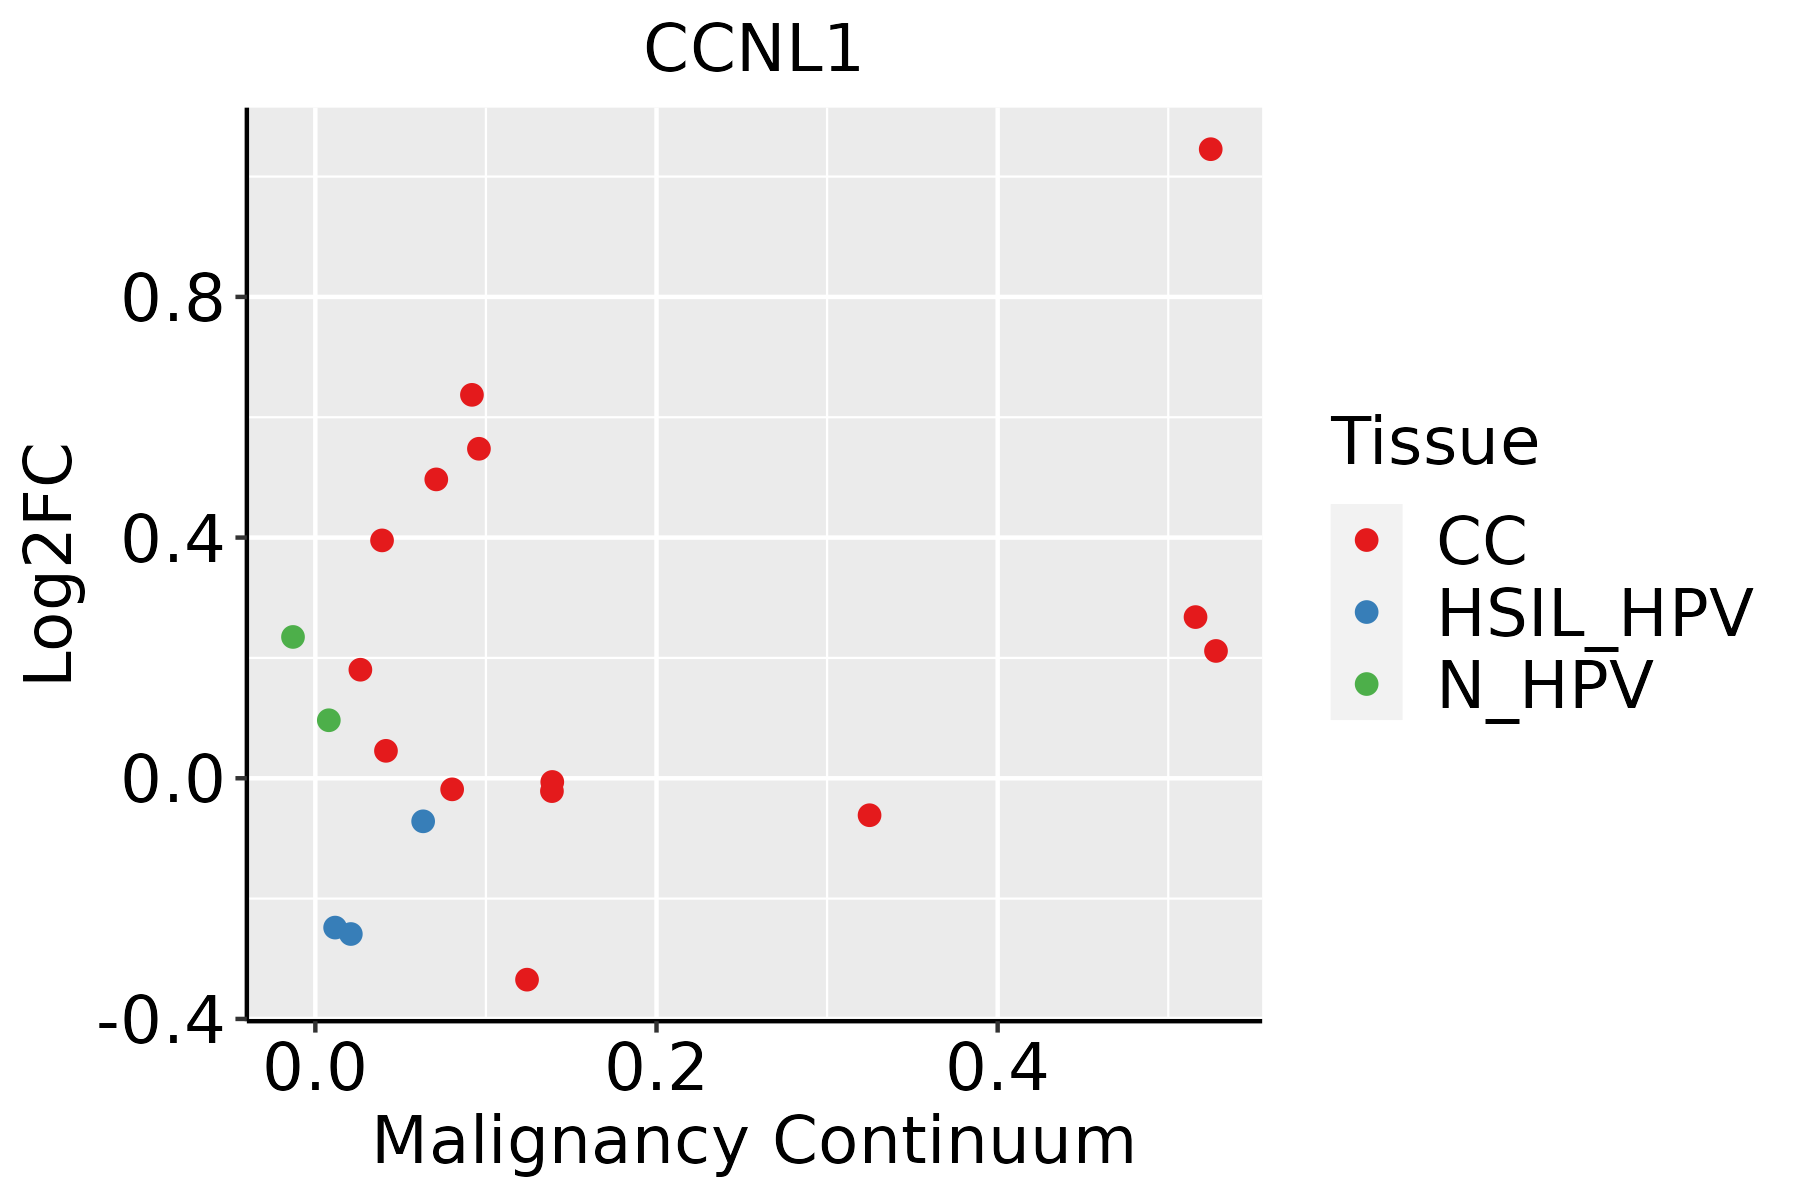 | CC: Cervix cancer |
| HSIL_HPV: HPV-infected high-grade squamous intraepithelial lesions | ||
| N_HPV: HPV-infected normal cervix | ||
| Colorectum (GSE201348) |  | FAP: Familial adenomatous polyposis |
| CRC: Colorectal cancer | ||
| Colorectum (HTA11) |  | AD: Adenomas |
| SER: Sessile serrated lesions | ||
| MSI-H: Microsatellite-high colorectal cancer | ||
| MSS: Microsatellite stable colorectal cancer | ||
| Endometrium | 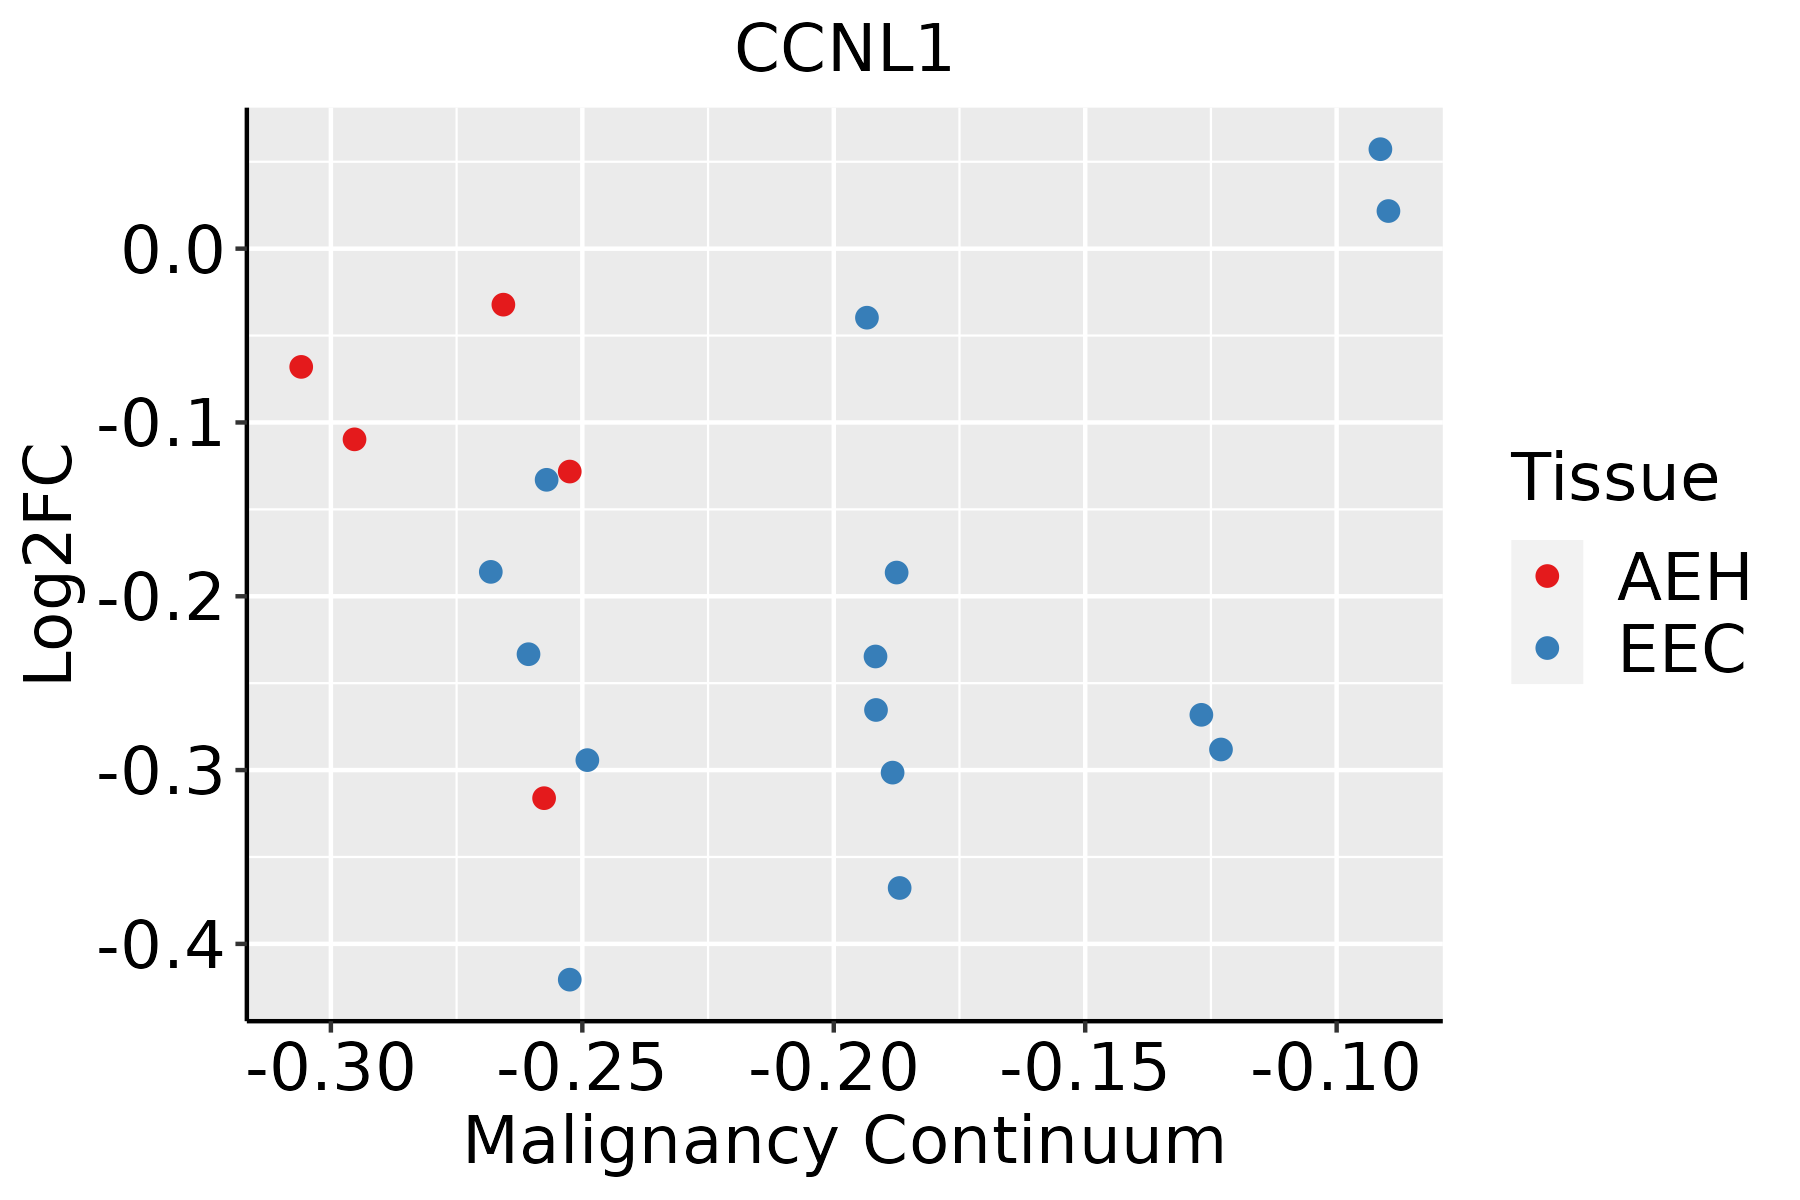 | AEH: Atypical endometrial hyperplasia |
| EEC: Endometrioid Cancer | ||
| Esophagus | 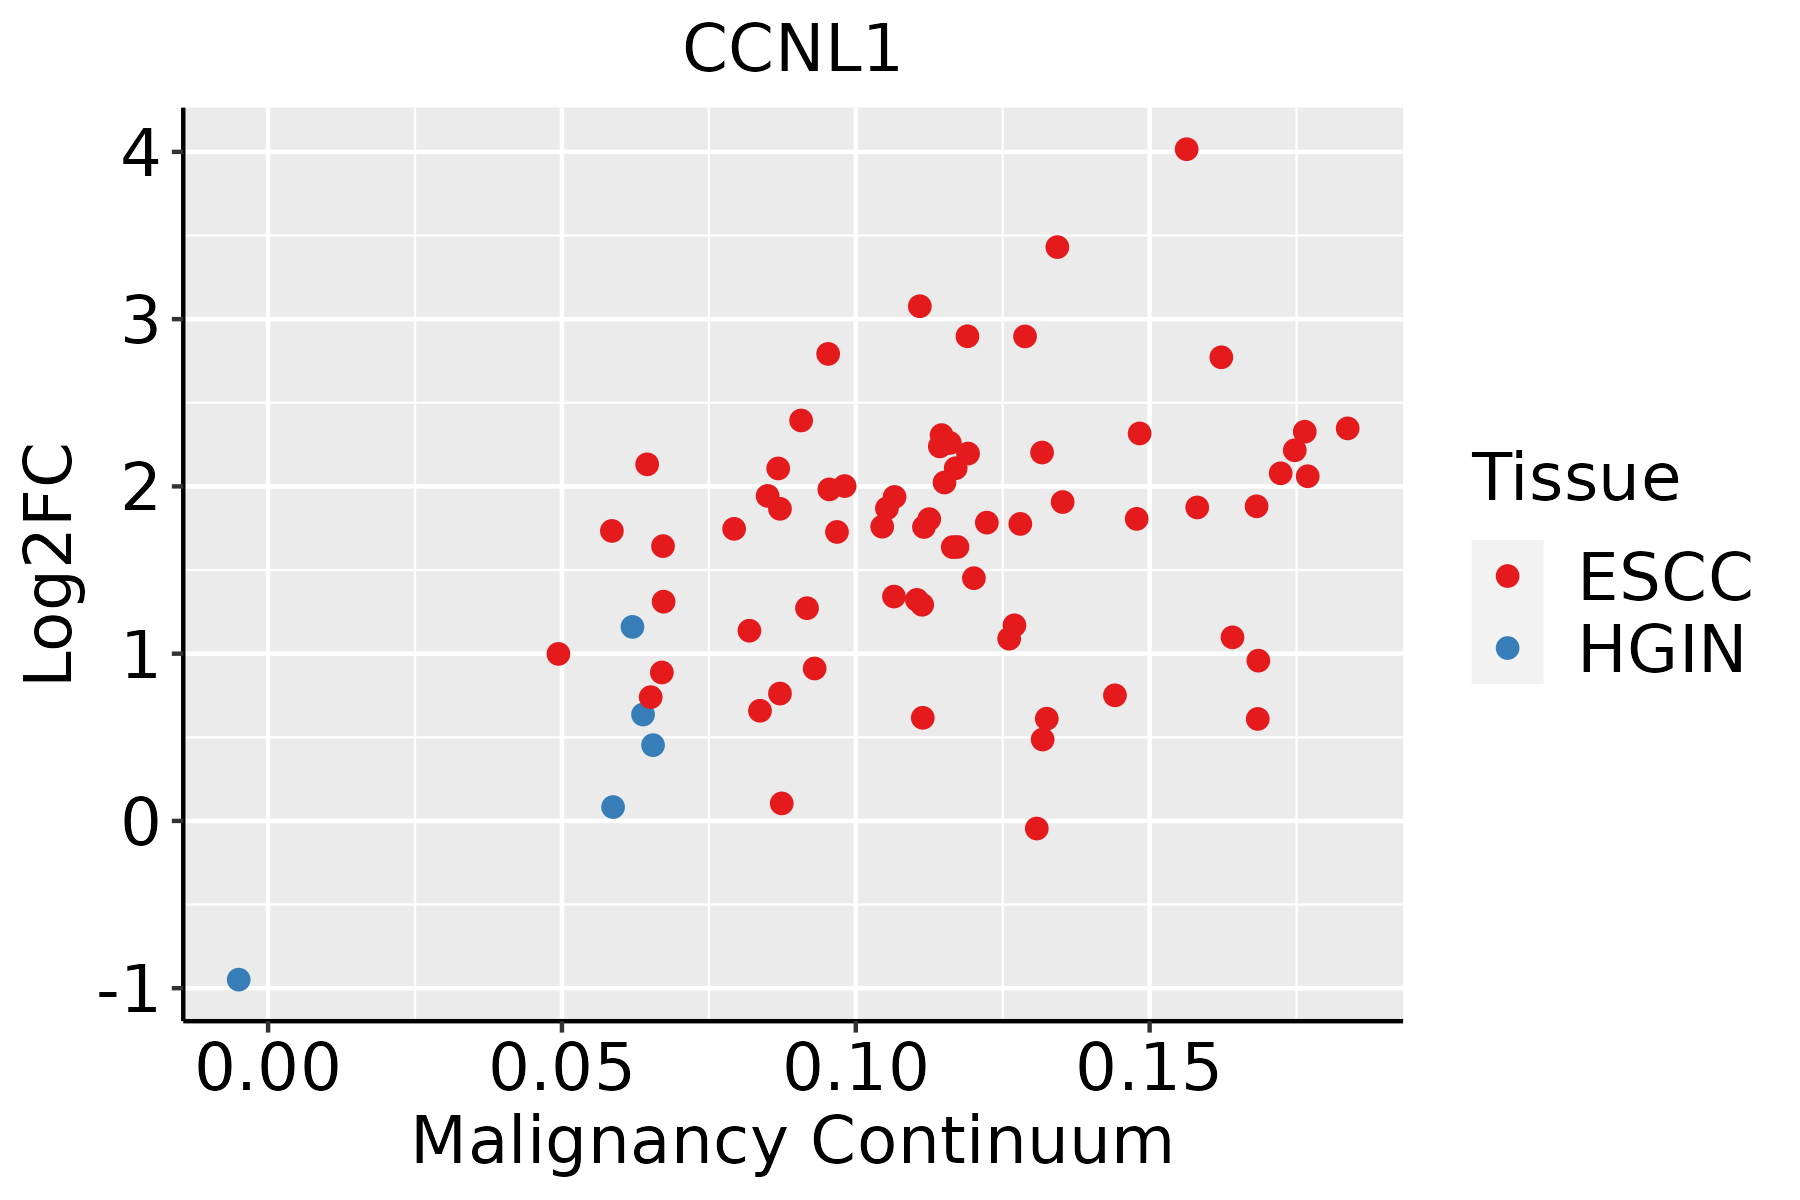 | ESCC: Esophageal squamous cell carcinoma |
| HGIN: High-grade intraepithelial neoplasias | ||
| LGIN: Low-grade intraepithelial neoplasias | ||
| Liver |  | HCC: Hepatocellular carcinoma |
| NAFLD: Non-alcoholic fatty liver disease | ||
| Lung | 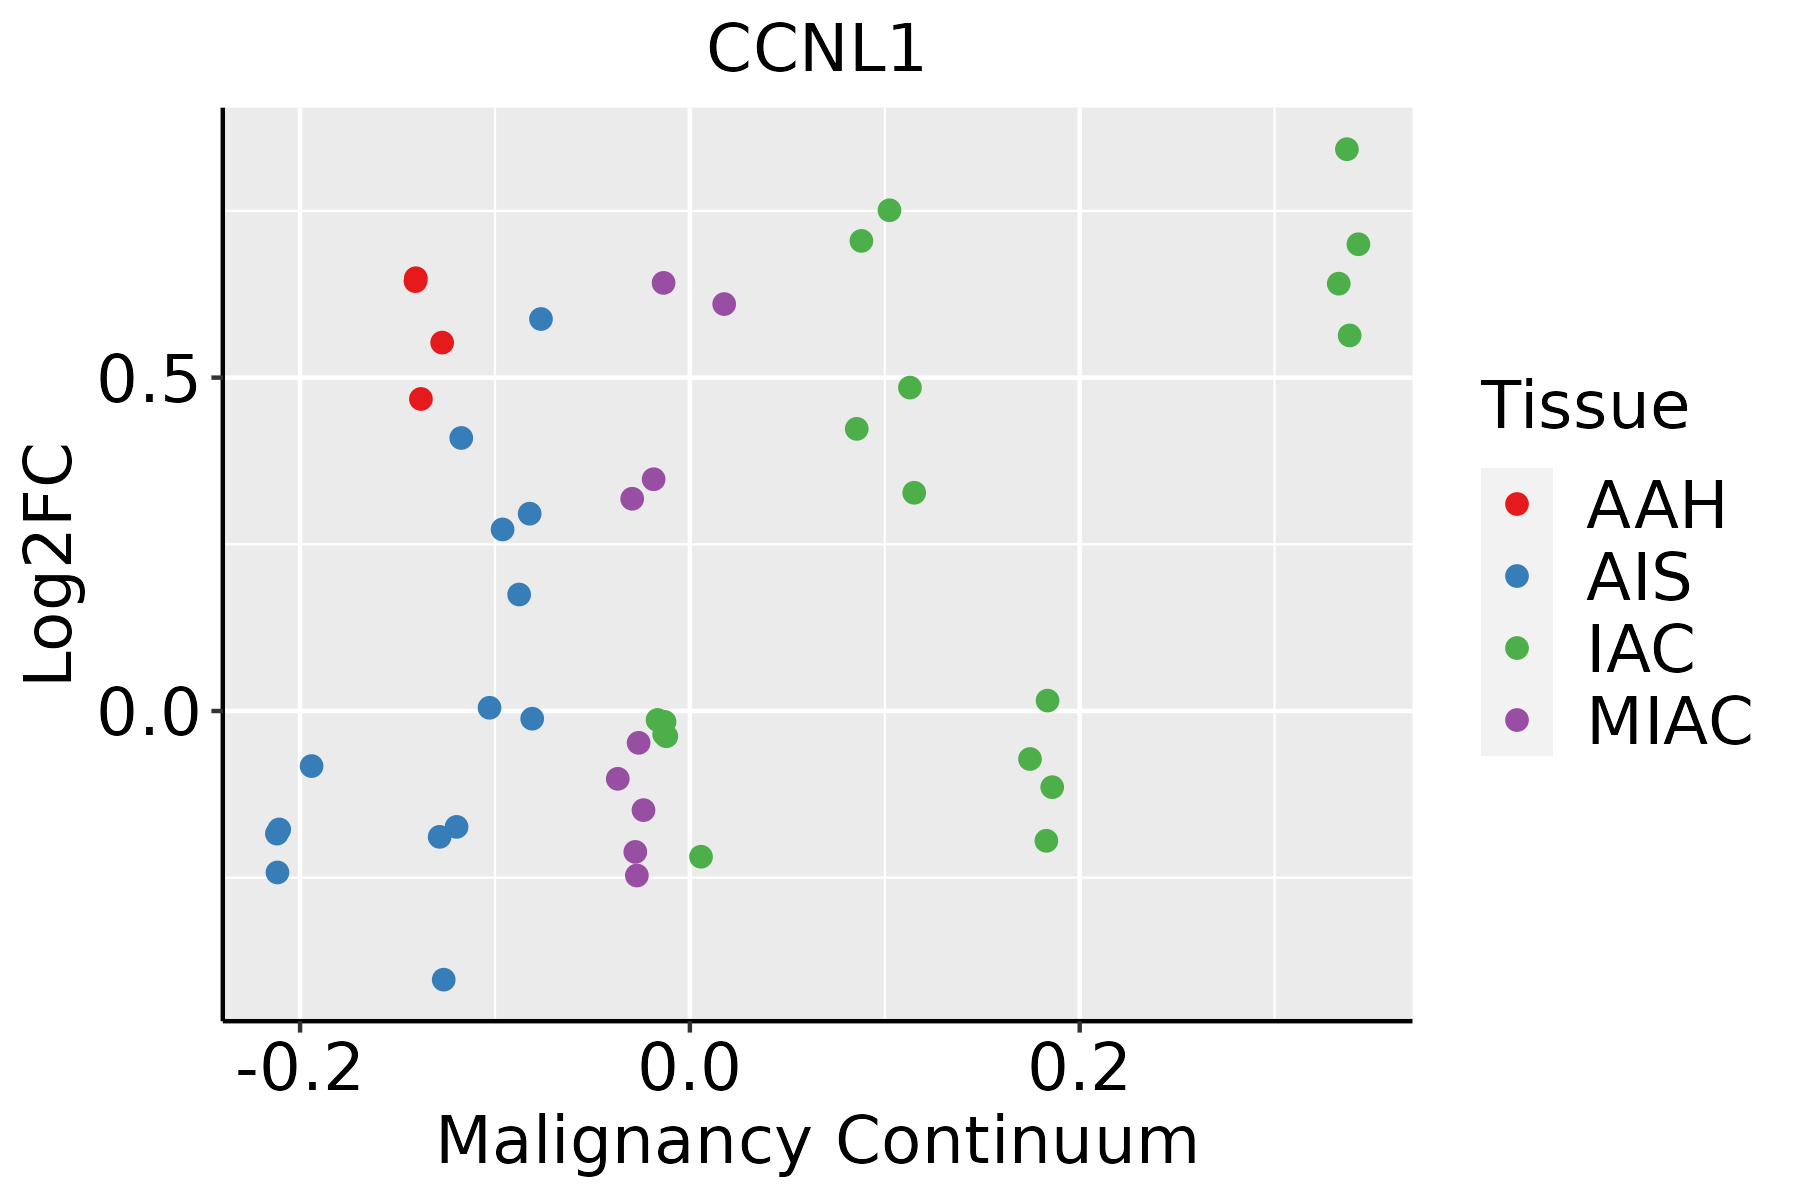 | AAH: Atypical adenomatous hyperplasia |
| AIS: Adenocarcinoma in situ | ||
| IAC: Invasive lung adenocarcinoma | ||
| MIA: Minimally invasive adenocarcinoma | ||
| Oral Cavity | 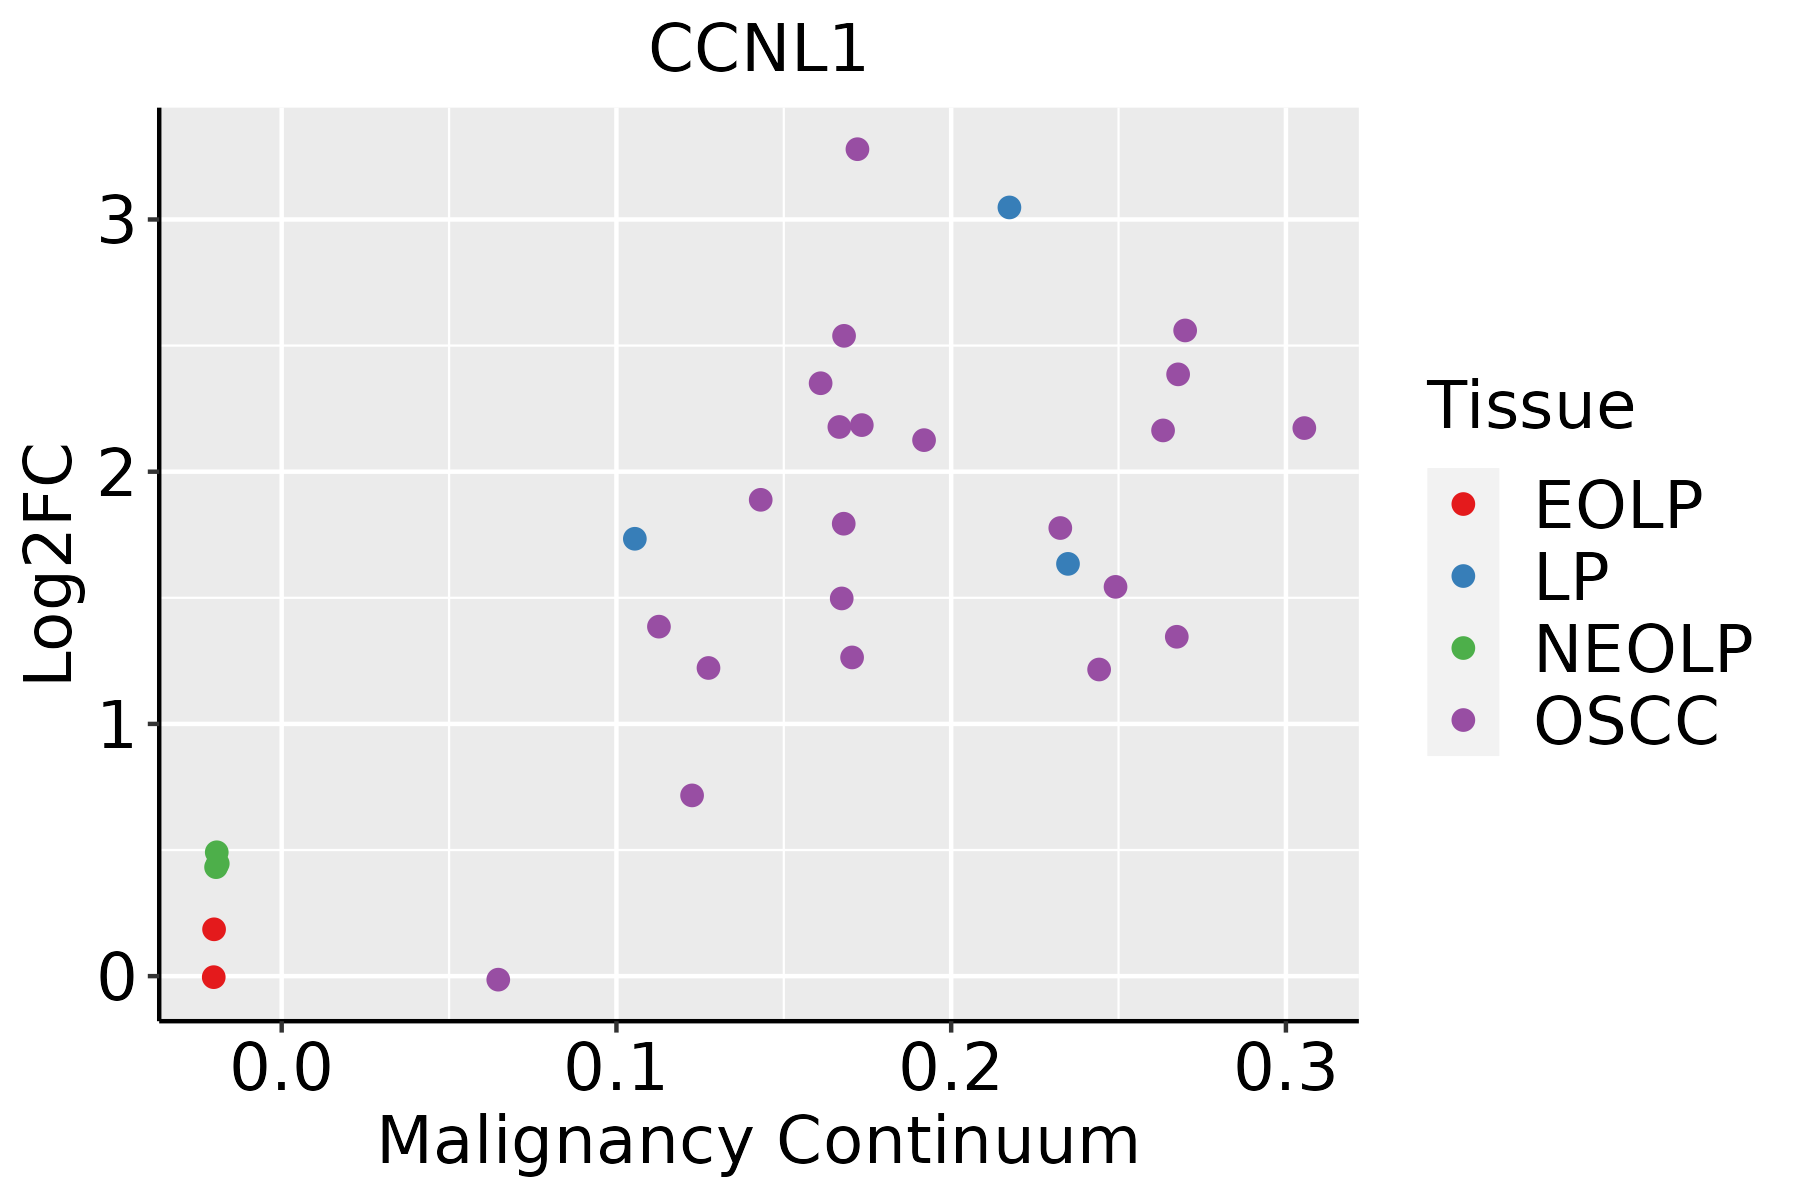 | EOLP: Erosive Oral lichen planus |
| LP: leukoplakia | ||
| NEOLP: Non-erosive oral lichen planus | ||
| OSCC: Oral squamous cell carcinoma | ||
| Prostate | 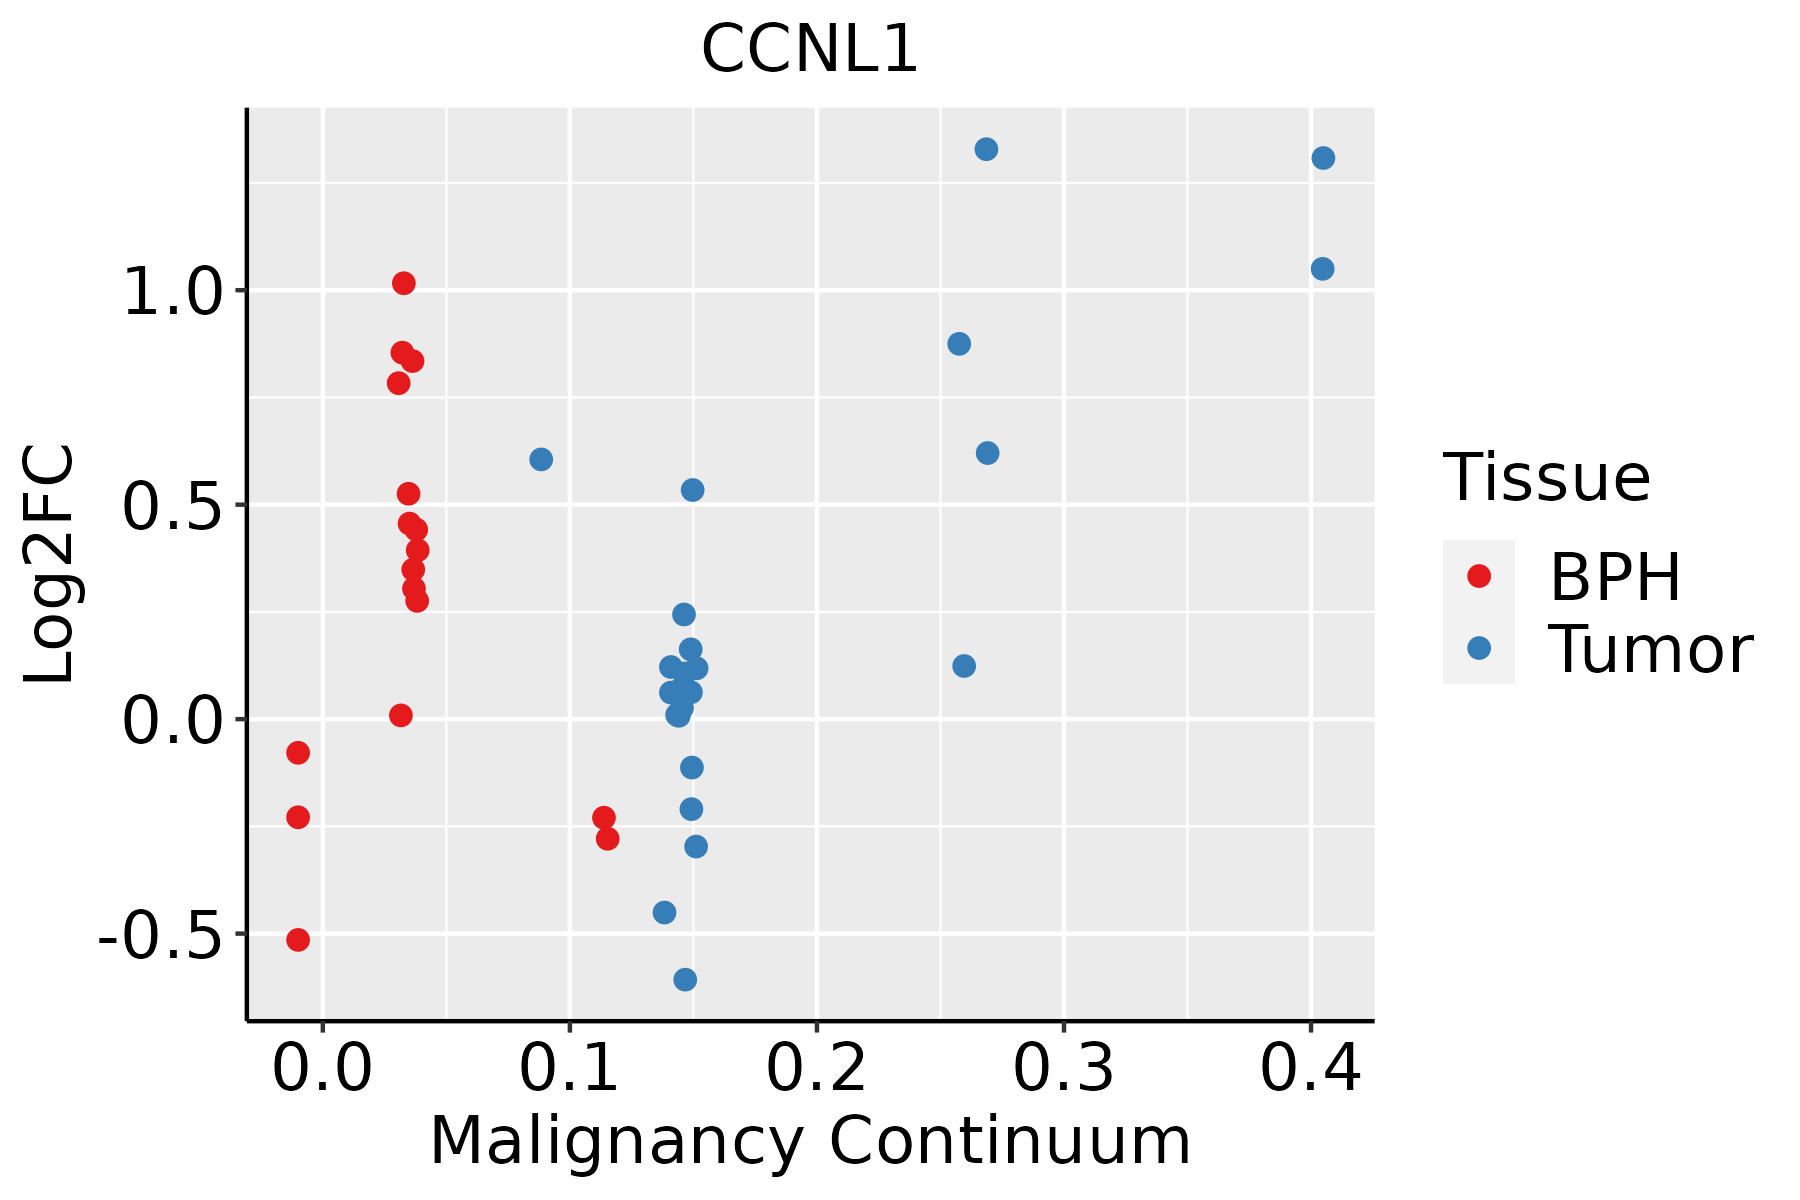 | BPH: Benign Prostatic Hyperplasia |
| Skin | 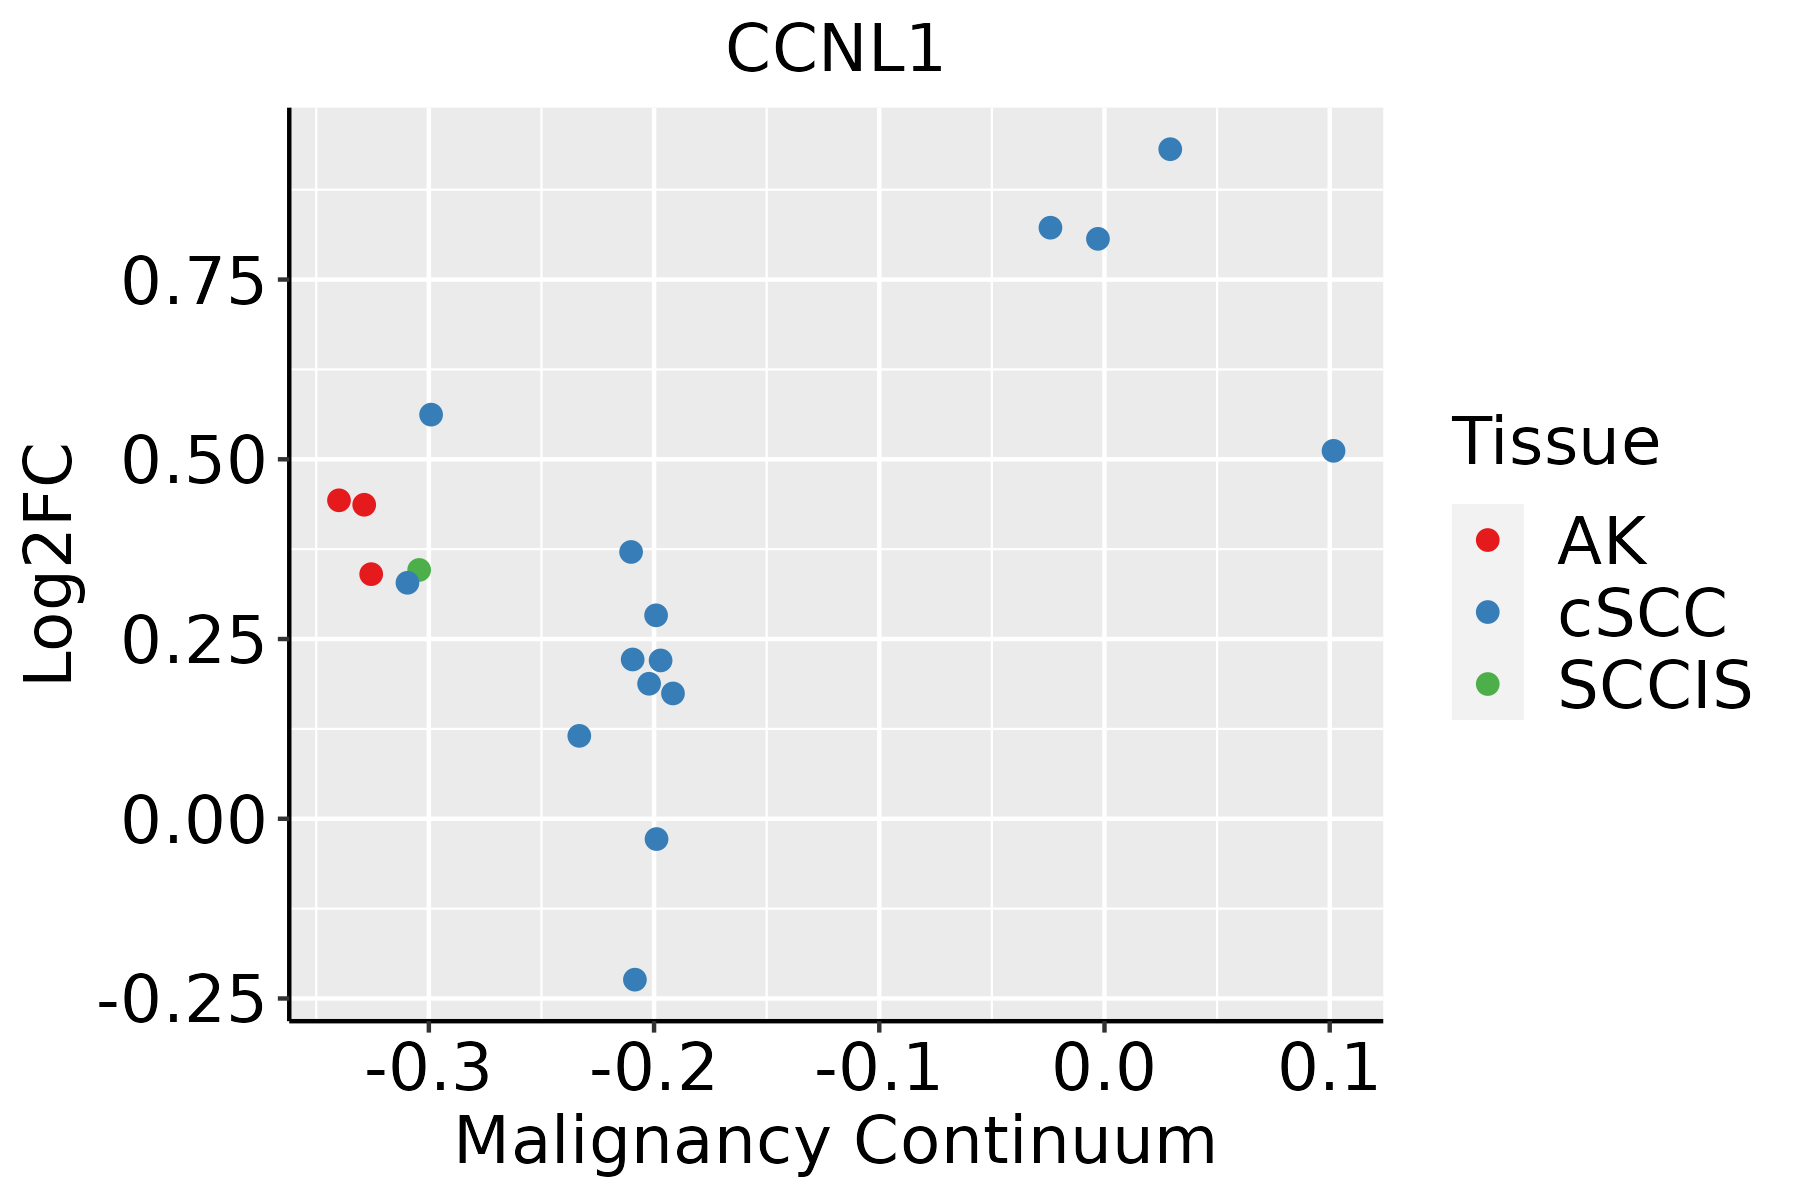 | AK: Actinic keratosis |
| cSCC: Cutaneous squamous cell carcinoma | ||
| SCCIS:squamous cell carcinoma in situ | ||
| Thyroid | 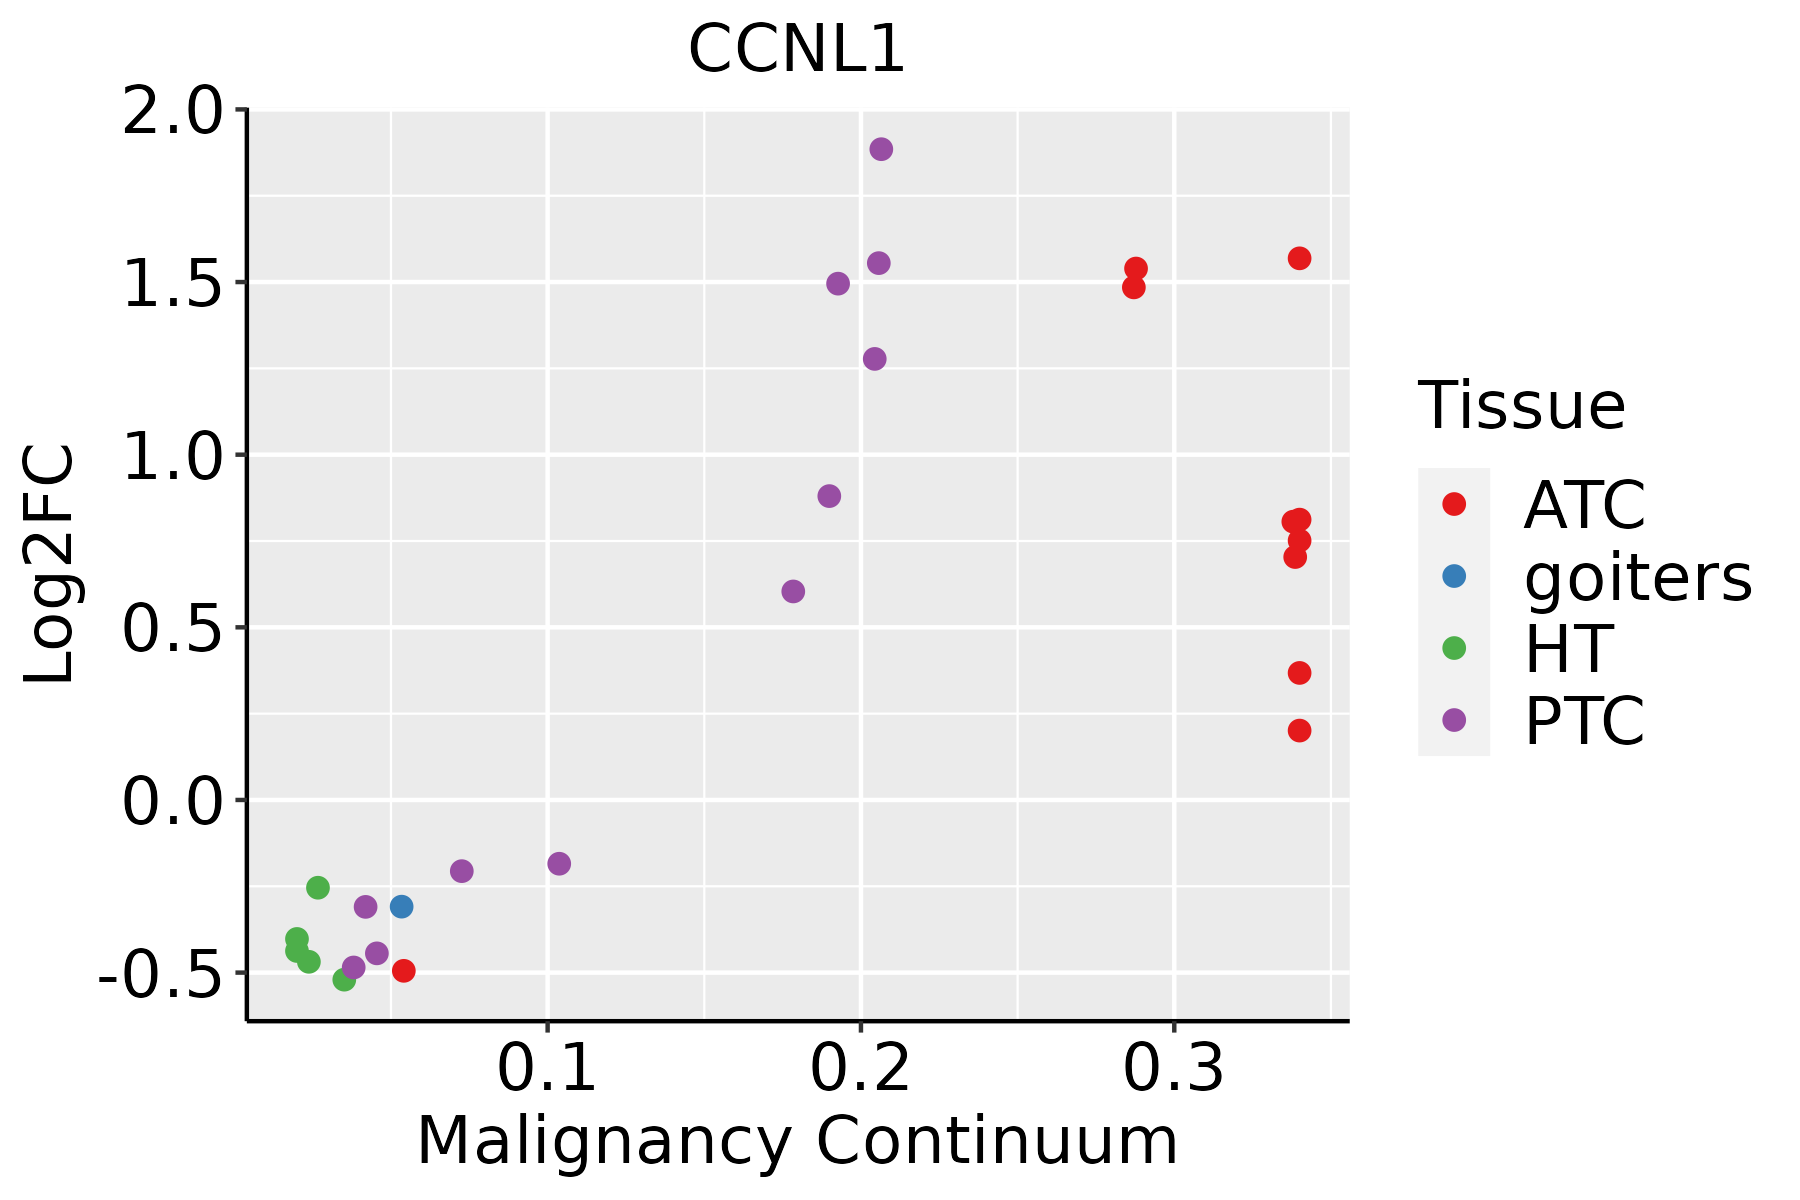 | ATC: Anaplastic thyroid cancer |
| HT: Hashimoto's thyroiditis | ||
| PTC: Papillary thyroid cancer |
| ∗log2FC in expression of this searched gene in stem-like cells from each diseased tissue sample relative to stem-like cells in normal samples in each tissue plotted against the malignancy continuum. Samples are colored based on if they are from different disease stage. |
Top |
Malignant transformation related pathway analysis |
| Find out the enriched GO biological processes and KEGG pathways involved in transition from healthy to precancer to cancer |
| Tissue | Disease Stage | Enriched GO biological Processes |
| Colorectum | AD |  |
| Colorectum | SER |  |
| Colorectum | MSS |  |
| Colorectum | MSI-H |  |
| Colorectum | FAP |  |
| ∗Top 15 enriched GO BP terms are showed in the bar plot of each disease state in each tissue. Each row represents a significant GO biological process which is colored according to the -log10(p.adjust). |
| Page: 1 2 3 4 5 6 7 8 9 |
| GO ID | Tissue | Disease Stage | Description | Gene Ratio | Bg Ratio | pvalue | p.adjust | Count |
| GO:00719007 | Cervix | CC | regulation of protein serine/threonine kinase activity | 75/2311 | 359/18723 | 2.76e-06 | 8.02e-05 | 75 |
| GO:0071900 | Colorectum | AD | regulation of protein serine/threonine kinase activity | 98/3918 | 359/18723 | 2.18e-03 | 1.73e-02 | 98 |
| GO:00719001 | Colorectum | SER | regulation of protein serine/threonine kinase activity | 74/2897 | 359/18723 | 5.22e-03 | 3.96e-02 | 74 |
| GO:00719002 | Colorectum | MSS | regulation of protein serine/threonine kinase activity | 93/3467 | 359/18723 | 2.98e-04 | 3.91e-03 | 93 |
| GO:00719003 | Colorectum | FAP | regulation of protein serine/threonine kinase activity | 78/2622 | 359/18723 | 3.99e-05 | 8.48e-04 | 78 |
| GO:00719004 | Colorectum | CRC | regulation of protein serine/threonine kinase activity | 65/2078 | 359/18723 | 4.67e-05 | 1.10e-03 | 65 |
| GO:00719008 | Endometrium | AEH | regulation of protein serine/threonine kinase activity | 61/2100 | 359/18723 | 6.11e-04 | 5.98e-03 | 61 |
| GO:007190013 | Endometrium | EEC | regulation of protein serine/threonine kinase activity | 62/2168 | 359/18723 | 8.17e-04 | 7.61e-03 | 62 |
| GO:007190016 | Esophagus | ESCC | regulation of protein serine/threonine kinase activity | 227/8552 | 359/18723 | 1.12e-11 | 4.10e-10 | 227 |
| GO:19040294 | Esophagus | ESCC | regulation of cyclin-dependent protein kinase activity | 69/8552 | 98/18723 | 6.04e-07 | 7.91e-06 | 69 |
| GO:00000794 | Esophagus | ESCC | regulation of cyclin-dependent protein serine/threonine kinase activity | 66/8552 | 94/18723 | 1.24e-06 | 1.53e-05 | 66 |
| GO:00719005 | Liver | NAFLD | regulation of protein serine/threonine kinase activity | 51/1882 | 359/18723 | 7.17e-03 | 4.96e-02 | 51 |
| GO:007190011 | Liver | Cirrhotic | regulation of protein serine/threonine kinase activity | 110/4634 | 359/18723 | 6.19e-03 | 3.08e-02 | 110 |
| GO:007190021 | Liver | HCC | regulation of protein serine/threonine kinase activity | 189/7958 | 359/18723 | 5.97e-05 | 5.47e-04 | 189 |
| GO:0000079 | Liver | HCC | regulation of cyclin-dependent protein serine/threonine kinase activity | 55/7958 | 94/18723 | 1.25e-03 | 6.91e-03 | 55 |
| GO:1904029 | Liver | HCC | regulation of cyclin-dependent protein kinase activity | 57/7958 | 98/18723 | 1.26e-03 | 6.92e-03 | 57 |
| GO:00719006 | Lung | IAC | regulation of protein serine/threonine kinase activity | 71/2061 | 359/18723 | 6.33e-07 | 3.72e-05 | 71 |
| GO:007190012 | Lung | AIS | regulation of protein serine/threonine kinase activity | 61/1849 | 359/18723 | 1.76e-05 | 6.17e-04 | 61 |
| GO:007190010 | Oral cavity | OSCC | regulation of protein serine/threonine kinase activity | 201/7305 | 359/18723 | 3.90e-11 | 1.27e-09 | 201 |
| GO:19040293 | Oral cavity | OSCC | regulation of cyclin-dependent protein kinase activity | 60/7305 | 98/18723 | 6.90e-06 | 7.56e-05 | 60 |
| Page: 1 2 3 |
| Pathway ID | Tissue | Disease Stage | Description | Gene Ratio | Bg Ratio | pvalue | p.adjust | qvalue | Count |
| Page: 1 |
Top |
Cell-cell communication analysis |
| Identification of potential cell-cell interactions between two cell types and their ligand-receptor pairs for different disease states |
| Ligand | Receptor | LRpair | Pathway | Tissue | Disease Stage |
| Page: 1 |
Top |
Single-cell gene regulatory network inference analysis |
| Find out the significant the regulons (TFs) and the target genes of each regulon across cell types for different disease states |
| TF | Cell Type | Tissue | Disease Stage | Target Gene | RSS | Regulon Activity |
| ∗The dot plots of a searched regulon are shown for all cell subpopulations in each disease state of each tissue based on the regulon specific score inferred using pySCENIC and by calculating the average expression. |
| Page: 1 |
Top |
Somatic mutation of malignant transformation related genes |
| Annotation of somatic variants for genes involved in malignant transformation |
| Hugo Symbol | Variant Class | Variant Classification | dbSNP RS | HGVSc | HGVSp | HGVSp Short | SWISSPROT | BIOTYPE | SIFT | PolyPhen | Tumor Sample Barcode | Tissue | Histology | Sex | Age | Stage | Therapy Types | Drugs | Outcome |
| CCNL1 | SNV | Missense_Mutation | novel | c.168N>A | p.His56Gln | p.H56Q | Q9UK58 | protein_coding | deleterious(0) | benign(0.312) | TCGA-A1-A0SO-01 | Breast | breast invasive carcinoma | Female | >=65 | I/II | Chemotherapy | SD | |
| CCNL1 | deletion | In_Frame_Del | c.144_152delNNNNNNNNN | p.Glu49_Ser51del | p.E49_S51del | Q9UK58 | protein_coding | TCGA-A2-A0EO-01 | Breast | breast invasive carcinoma | Female | <65 | I/II | Hormone Therapy | tamoxiphen | SD | |||
| CCNL1 | insertion | Frame_Shift_Ins | novel | c.1052_1053insTGCCATTAAGATACTGTATGTCCAGAAC | p.Lys351AsnfsTer16 | p.K351Nfs*16 | Q9UK58 | protein_coding | TCGA-AR-A0U0-01 | Breast | breast invasive carcinoma | Female | >=65 | I/II | Unknown | Unknown | SD | ||
| CCNL1 | SNV | Missense_Mutation | c.511N>A | p.Asp171Asn | p.D171N | Q9UK58 | protein_coding | deleterious(0) | probably_damaging(0.999) | TCGA-IR-A3LI-01 | Cervix | cervical & endocervical cancer | Female | <65 | I/II | Chemotherapy | cisplatin | CR | |
| CCNL1 | SNV | Missense_Mutation | c.1552N>G | p.Arg518Gly | p.R518G | Q9UK58 | protein_coding | deleterious(0.05) | benign(0.09) | TCGA-LP-A5U2-01 | Cervix | cervical & endocervical cancer | Female | <65 | III/IV | Unknown | Unknown | SD | |
| CCNL1 | SNV | Missense_Mutation | rs749964157 | c.1199N>A | p.Arg400Gln | p.R400Q | Q9UK58 | protein_coding | tolerated(0.17) | benign(0.054) | TCGA-VS-A8EL-01 | Cervix | cervical & endocervical cancer | Female | <65 | I/II | Chemotherapy | cisplatin | CR |
| CCNL1 | SNV | Missense_Mutation | c.1495C>T | p.Arg499Cys | p.R499C | Q9UK58 | protein_coding | deleterious(0) | possibly_damaging(0.513) | TCGA-A6-6781-01 | Colorectum | colon adenocarcinoma | Male | <65 | III/IV | Chemotherapy | oxaliplatin | SD | |
| CCNL1 | SNV | Missense_Mutation | c.790C>T | p.Arg264Cys | p.R264C | Q9UK58 | protein_coding | deleterious(0) | possibly_damaging(0.872) | TCGA-AA-A010-01 | Colorectum | colon adenocarcinoma | Female | <65 | I/II | Chemotherapy | folinic | CR | |
| CCNL1 | SNV | Missense_Mutation | c.121C>A | p.Leu41Met | p.L41M | Q9UK58 | protein_coding | deleterious(0.01) | probably_damaging(0.983) | TCGA-AA-A010-01 | Colorectum | colon adenocarcinoma | Female | <65 | I/II | Chemotherapy | folinic | CR | |
| CCNL1 | SNV | Missense_Mutation | c.959N>C | p.Leu320Ser | p.L320S | Q9UK58 | protein_coding | deleterious(0.03) | possibly_damaging(0.621) | TCGA-AA-A02R-01 | Colorectum | colon adenocarcinoma | Female | >=65 | I/II | Unknown | Unknown | PD |
| Page: 1 2 3 4 5 6 |
Top |
Related drugs of malignant transformation related genes |
| Identification of chemicals and drugs interact with genes involved in malignant transfromation |
| (DGIdb 4.0) |
| Entrez ID | Symbol | Category | Interaction Types | Drug Claim Name | Drug Name | PMIDs |
| Page: 1 |

Copyright 2023-Present -The University of Texas Health Science Center at Houston |