Schematic overview of the cellular and molecular mechanisms involved in the cancer progression, including the proposed cellular and molecular mechanisms in cancer cells trajectory. AT1: alveolar type 1 cells; AT2: alveolar type 2 cells; AAH: atypical adenomatous hyperplasia; AIS: adenocarcinoma in situ; MIA: minimally invasive adenocarcinoma; IA: invasive adenocarcinoma; EMT: epithelial-mesenchymal transition

Home

Download

Statistics

Help

Contact

Center for Computational Systems Medicine
leaf

Gene summary

leaf

Malignant transformation analysis

leaf

Malignant transformation related pathway analysis

leaf

Cell-cell communication analysis

leaf

Single-cell gene regulatory network inference analysis

leaf

Somatic mutation of malignant transformation related genes

leaf

Related drugs of malignant transformation related genes

Gene: CCNK

Gene summary for CCNK

check button Gene summary.

Gene informationSpeciesHuman
Gene symbol

CCNK

Gene ID

8812

Gene namecyclin K
Gene AliasCPR4
Cytomap14q32.2
Gene Typeprotein-coding
GO ID

GO:0000079

UniProtAcc

A0A024R6K1


Top

Malignant transformation analysis

check button Identification of the aberrant gene expression in precancerous and cancerous lesions by comparing the gene expression of stem-like cells in diseased tissues with normal stem cells
check button Malignant transformation involving gene list.
Entrez IDSymbolReplicatesSpeciesOrganTissueAdj P-valueLog2FCMalignancy
8812CCNKLZE2DHumanEsophagusHGIN2.39e-022.72e-010.0642
8812CCNKLZE2THumanEsophagusESCC2.77e-038.05e-010.082
8812CCNKLZE4THumanEsophagusESCC9.30e-205.90e-010.0811
8812CCNKLZE5THumanEsophagusESCC1.14e-045.76e-010.0514
8812CCNKLZE7THumanEsophagusESCC6.56e-062.39e-010.0667
8812CCNKLZE8THumanEsophagusESCC8.98e-091.96e-010.067
8812CCNKLZE20THumanEsophagusESCC1.48e-205.89e-010.0662
8812CCNKLZE22D1HumanEsophagusHGIN4.39e-032.13e-020.0595
8812CCNKLZE22THumanEsophagusESCC3.92e-073.78e-010.068
8812CCNKLZE24THumanEsophagusESCC2.07e-411.18e+000.0596
8812CCNKLZE6THumanEsophagusESCC3.58e-071.06e-010.0845
8812CCNKP1T-EHumanEsophagusESCC2.81e-166.15e-010.0875
8812CCNKP2T-EHumanEsophagusESCC5.00e-273.90e-010.1177
8812CCNKP4T-EHumanEsophagusESCC1.45e-225.76e-010.1323
8812CCNKP5T-EHumanEsophagusESCC1.73e-173.82e-010.1327
8812CCNKP8T-EHumanEsophagusESCC3.89e-255.52e-010.0889
8812CCNKP9T-EHumanEsophagusESCC7.44e-173.08e-010.1131
8812CCNKP10T-EHumanEsophagusESCC7.91e-447.47e-010.116
8812CCNKP11T-EHumanEsophagusESCC1.36e-134.92e-010.1426
8812CCNKP12T-EHumanEsophagusESCC5.11e-478.58e-010.1122
Page: 1 2 3 4 5 6 

check button Transcriptomic changes along malignancy continuum.
TissueExpression DynamicsAbbreviation
EsophagusThe image shows the transcriptomic changes along malignancy continuum.log2FC in expression of this searched gene in stem-like cells from each diseased tissue sample relative to stem-like cells in normal samples in each tissue plotted against the malignancy continuum. Samples are colored based on if they are from different disease stage.
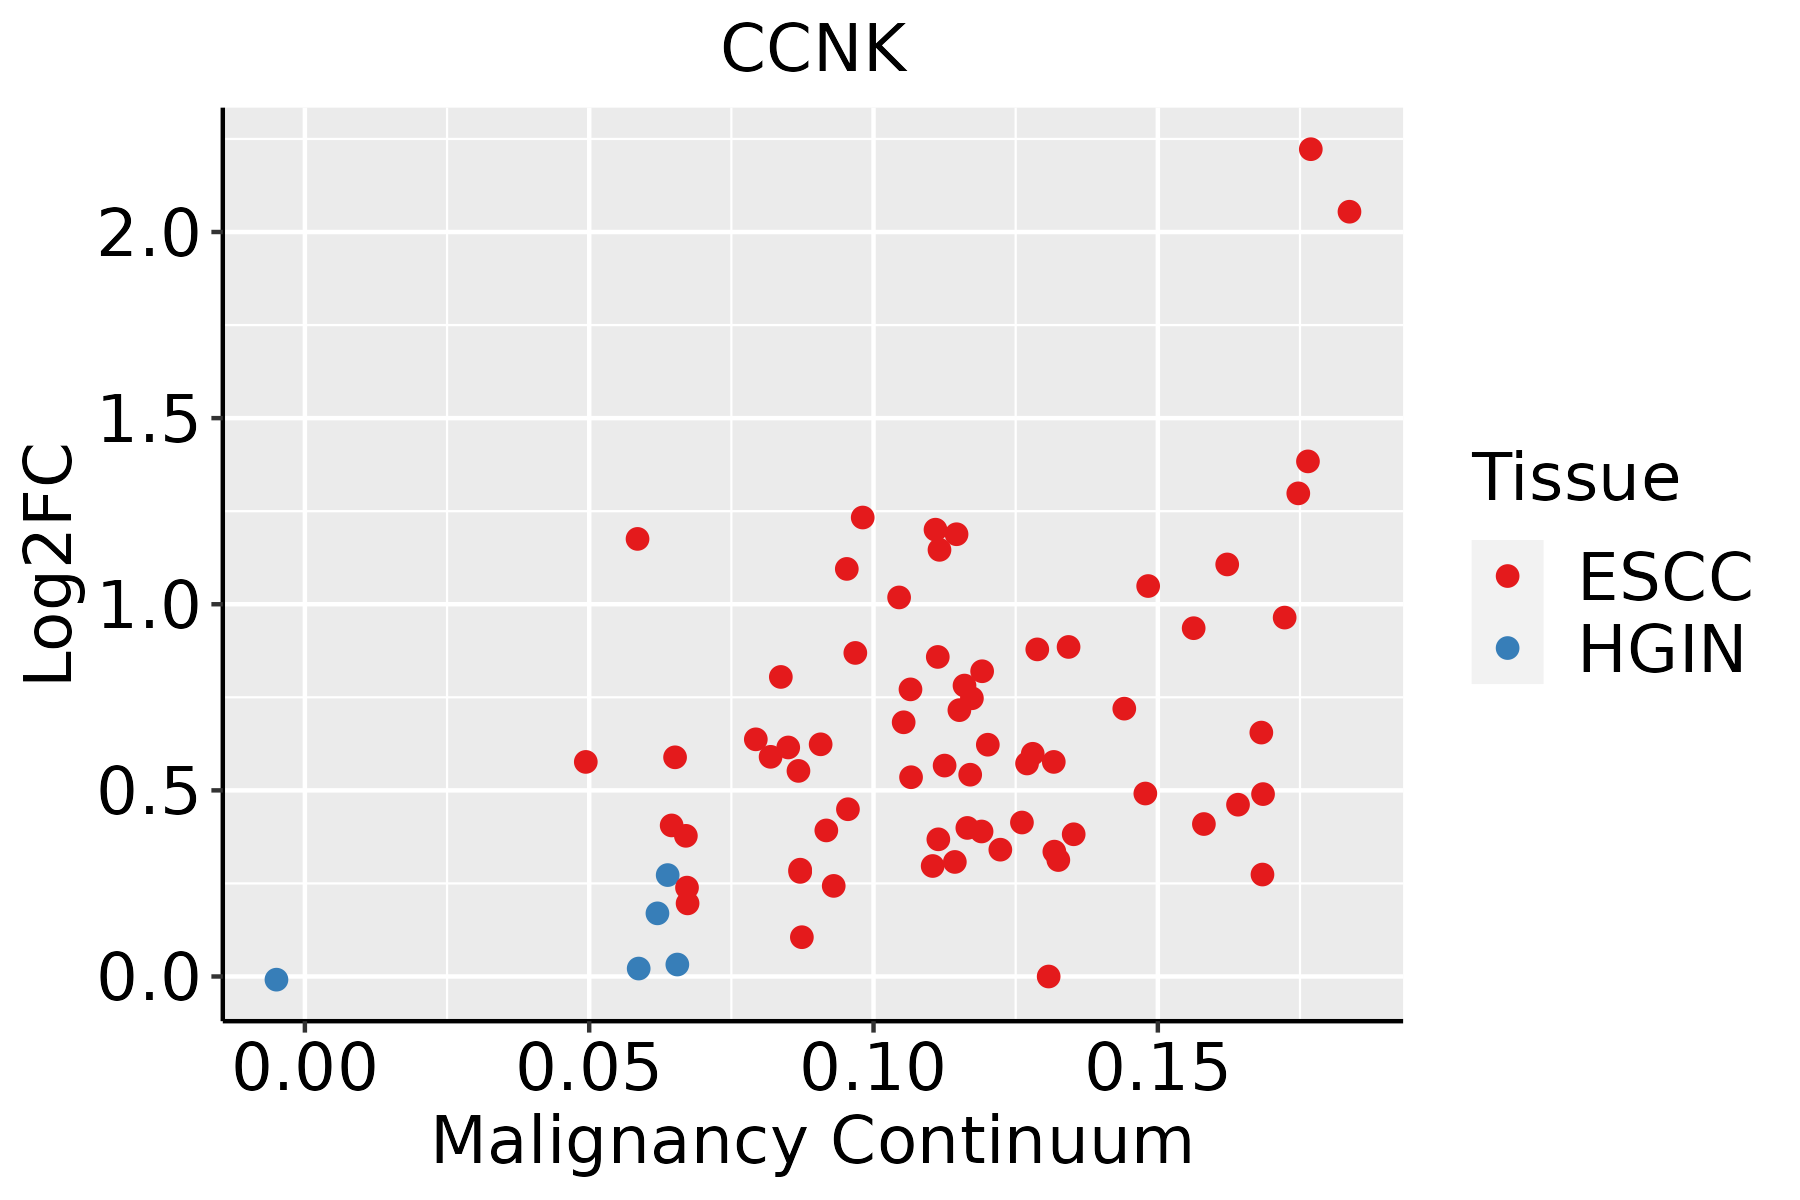
ESCC: Esophageal squamous cell carcinoma
HGIN: High-grade intraepithelial neoplasias
LGIN: Low-grade intraepithelial neoplasias
LiverThe image shows the transcriptomic changes along malignancy continuum.log2FC in expression of this searched gene in stem-like cells from each diseased tissue sample relative to stem-like cells in normal samples in each tissue plotted against the malignancy continuum. Samples are colored based on if they are from different disease stage.
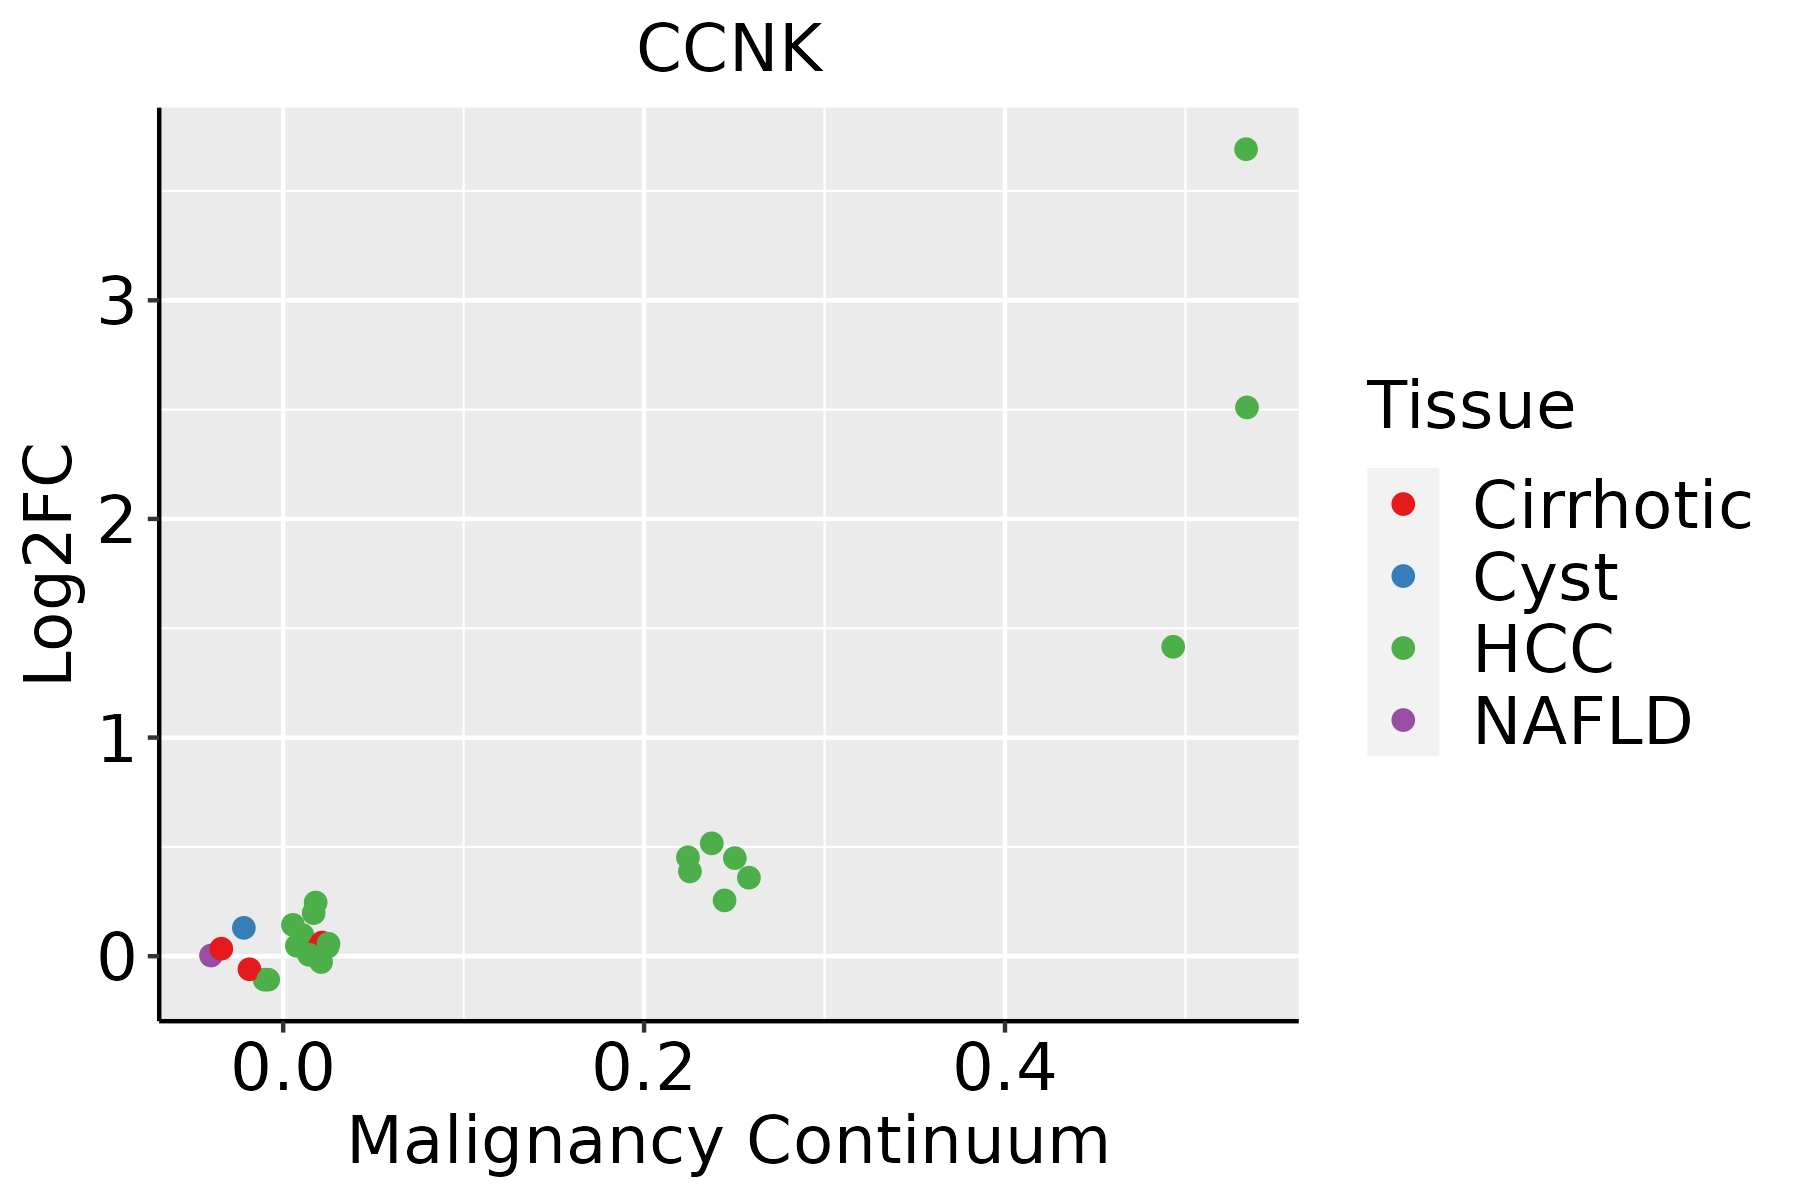
HCC: Hepatocellular carcinoma
NAFLD: Non-alcoholic fatty liver disease
Oral CavityThe image shows the transcriptomic changes along malignancy continuum.log2FC in expression of this searched gene in stem-like cells from each diseased tissue sample relative to stem-like cells in normal samples in each tissue plotted against the malignancy continuum. Samples are colored based on if they are from different disease stage.
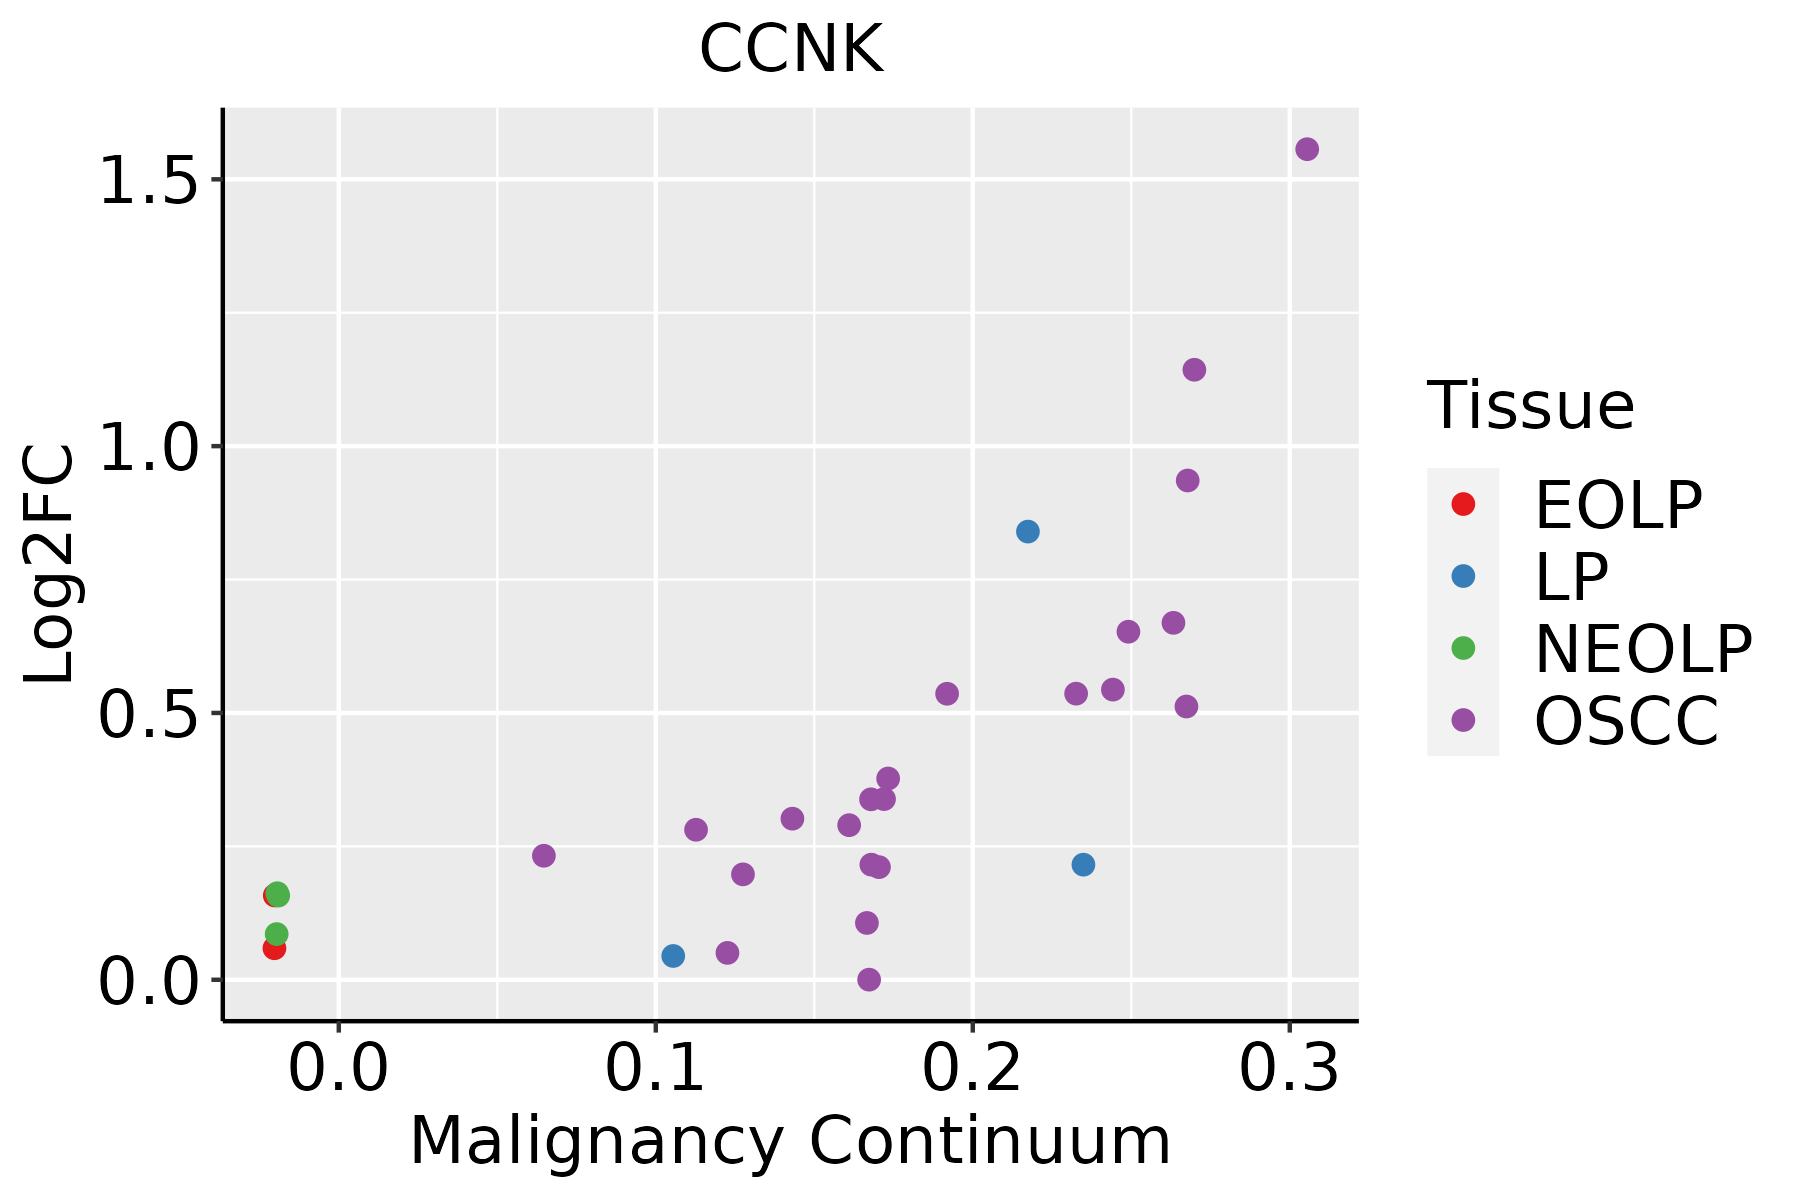
EOLP: Erosive Oral lichen planus
LP: leukoplakia
NEOLP: Non-erosive oral lichen planus
OSCC: Oral squamous cell carcinoma
SkinThe image shows the transcriptomic changes along malignancy continuum.log2FC in expression of this searched gene in stem-like cells from each diseased tissue sample relative to stem-like cells in normal samples in each tissue plotted against the malignancy continuum. Samples are colored based on if they are from different disease stage.
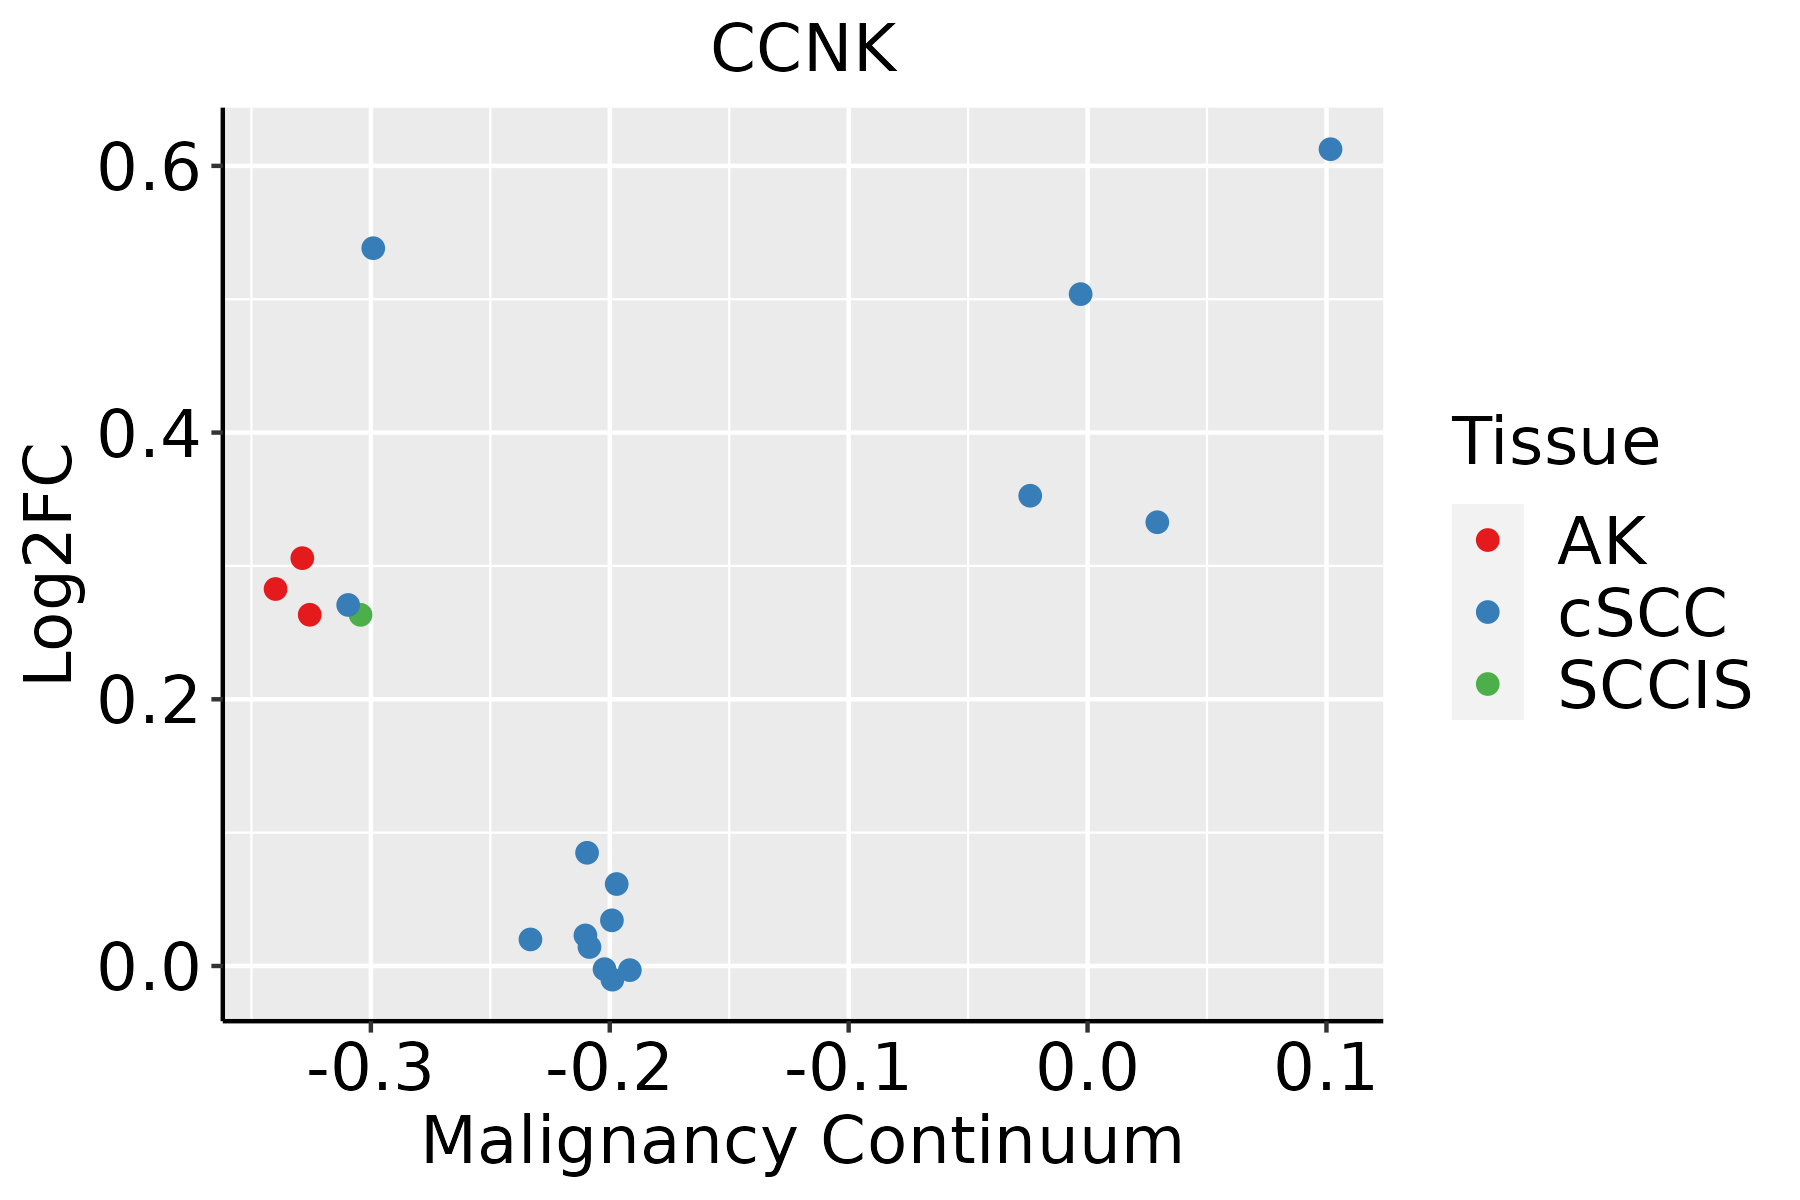
AK: Actinic keratosis
cSCC: Cutaneous squamous cell carcinoma
SCCIS:squamous cell carcinoma in situ
ThyroidThe image shows the transcriptomic changes along malignancy continuum.log2FC in expression of this searched gene in stem-like cells from each diseased tissue sample relative to stem-like cells in normal samples in each tissue plotted against the malignancy continuum. Samples are colored based on if they are from different disease stage.ATC: Anaplastic thyroid cancer
HT: Hashimoto's thyroiditis
PTC: Papillary thyroid cancer
∗log2FC in expression of this searched gene in stem-like cells from each diseased tissue sample relative to stem-like cells in normal samples in each tissue plotted against the malignancy continuum. Samples are colored based on if they are from different disease stage.

Top

Malignant transformation related pathway analysis

check buttonFind out the enriched GO biological processes and KEGG pathways involved in transition from healthy to precancer to cancer
check button Figure of enriched GO biological processes.
TissueDisease StageEnriched GO biological Processes
ColorectumADGO analysis - Figure of enriched GO biological processes: Top 15 enriched GO BP terms are showed in the bar plot of each disease state in each tissue. Each row represents a significant GO biological process which is colored according to the -log10(p.adjust).
ColorectumSERGO analysis - Figure of enriched GO biological processes: Top 15 enriched GO BP terms are showed in the bar plot of each disease state in each tissue. Each row represents a significant GO biological process which is colored according to the -log10(p.adjust).
ColorectumMSSGO analysis - Figure of enriched GO biological processes: Top 15 enriched GO BP terms are showed in the bar plot of each disease state in each tissue. Each row represents a significant GO biological process which is colored according to the -log10(p.adjust).
ColorectumMSI-HGO analysis - Figure of enriched GO biological processes: Top 15 enriched GO BP terms are showed in the bar plot of each disease state in each tissue. Each row represents a significant GO biological process which is colored according to the -log10(p.adjust).
ColorectumFAPGO analysis - Figure of enriched GO biological processes: Top 15 enriched GO BP terms are showed in the bar plot of each disease state in each tissue. Each row represents a significant GO biological process which is colored according to the -log10(p.adjust).
∗Top 15 enriched GO BP terms are showed in the bar plot of each disease state in each tissue. Each row represents a significant GO biological process which is colored according to the -log10(p.adjust).
Page: 1 2 3 4 5 6 7 8 9 

check button Enriched GO biological processes.
GO IDTissueDisease StageDescriptionGene RatioBg Ratiopvaluep.adjustCount
GO:001603227EsophagusHGINviral process118/2587415/187233.01e-156.22e-13118
GO:001905827EsophagusHGINviral life cycle93/2587317/187233.66e-135.63e-1193
GO:001907926EsophagusHGINviral genome replication48/2587131/187234.65e-115.07e-0948
GO:004440326EsophagusHGINbiological process involved in symbiotic interaction71/2587290/187237.09e-073.00e-0571
GO:00063548EsophagusHGINDNA-templated transcription, elongation27/258791/187236.62e-051.52e-0327
GO:00518518EsophagusHGINmodulation by host of symbiont process19/258760/187233.07e-045.15e-0319
GO:00447888EsophagusHGINmodulation by host of viral process12/258730/187233.62e-045.68e-0312
GO:00518177EsophagusHGINmodulation of process of other organism involved in symbiotic interaction23/258781/187234.52e-046.62e-0323
GO:00327866EsophagusHGINpositive regulation of DNA-templated transcription, elongation11/258727/187235.28e-047.56e-0311
GO:00358219EsophagusHGINmodulation of process of other organism27/2587106/187239.89e-041.24e-0227
GO:00327844EsophagusHGINregulation of DNA-templated transcription, elongation16/258753/187231.58e-031.79e-0216
GO:005170210EsophagusHGINbiological process involved in interaction with symbiont24/258794/187231.78e-031.92e-0224
GO:00448275EsophagusHGINmodulation by host of viral genome replication8/258719/187232.40e-032.41e-028
GO:00708162EsophagusHGINphosphorylation of RNA polymerase II C-terminal domain6/258712/187233.03e-032.88e-026
GO:0016032111EsophagusESCCviral process301/8552415/187233.34e-291.32e-26301
GO:0019058111EsophagusESCCviral life cycle226/8552317/187231.17e-201.76e-18226
GO:0019079111EsophagusESCCviral genome replication102/8552131/187234.31e-142.19e-12102
GO:000635414EsophagusESCCDNA-templated transcription, elongation76/855291/187238.35e-144.11e-1276
GO:007190016EsophagusESCCregulation of protein serine/threonine kinase activity227/8552359/187231.12e-114.10e-10227
GO:0044403111EsophagusESCCbiological process involved in symbiotic interaction186/8552290/187231.43e-104.16e-09186
Page: 1 2 3 4 5 6 7 8 9 10 

check button Enriched KEGG pathways.
Pathway IDTissueDisease StageDescriptionGene RatioBg Ratiopvaluep.adjustqvalueCount
Page: 1 

Top

Cell-cell communication analysis

check buttonIdentification of potential cell-cell interactions between two cell types and their ligand-receptor pairs for different disease states
LigandReceptorLRpairPathwayTissueDisease Stage
Page: 1 

Top

Single-cell gene regulatory network inference analysis

check buttonFind out the significant the regulons (TFs) and the target genes of each regulon across cell types for different disease states
TFCell TypeTissueDisease StageTarget GeneRSSRegulon Activity
∗The dot plots of a searched regulon are shown for all cell subpopulations in each disease state of each tissue based on the regulon specific score inferred using pySCENIC and by calculating the average expression.
Page: 1 

Top

Somatic mutation of malignant transformation related genes

check buttonAnnotation of somatic variants for genes involved in malignant transformation
Hugo SymbolVariant ClassVariant ClassificationdbSNP RSHGVScHGVSpHGVSp ShortSWISSPROTBIOTYPESIFTPolyPhenTumor Sample BarcodeTissueHistologySexAgeStageTherapy TypesDrugsOutcome
CCNKSNVMissense_Mutationrs867757117c.1360G>Ap.Glu454Lysp.E454KO75909protein_codingdeleterious_low_confidence(0)benign(0)TCGA-5L-AAT1-01Breastbreast invasive carcinomaFemale<65III/IVHormone TherapyletrozolSD
CCNKSNVMissense_Mutationnovelc.986N>Ap.Ser329Tyrp.S329YO75909protein_codingdeleterious(0)benign(0.054)TCGA-AN-A046-01Breastbreast invasive carcinomaFemale>=65I/IIUnknownUnknownSD
CCNKSNVMissense_Mutationc.656N>Gp.Lys219Argp.K219RO75909protein_codingdeleterious(0.04)benign(0.348)TCGA-E2-A15L-01Breastbreast invasive carcinomaFemale>=65I/IIHormone TherapyarimidexSD
CCNKdeletionFrame_Shift_Delc.209delNp.Leu71TrpfsTer5p.L71Wfs*5O75909protein_codingTCGA-EW-A2FV-01Breastbreast invasive carcinomaFemale<65III/IVChemotherapydocetaxelSD
CCNKdeletionFrame_Shift_Delnovelc.806delNp.His271IlefsTer112p.H271Ifs*112O75909protein_codingTCGA-EW-A2FV-01Breastbreast invasive carcinomaFemale<65III/IVChemotherapydocetaxelSD
CCNKSNVMissense_Mutationc.1298N>Gp.Ser433Cysp.S433CO75909protein_codingdeleterious_low_confidence(0)benign(0.339)TCGA-EK-A2RC-01Cervixcervical & endocervical cancerFemale<65I/IIUnknownUnknownSD
CCNKSNVMissense_Mutationnovelc.149N>Cp.Arg50Prop.R50PO75909protein_codingdeleterious(0)probably_damaging(1)TCGA-VS-A9V1-01Cervixcervical & endocervical cancerFemale<65I/IIChemotherapycisplatinPD
CCNKSNVMissense_Mutationnovelc.206N>Tp.Asp69Valp.D69VO75909protein_codingtolerated(0.4)possibly_damaging(0.584)TCGA-AA-3950-01Colorectumcolon adenocarcinomaFemale>=65I/IIUnknownUnknownSD
CCNKSNVMissense_Mutationc.568N>Gp.Asn190Aspp.N190DO75909protein_codingdeleterious(0)probably_damaging(0.999)TCGA-G4-6588-01Colorectumcolon adenocarcinomaFemale<65I/IIUnknownUnknownSD
CCNKSNVMissense_Mutationc.1606N>Gp.Pro536Alap.P536AO75909protein_codingdeleterious_low_confidence(0.01)benign(0.283)TCGA-NH-A6GB-01Colorectumcolon adenocarcinomaFemale>=65III/IVChemotherapyoxaliplatinSD
Page: 1 2 3 4 

Top

Related drugs of malignant transformation related genes

check buttonIdentification of chemicals and drugs interact with genes involved in malignant transfromation
(DGIdb 4.0)
Entrez IDSymbolCategoryInteraction TypesDrug Claim NameDrug NamePMIDs
8812CCNKKINASEfluorouracilFLUOROURACIL
8812CCNKKINASEepirubicinEPIRUBICIN
8812CCNKKINASEcyclophosphamideCYCLOPHOSPHAMIDE
Page: 1