
|
|||||
|
 | |
| |
| |
| |
| |
| |
|
Gene: CCNJL |
Gene summary for CCNJL |
| Gene information | Species | Human | Gene symbol | CCNJL | Gene ID | 79616 |
| Gene name | cyclin J like | |
| Gene Alias | CCNJL | |
| Cytomap | 5q33.3 | |
| Gene Type | protein-coding | GO ID | GO:0000079 | UniProtAcc | B4DZA8 |
Top |
Malignant transformation analysis |
| Identification of the aberrant gene expression in precancerous and cancerous lesions by comparing the gene expression of stem-like cells in diseased tissues with normal stem cells |
| Entrez ID | Symbol | Replicates | Species | Organ | Tissue | Adj P-value | Log2FC | Malignancy |
| 79616 | CCNJL | HTA11_347_2000001011 | Human | Colorectum | AD | 1.69e-03 | 2.38e-01 | -0.1954 |
| 79616 | CCNJL | HTA11_696_2000001011 | Human | Colorectum | AD | 4.29e-02 | 2.05e-01 | -0.1464 |
| 79616 | CCNJL | RNA-P3T-P3T-1 | Human | Lung | IAC | 5.73e-03 | 4.03e-01 | 0.1829 |
| 79616 | CCNJL | RNA-P3T-P3T-2 | Human | Lung | IAC | 2.23e-03 | 5.10e-01 | 0.1835 |
| 79616 | CCNJL | RNA-P6T1-P6T1-3 | Human | Lung | MIAC | 1.64e-04 | 9.08e-01 | -0.0296 |
| 79616 | CCNJL | RNA-P6T2-P6T2-1 | Human | Lung | IAC | 8.75e-09 | 3.73e-01 | -0.0166 |
| 79616 | CCNJL | RNA-P6T2-P6T2-2 | Human | Lung | IAC | 5.99e-10 | 3.66e-01 | -0.0132 |
| 79616 | CCNJL | RNA-P6T2-P6T2-3 | Human | Lung | IAC | 7.93e-12 | 4.07e-01 | -0.013 |
| 79616 | CCNJL | RNA-P6T2-P6T2-4 | Human | Lung | IAC | 1.79e-09 | 3.83e-01 | -0.0121 |
| 79616 | CCNJL | RNA-P7T1-P7T1-2 | Human | Lung | AIS | 3.19e-04 | 4.56e-01 | -0.0876 |
| 79616 | CCNJL | C04 | Human | Oral cavity | OSCC | 9.15e-10 | 3.92e-01 | 0.2633 |
| 79616 | CCNJL | C30 | Human | Oral cavity | OSCC | 7.41e-37 | 1.12e+00 | 0.3055 |
| 79616 | CCNJL | C43 | Human | Oral cavity | OSCC | 5.92e-17 | 3.41e-01 | 0.1704 |
| 79616 | CCNJL | C46 | Human | Oral cavity | OSCC | 4.10e-08 | 1.76e-01 | 0.1673 |
| 79616 | CCNJL | C51 | Human | Oral cavity | OSCC | 5.33e-08 | 3.03e-01 | 0.2674 |
| 79616 | CCNJL | C06 | Human | Oral cavity | OSCC | 6.22e-04 | 7.31e-01 | 0.2699 |
| 79616 | CCNJL | LP15 | Human | Oral cavity | LP | 4.58e-04 | 3.44e-01 | 0.2174 |
| 79616 | CCNJL | SYSMH2 | Human | Oral cavity | OSCC | 1.68e-05 | 2.06e-01 | 0.2326 |
| 79616 | CCNJL | SYSMH3 | Human | Oral cavity | OSCC | 1.68e-09 | 2.67e-01 | 0.2442 |
| Page: 1 |
| Tissue | Expression Dynamics | Abbreviation |
| Colorectum (GSE201348) |  | FAP: Familial adenomatous polyposis |
| CRC: Colorectal cancer | ||
| Colorectum (HTA11) |  | AD: Adenomas |
| SER: Sessile serrated lesions | ||
| MSI-H: Microsatellite-high colorectal cancer | ||
| MSS: Microsatellite stable colorectal cancer | ||
| Lung |  | AAH: Atypical adenomatous hyperplasia |
| AIS: Adenocarcinoma in situ | ||
| IAC: Invasive lung adenocarcinoma | ||
| MIA: Minimally invasive adenocarcinoma | ||
| Oral Cavity | 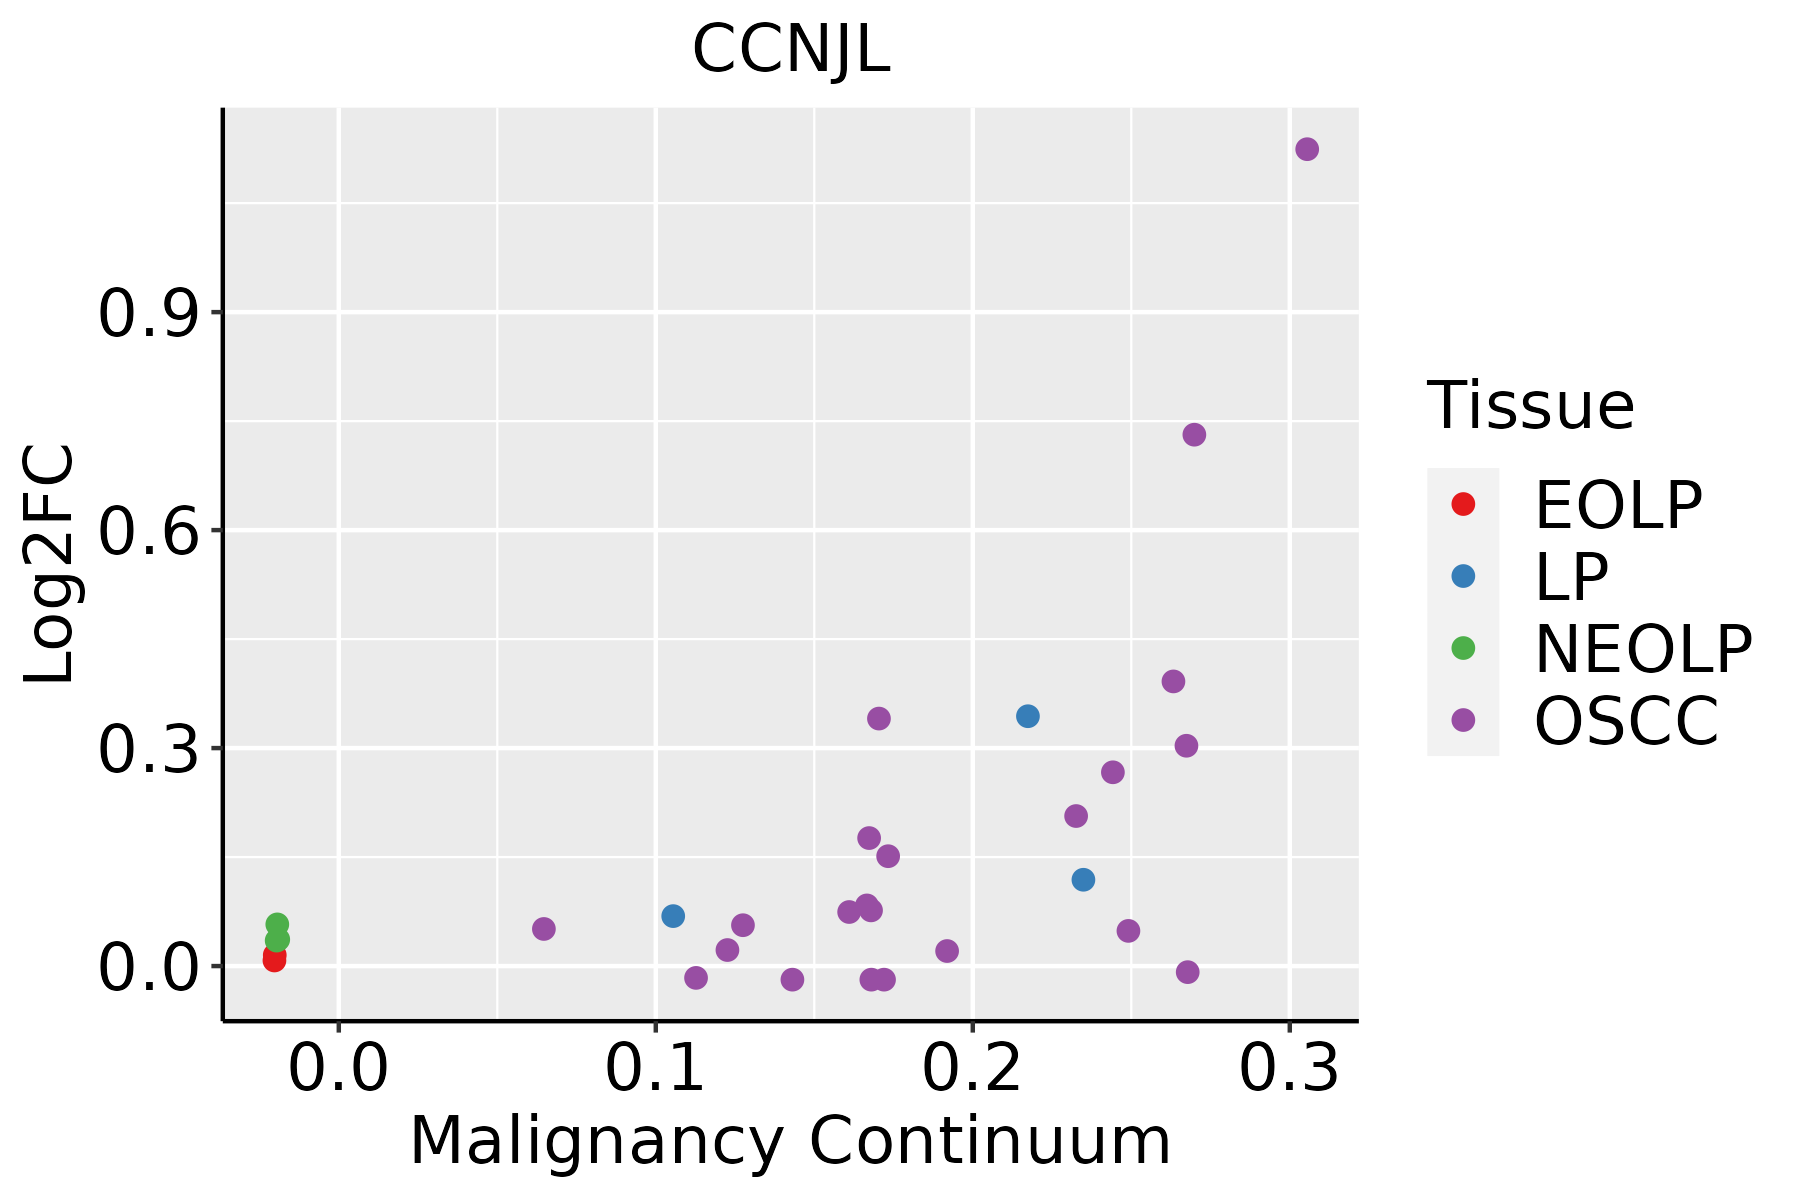 | EOLP: Erosive Oral lichen planus |
| LP: leukoplakia | ||
| NEOLP: Non-erosive oral lichen planus | ||
| OSCC: Oral squamous cell carcinoma |
| ∗log2FC in expression of this searched gene in stem-like cells from each diseased tissue sample relative to stem-like cells in normal samples in each tissue plotted against the malignancy continuum. Samples are colored based on if they are from different disease stage. |
Top |
Malignant transformation related pathway analysis |
| Find out the enriched GO biological processes and KEGG pathways involved in transition from healthy to precancer to cancer |
| Tissue | Disease Stage | Enriched GO biological Processes |
| Colorectum | AD |  |
| Colorectum | SER |  |
| Colorectum | MSS |  |
| Colorectum | MSI-H |  |
| Colorectum | FAP |  |
| ∗Top 15 enriched GO BP terms are showed in the bar plot of each disease state in each tissue. Each row represents a significant GO biological process which is colored according to the -log10(p.adjust). |
| Page: 1 2 3 4 5 6 7 8 9 |
| GO ID | Tissue | Disease Stage | Description | Gene Ratio | Bg Ratio | pvalue | p.adjust | Count |
| GO:0071900 | Colorectum | AD | regulation of protein serine/threonine kinase activity | 98/3918 | 359/18723 | 2.18e-03 | 1.73e-02 | 98 |
| GO:00447723 | Lung | IAC | mitotic cell cycle phase transition | 85/2061 | 424/18723 | 2.69e-08 | 3.20e-06 | 85 |
| GO:00719006 | Lung | IAC | regulation of protein serine/threonine kinase activity | 71/2061 | 359/18723 | 6.33e-07 | 3.72e-05 | 71 |
| GO:007190012 | Lung | AIS | regulation of protein serine/threonine kinase activity | 61/1849 | 359/18723 | 1.76e-05 | 6.17e-04 | 61 |
| GO:004477211 | Lung | AIS | mitotic cell cycle phase transition | 69/1849 | 424/18723 | 2.23e-05 | 7.42e-04 | 69 |
| GO:004477221 | Lung | MIAC | mitotic cell cycle phase transition | 41/967 | 424/18723 | 8.79e-05 | 3.92e-03 | 41 |
| GO:007190022 | Lung | MIAC | regulation of protein serine/threonine kinase activity | 31/967 | 359/18723 | 3.65e-03 | 4.60e-02 | 31 |
| GO:00447728 | Oral cavity | OSCC | mitotic cell cycle phase transition | 255/7305 | 424/18723 | 5.29e-19 | 6.98e-17 | 255 |
| GO:007190010 | Oral cavity | OSCC | regulation of protein serine/threonine kinase activity | 201/7305 | 359/18723 | 3.90e-11 | 1.27e-09 | 201 |
| GO:19040293 | Oral cavity | OSCC | regulation of cyclin-dependent protein kinase activity | 60/7305 | 98/18723 | 6.90e-06 | 7.56e-05 | 60 |
| GO:00000793 | Oral cavity | OSCC | regulation of cyclin-dependent protein serine/threonine kinase activity | 58/7305 | 94/18723 | 6.92e-06 | 7.57e-05 | 58 |
| GO:004477215 | Oral cavity | LP | mitotic cell cycle phase transition | 150/4623 | 424/18723 | 4.38e-07 | 1.23e-05 | 150 |
| GO:007190015 | Oral cavity | LP | regulation of protein serine/threonine kinase activity | 119/4623 | 359/18723 | 1.70e-04 | 1.90e-03 | 119 |
| GO:000007911 | Oral cavity | LP | regulation of cyclin-dependent protein serine/threonine kinase activity | 34/4623 | 94/18723 | 8.52e-03 | 4.61e-02 | 34 |
| Page: 1 |
| Pathway ID | Tissue | Disease Stage | Description | Gene Ratio | Bg Ratio | pvalue | p.adjust | qvalue | Count |
| Page: 1 |
Top |
Cell-cell communication analysis |
| Identification of potential cell-cell interactions between two cell types and their ligand-receptor pairs for different disease states |
| Ligand | Receptor | LRpair | Pathway | Tissue | Disease Stage |
| Page: 1 |
Top |
Single-cell gene regulatory network inference analysis |
| Find out the significant the regulons (TFs) and the target genes of each regulon across cell types for different disease states |
| TF | Cell Type | Tissue | Disease Stage | Target Gene | RSS | Regulon Activity |
| ∗The dot plots of a searched regulon are shown for all cell subpopulations in each disease state of each tissue based on the regulon specific score inferred using pySCENIC and by calculating the average expression. |
| Page: 1 |
Top |
Somatic mutation of malignant transformation related genes |
| Annotation of somatic variants for genes involved in malignant transformation |
| Hugo Symbol | Variant Class | Variant Classification | dbSNP RS | HGVSc | HGVSp | HGVSp Short | SWISSPROT | BIOTYPE | SIFT | PolyPhen | Tumor Sample Barcode | Tissue | Histology | Sex | Age | Stage | Therapy Types | Drugs | Outcome |
| CCNJL | insertion | Frame_Shift_Ins | novel | c.1090_1091insTTTTAGA | p.His364LeufsTer39 | p.H364Lfs*39 | Q8IV13 | protein_coding | TCGA-A8-A079-01 | Breast | breast invasive carcinoma | Female | >=65 | III/IV | Chemotherapy | 5-fluorouracil | SD | ||
| CCNJL | insertion | Frame_Shift_Ins | novel | c.559_560insCTGCAAGCTCCGCCTCCCAGGTTCAAGCGATT | p.Ser187ThrfsTer62 | p.S187Tfs*62 | Q8IV13 | protein_coding | TCGA-A8-A07J-01 | Breast | breast invasive carcinoma | Female | <65 | I/II | Chemotherapy | 5-fluorouracil | CR | ||
| CCNJL | deletion | Frame_Shift_Del | novel | c.678delN | p.Glu227SerfsTer11 | p.E227Sfs*11 | Q8IV13 | protein_coding | TCGA-EW-A2FV-01 | Breast | breast invasive carcinoma | Female | <65 | III/IV | Chemotherapy | docetaxel | SD | ||
| CCNJL | SNV | Missense_Mutation | novel | c.1204C>T | p.His402Tyr | p.H402Y | Q8IV13 | protein_coding | deleterious(0) | benign(0.125) | TCGA-2W-A8YY-01 | Cervix | cervical & endocervical cancer | Female | <65 | I/II | Chemotherapy | cisplatin | CR |
| CCNJL | SNV | Missense_Mutation | c.1151N>T | p.Pro384Leu | p.P384L | Q8IV13 | protein_coding | tolerated(0.08) | benign(0.014) | TCGA-Q1-A73P-01 | Cervix | cervical & endocervical cancer | Female | <65 | I/II | Unknown | Unknown | SD | |
| CCNJL | SNV | Missense_Mutation | novel | c.785N>T | p.Ser262Phe | p.S262F | Q8IV13 | protein_coding | deleterious(0) | probably_damaging(0.963) | TCGA-VS-A958-01 | Cervix | cervical & endocervical cancer | Female | <65 | I/II | Chemotherapy | cisplatin | CR |
| CCNJL | SNV | Missense_Mutation | c.1066N>A | p.Ala356Thr | p.A356T | Q8IV13 | protein_coding | tolerated(0.08) | possibly_damaging(0.804) | TCGA-A6-3809-01 | Colorectum | colon adenocarcinoma | Female | >=65 | I/II | Unknown | Unknown | SD | |
| CCNJL | SNV | Missense_Mutation | rs773517273 | c.179N>A | p.Arg60Gln | p.R60Q | Q8IV13 | protein_coding | deleterious(0.05) | probably_damaging(0.999) | TCGA-A6-6653-01 | Colorectum | colon adenocarcinoma | Male | >=65 | I/II | Unknown | Unknown | SD |
| CCNJL | SNV | Missense_Mutation | c.1123G>T | p.Gly375Cys | p.G375C | Q8IV13 | protein_coding | tolerated(0.08) | possibly_damaging(0.579) | TCGA-AD-6889-01 | Colorectum | colon adenocarcinoma | Male | >=65 | I/II | Chemotherapy | xeloda | PD | |
| CCNJL | SNV | Missense_Mutation | c.538C>A | p.Leu180Met | p.L180M | Q8IV13 | protein_coding | tolerated(0.16) | possibly_damaging(0.786) | TCGA-AD-6889-01 | Colorectum | colon adenocarcinoma | Male | >=65 | I/II | Chemotherapy | xeloda | PD |
| Page: 1 2 3 4 5 |
Top |
Related drugs of malignant transformation related genes |
| Identification of chemicals and drugs interact with genes involved in malignant transfromation |
| (DGIdb 4.0) |
| Entrez ID | Symbol | Category | Interaction Types | Drug Claim Name | Drug Name | PMIDs |
| Page: 1 |

Copyright 2023-Present -The University of Texas Health Science Center at Houston |