
|
|||||
|
 | |
| |
| |
| |
| |
| |
|
Gene: CCNI |
Gene summary for CCNI |
| Gene information | Species | Human | Gene symbol | CCNI | Gene ID | 10983 |
| Gene name | cyclin I | |
| Gene Alias | CCNI1 | |
| Cytomap | 4q21.1 | |
| Gene Type | protein-coding | GO ID | GO:0000003 | UniProtAcc | A0A024RDH0 |
Top |
Malignant transformation analysis |
| Identification of the aberrant gene expression in precancerous and cancerous lesions by comparing the gene expression of stem-like cells in diseased tissues with normal stem cells |
| Entrez ID | Symbol | Replicates | Species | Organ | Tissue | Adj P-value | Log2FC | Malignancy |
| 10983 | CCNI | GSM4909280 | Human | Breast | Precancer | 5.40e-06 | -8.06e-01 | 0.0305 |
| 10983 | CCNI | GSM4909282 | Human | Breast | IDC | 7.94e-05 | -2.86e-01 | -0.0288 |
| 10983 | CCNI | GSM4909286 | Human | Breast | IDC | 4.80e-05 | 2.65e-01 | 0.1081 |
| 10983 | CCNI | GSM4909287 | Human | Breast | IDC | 3.07e-03 | -3.35e-01 | 0.2057 |
| 10983 | CCNI | GSM4909289 | Human | Breast | IDC | 1.25e-08 | 4.51e-01 | 0.1064 |
| 10983 | CCNI | GSM4909291 | Human | Breast | IDC | 4.51e-05 | -4.30e-01 | 0.1753 |
| 10983 | CCNI | GSM4909293 | Human | Breast | IDC | 9.37e-163 | 9.78e-01 | 0.1581 |
| 10983 | CCNI | GSM4909294 | Human | Breast | IDC | 3.30e-14 | -1.49e-01 | 0.2022 |
| 10983 | CCNI | GSM4909296 | Human | Breast | IDC | 1.74e-32 | -5.95e-01 | 0.1524 |
| 10983 | CCNI | GSM4909297 | Human | Breast | IDC | 1.04e-42 | -1.21e-01 | 0.1517 |
| 10983 | CCNI | GSM4909298 | Human | Breast | IDC | 5.40e-11 | 3.08e-01 | 0.1551 |
| 10983 | CCNI | GSM4909305 | Human | Breast | IDC | 1.60e-09 | 3.45e-01 | 0.0436 |
| 10983 | CCNI | GSM4909306 | Human | Breast | IDC | 1.64e-04 | 2.43e-01 | 0.1564 |
| 10983 | CCNI | GSM4909307 | Human | Breast | IDC | 3.88e-02 | -2.41e-01 | 0.1569 |
| 10983 | CCNI | GSM4909308 | Human | Breast | IDC | 2.58e-04 | 2.50e-01 | 0.158 |
| 10983 | CCNI | GSM4909309 | Human | Breast | IDC | 4.02e-02 | -1.35e-01 | 0.0483 |
| 10983 | CCNI | GSM4909311 | Human | Breast | IDC | 2.50e-58 | -4.72e-01 | 0.1534 |
| 10983 | CCNI | GSM4909312 | Human | Breast | IDC | 9.04e-52 | 4.89e-01 | 0.1552 |
| 10983 | CCNI | GSM4909313 | Human | Breast | IDC | 2.03e-25 | 3.49e-01 | 0.0391 |
| 10983 | CCNI | GSM4909315 | Human | Breast | IDC | 1.29e-05 | -3.03e-01 | 0.21 |
| Page: 1 2 3 4 5 6 7 8 9 10 11 12 13 14 15 16 |
| Tissue | Expression Dynamics | Abbreviation |
| Breast | 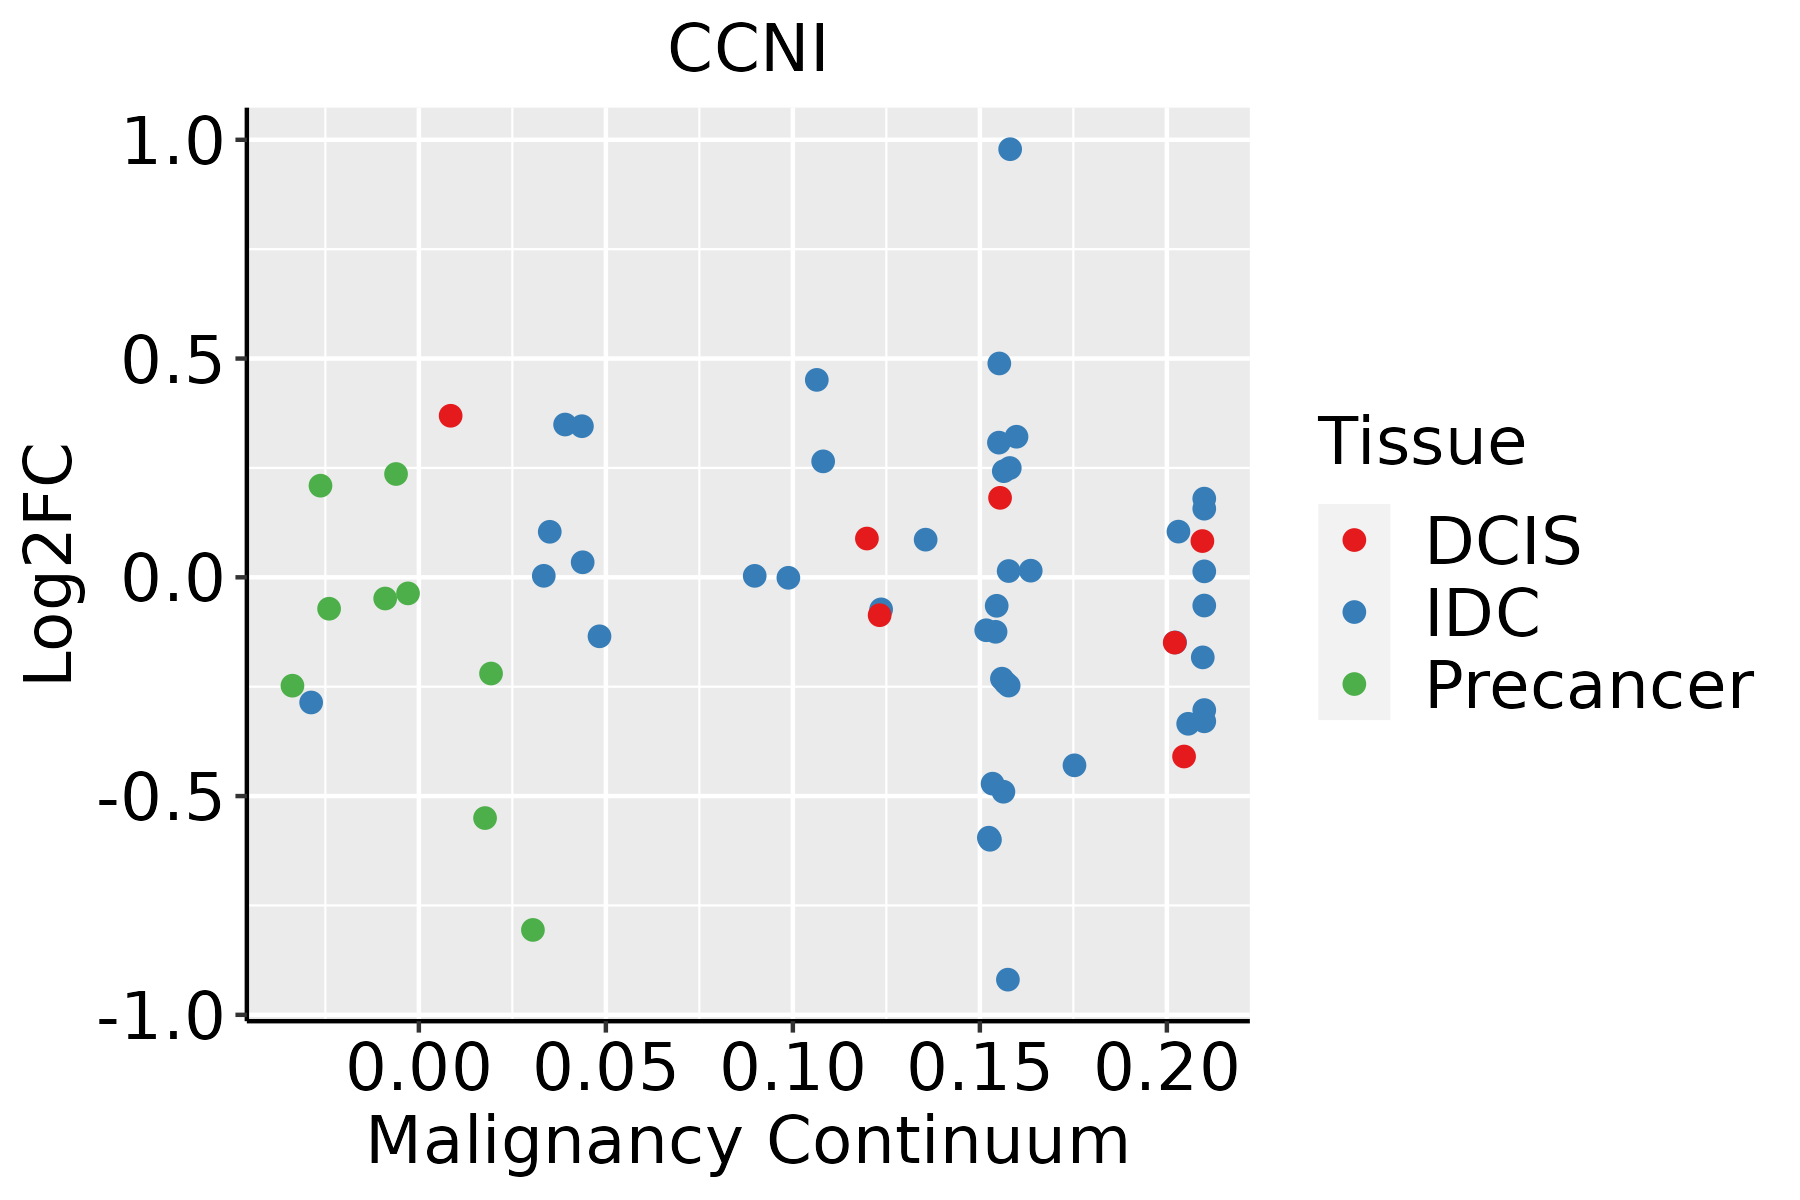 | IDC: Invasive ductal carcinoma |
| DCIS: Ductal carcinoma in situ | ||
| Precancer(BRCA1-mut): Precancerous lesion from BRCA1 mutation carriers | ||
| Cervix | 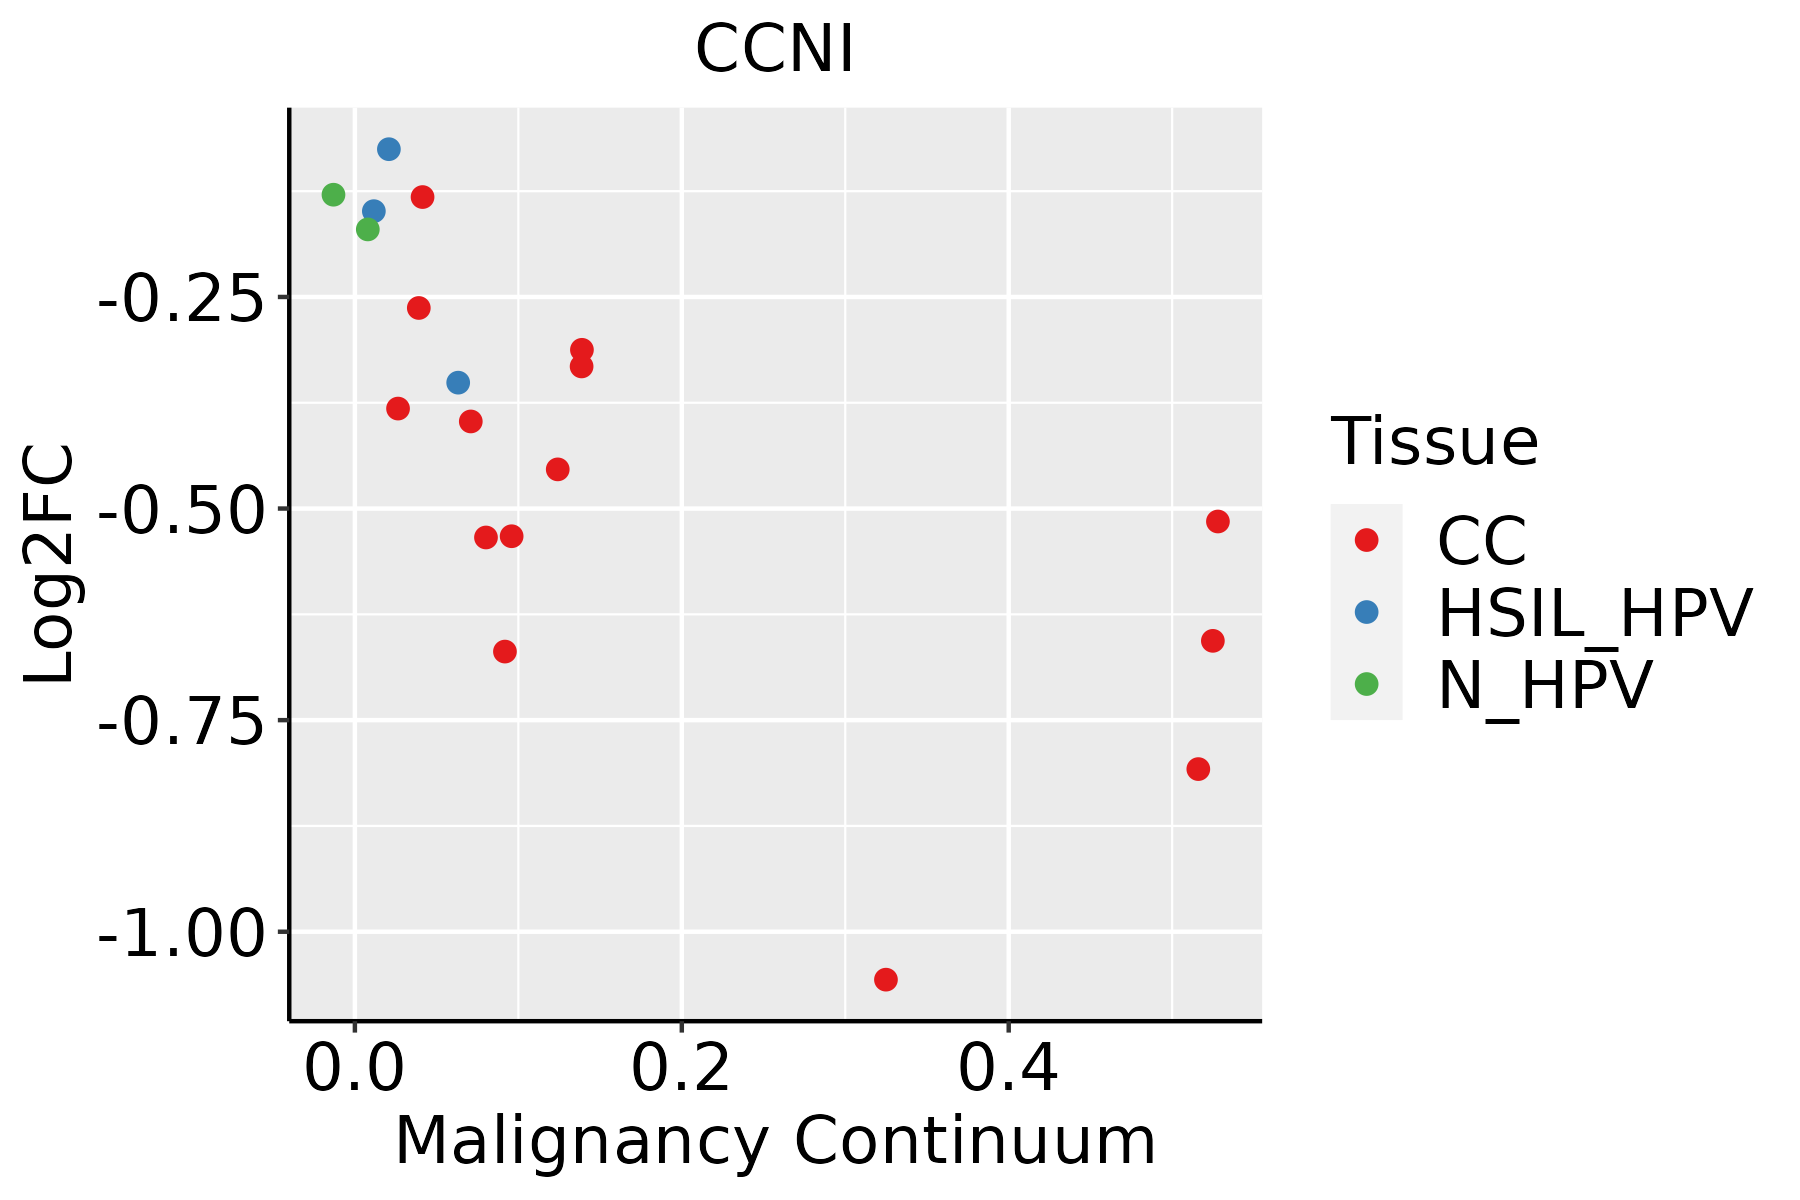 | CC: Cervix cancer |
| HSIL_HPV: HPV-infected high-grade squamous intraepithelial lesions | ||
| N_HPV: HPV-infected normal cervix | ||
| Colorectum (GSE201348) |  | FAP: Familial adenomatous polyposis |
| CRC: Colorectal cancer | ||
| Colorectum (HTA11) |  | AD: Adenomas |
| SER: Sessile serrated lesions | ||
| MSI-H: Microsatellite-high colorectal cancer | ||
| MSS: Microsatellite stable colorectal cancer | ||
| Endometrium | 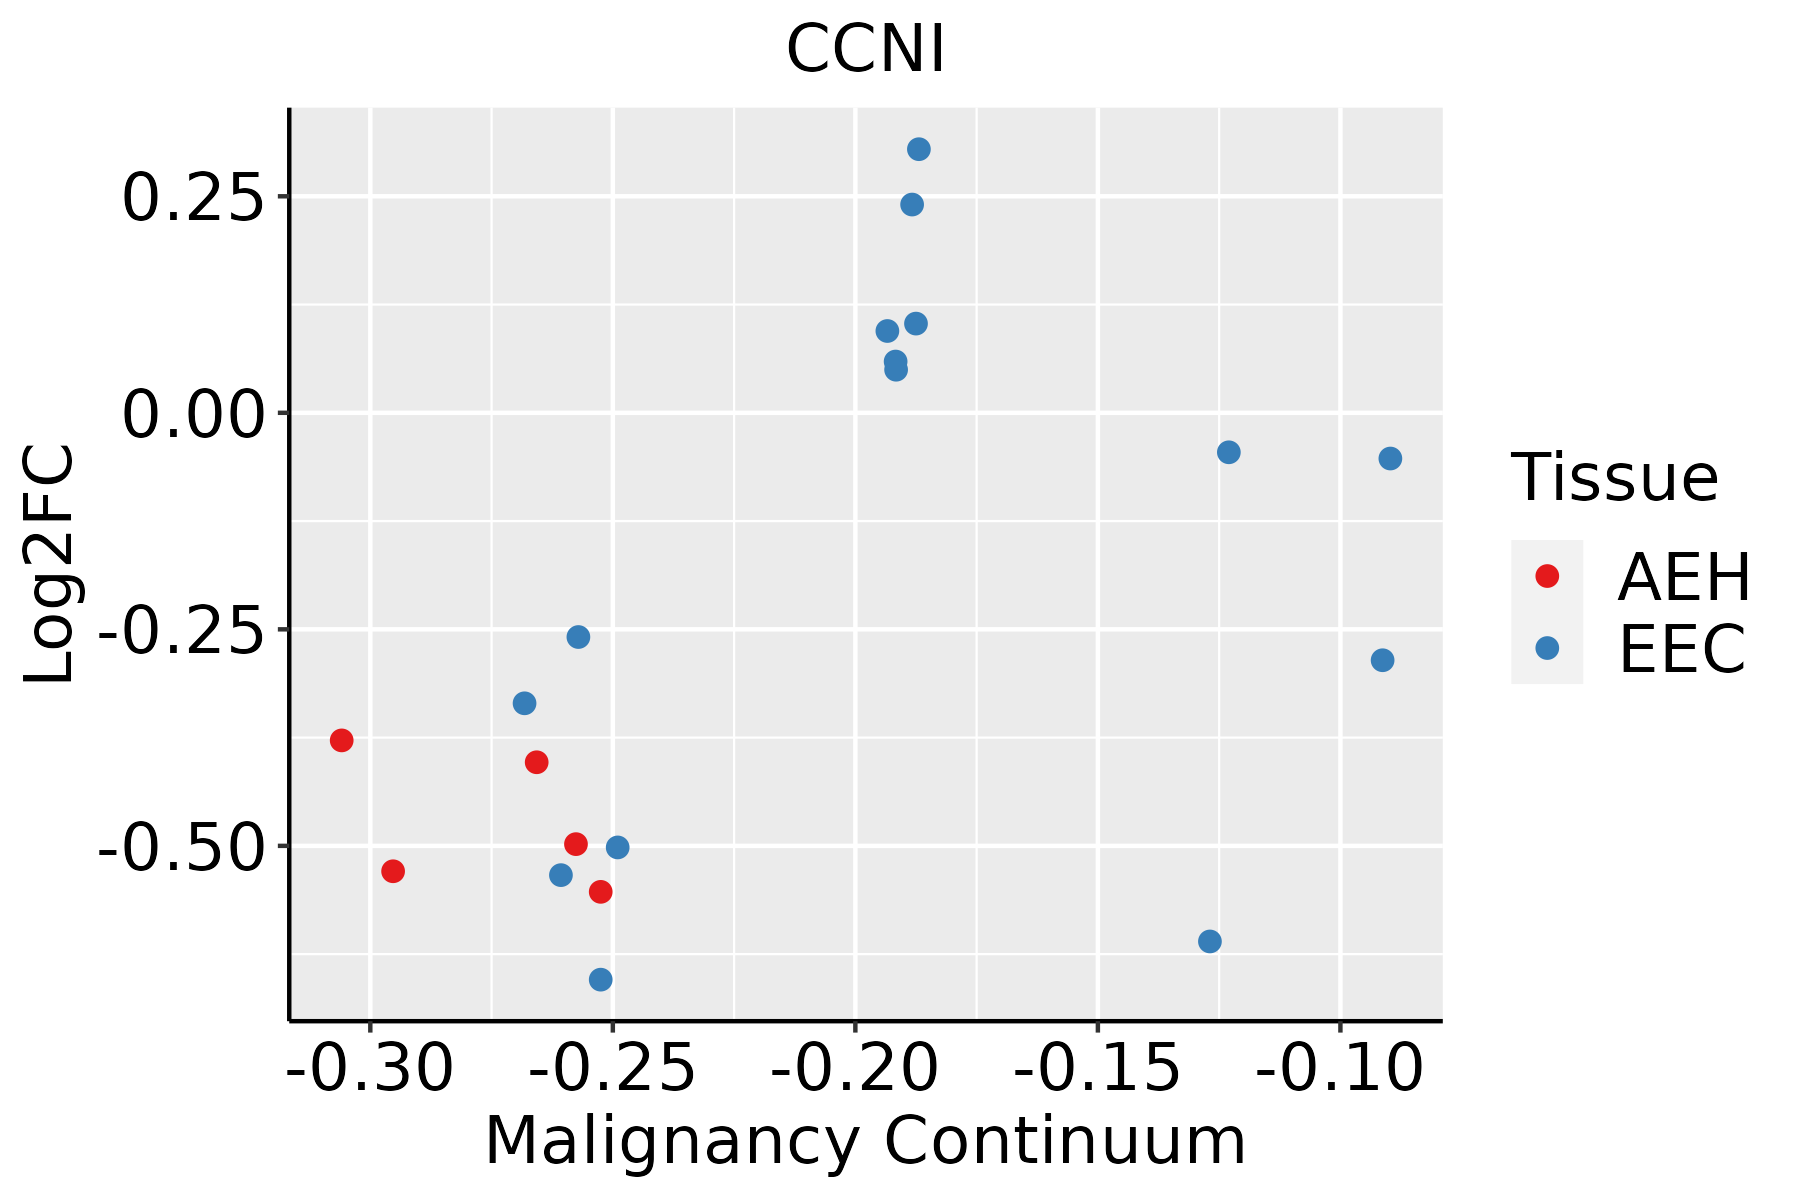 | AEH: Atypical endometrial hyperplasia |
| EEC: Endometrioid Cancer | ||
| Esophagus | 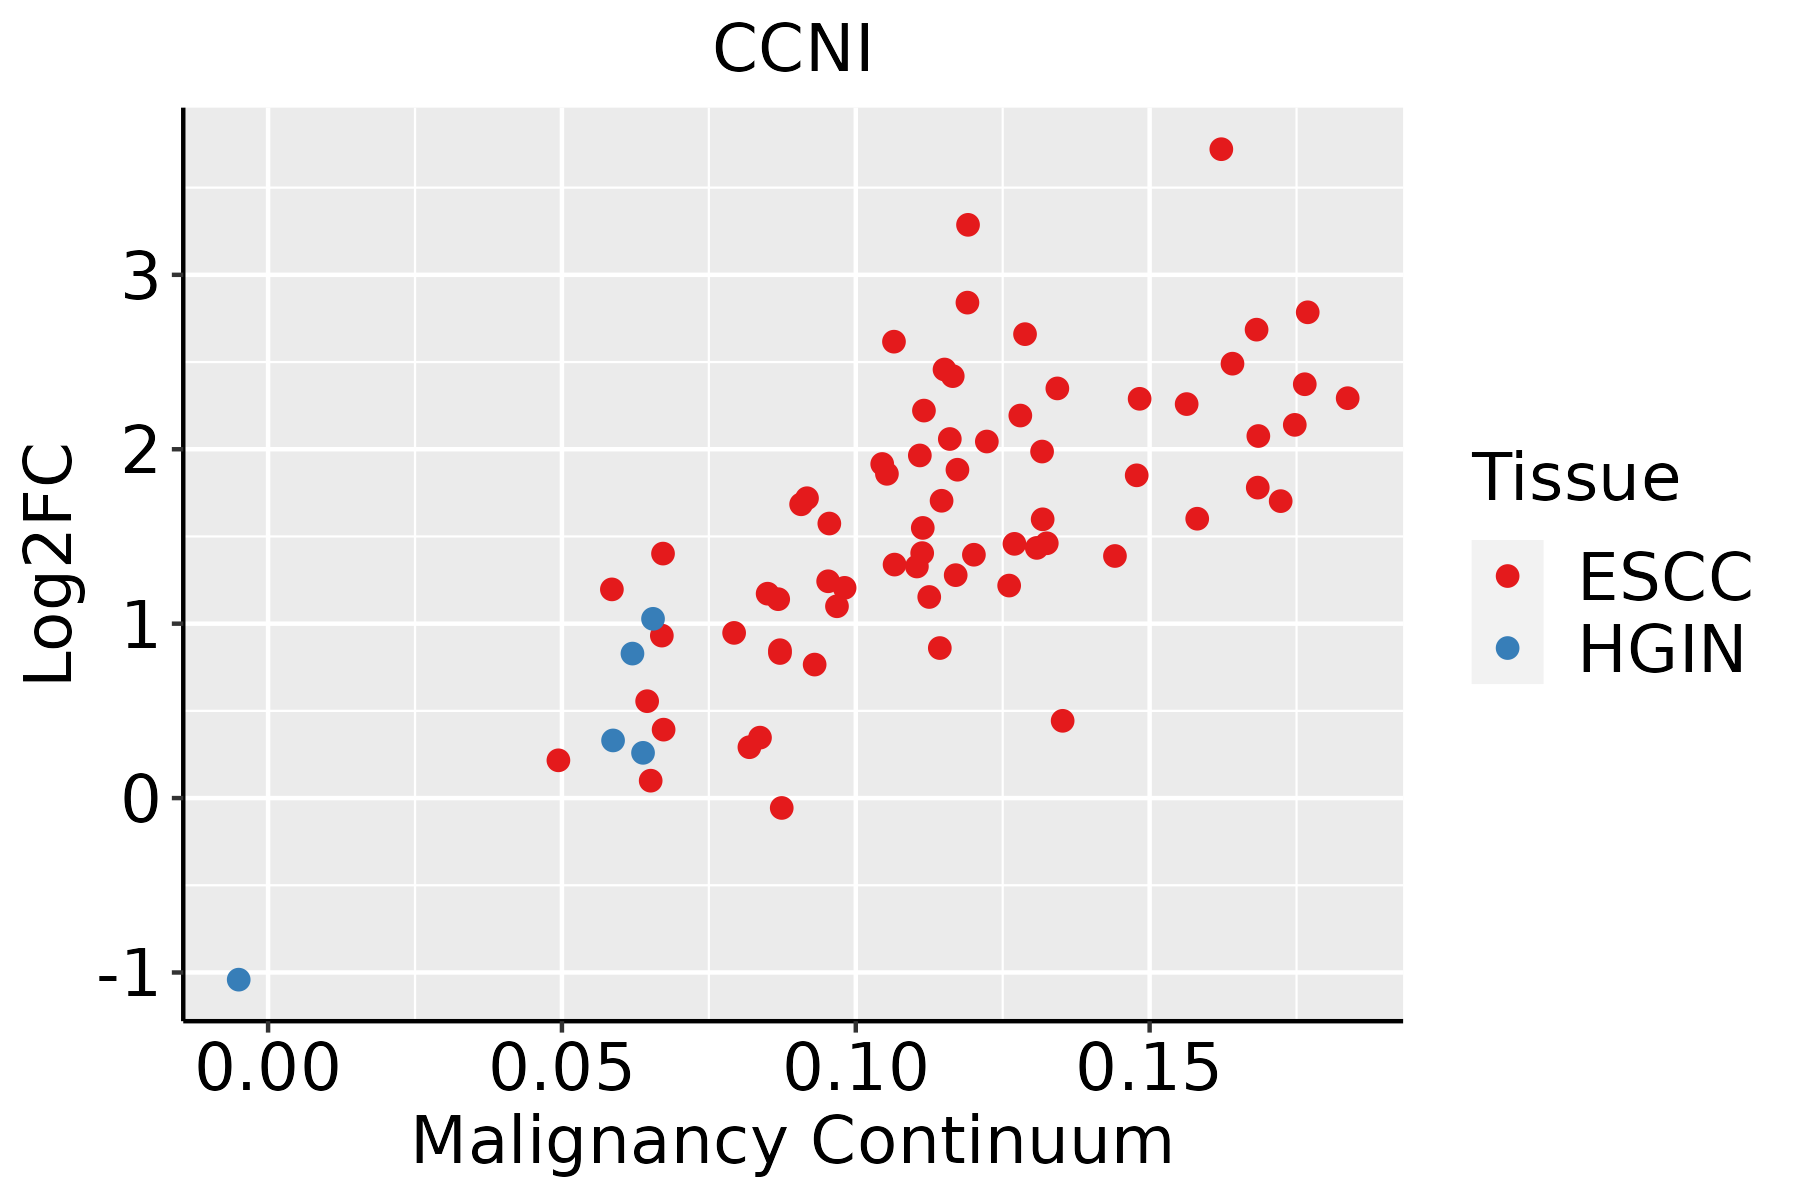 | ESCC: Esophageal squamous cell carcinoma |
| HGIN: High-grade intraepithelial neoplasias | ||
| LGIN: Low-grade intraepithelial neoplasias | ||
| Liver | 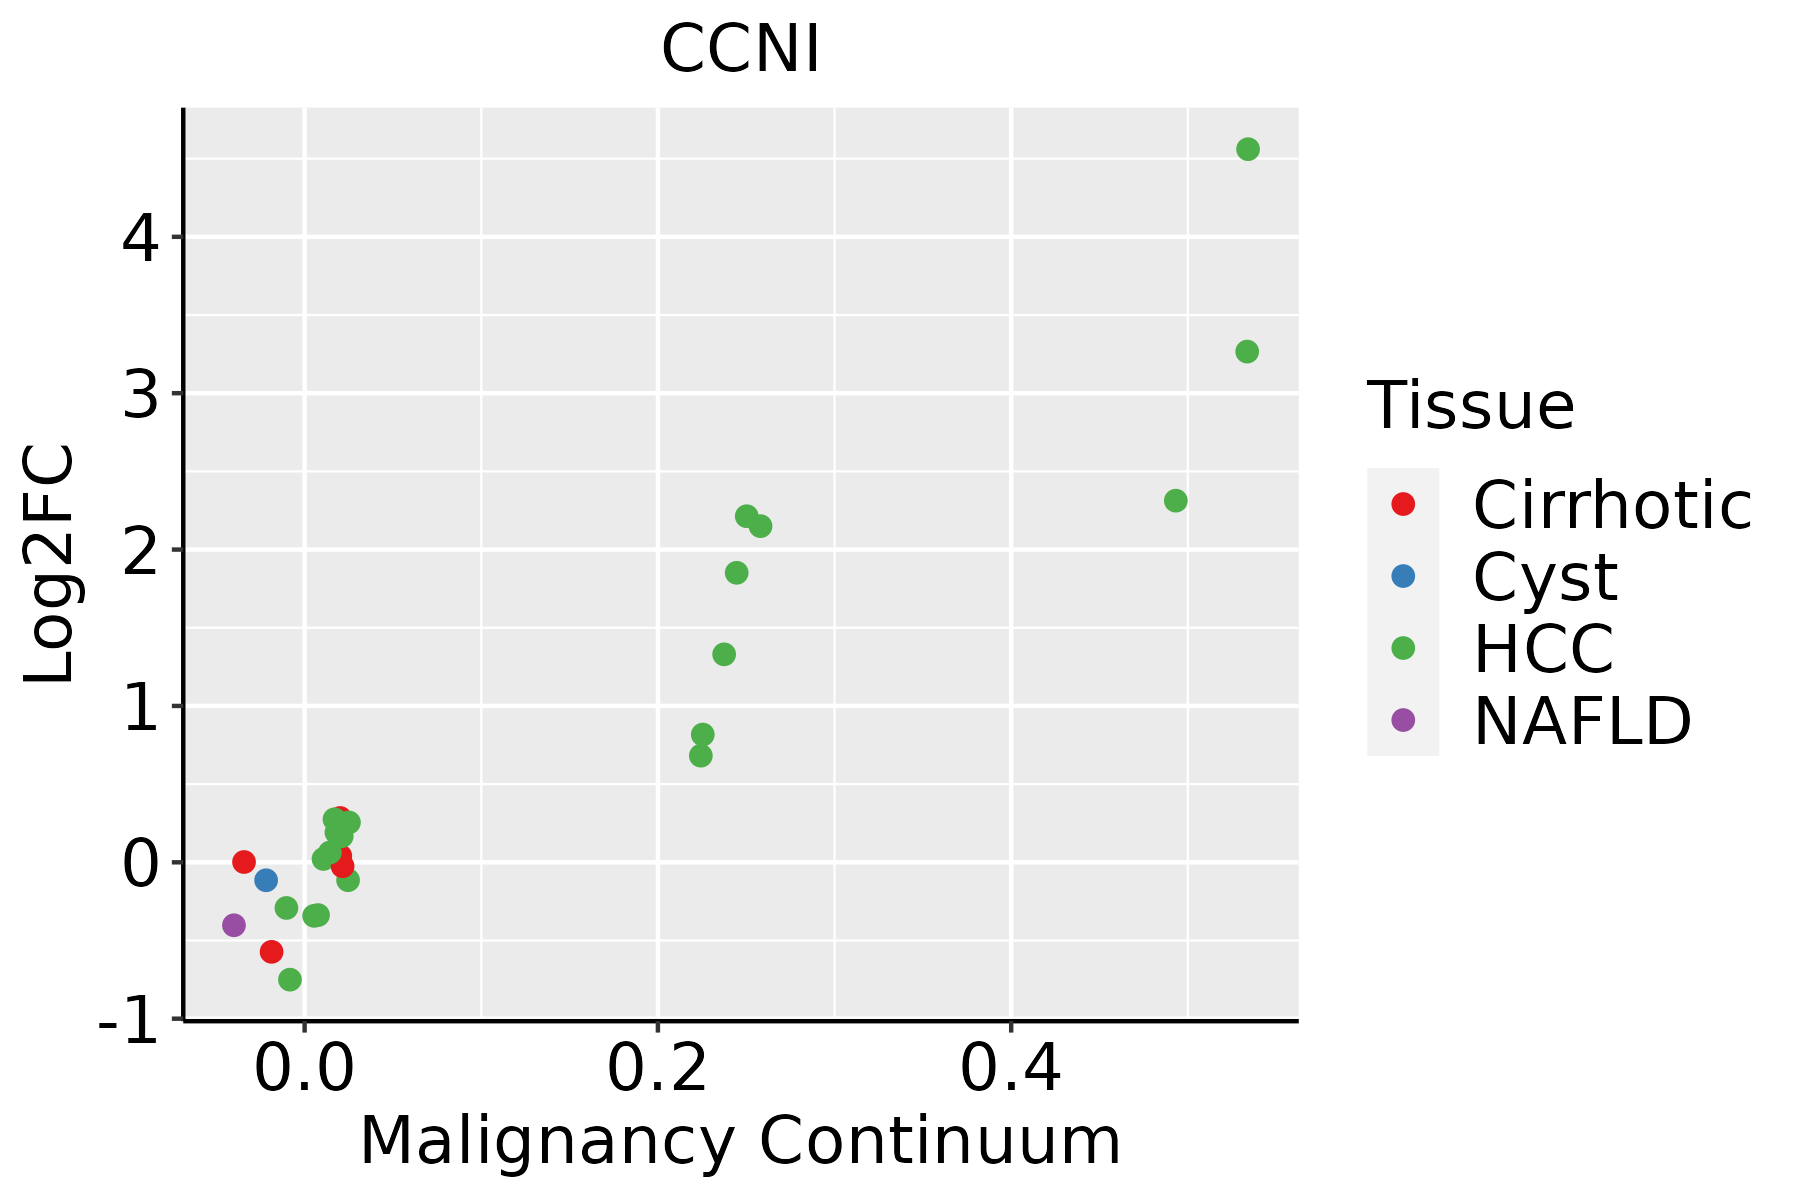 | HCC: Hepatocellular carcinoma |
| NAFLD: Non-alcoholic fatty liver disease | ||
| Lung | 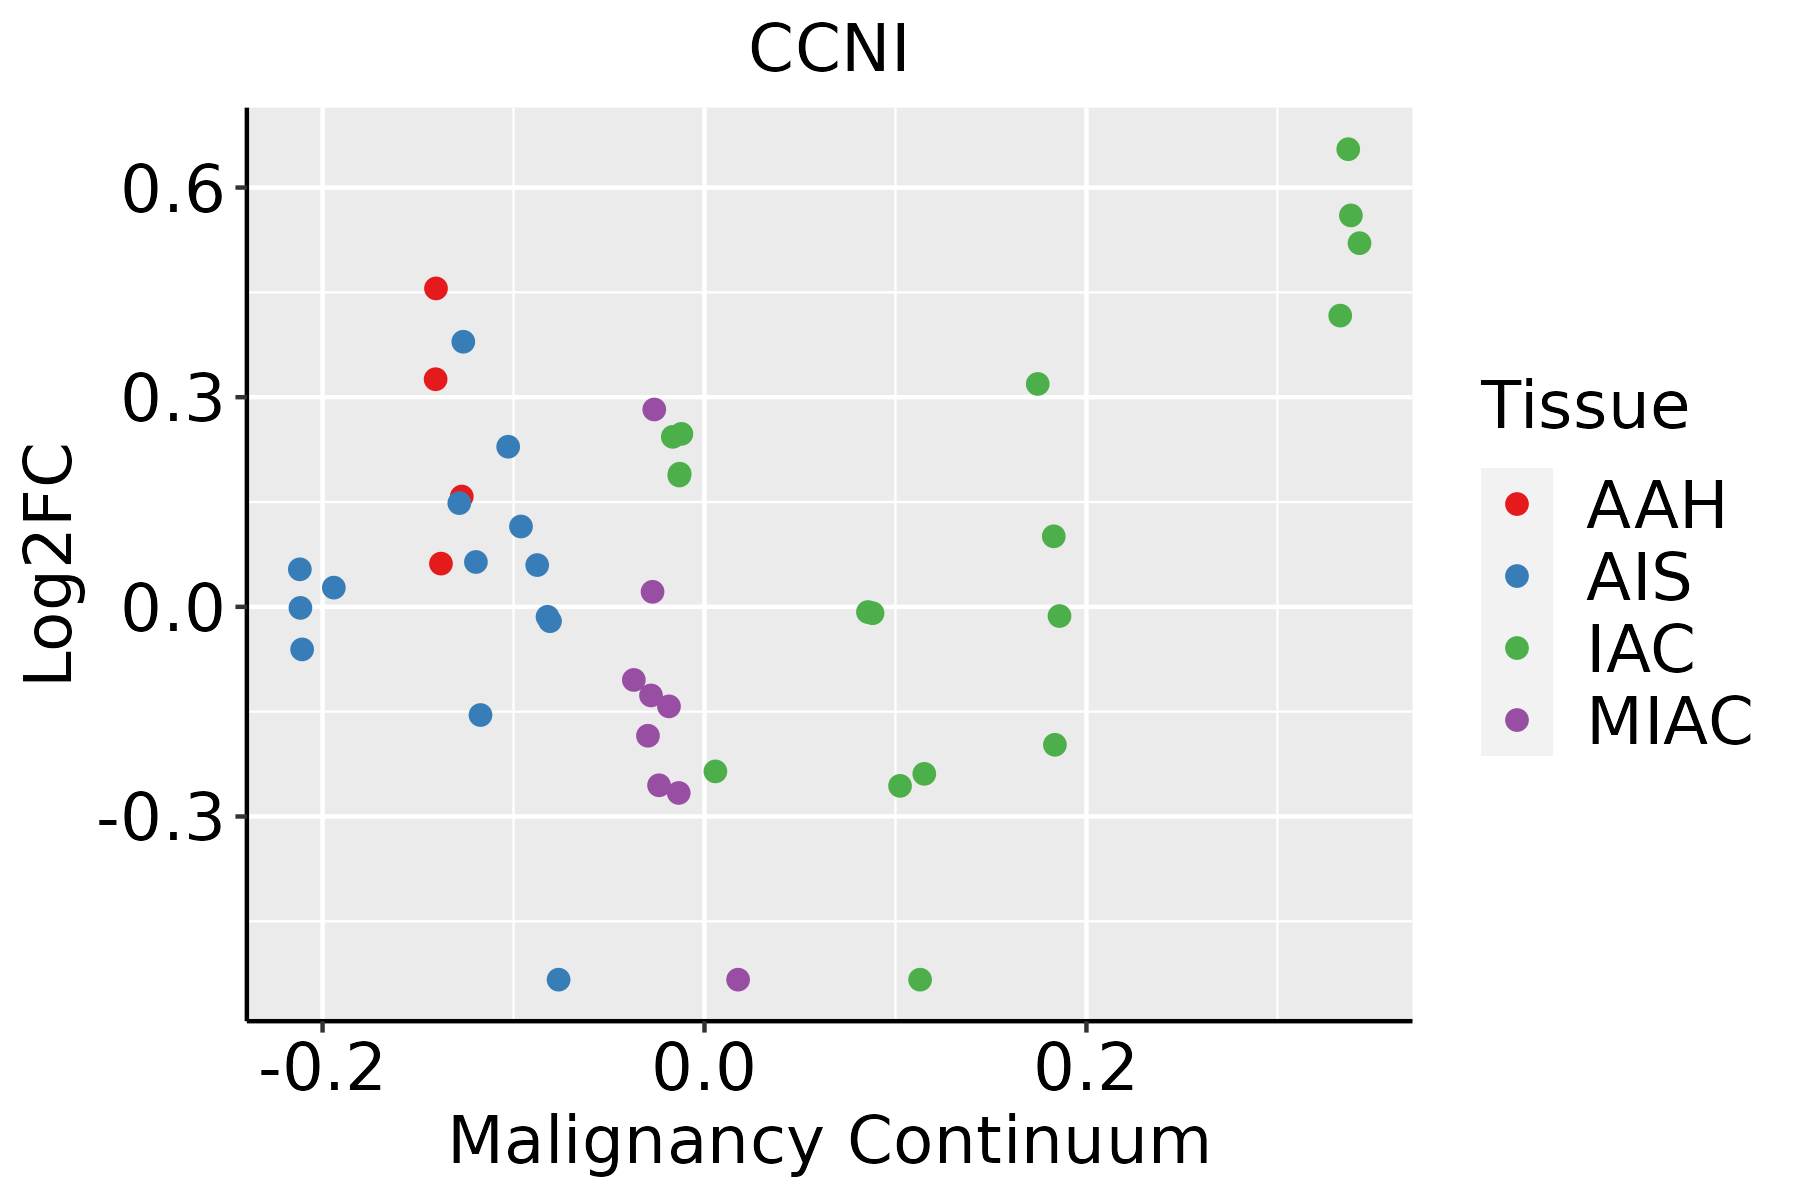 | AAH: Atypical adenomatous hyperplasia |
| AIS: Adenocarcinoma in situ | ||
| IAC: Invasive lung adenocarcinoma | ||
| MIA: Minimally invasive adenocarcinoma | ||
| Oral Cavity |  | EOLP: Erosive Oral lichen planus |
| LP: leukoplakia | ||
| NEOLP: Non-erosive oral lichen planus | ||
| OSCC: Oral squamous cell carcinoma | ||
| Prostate | 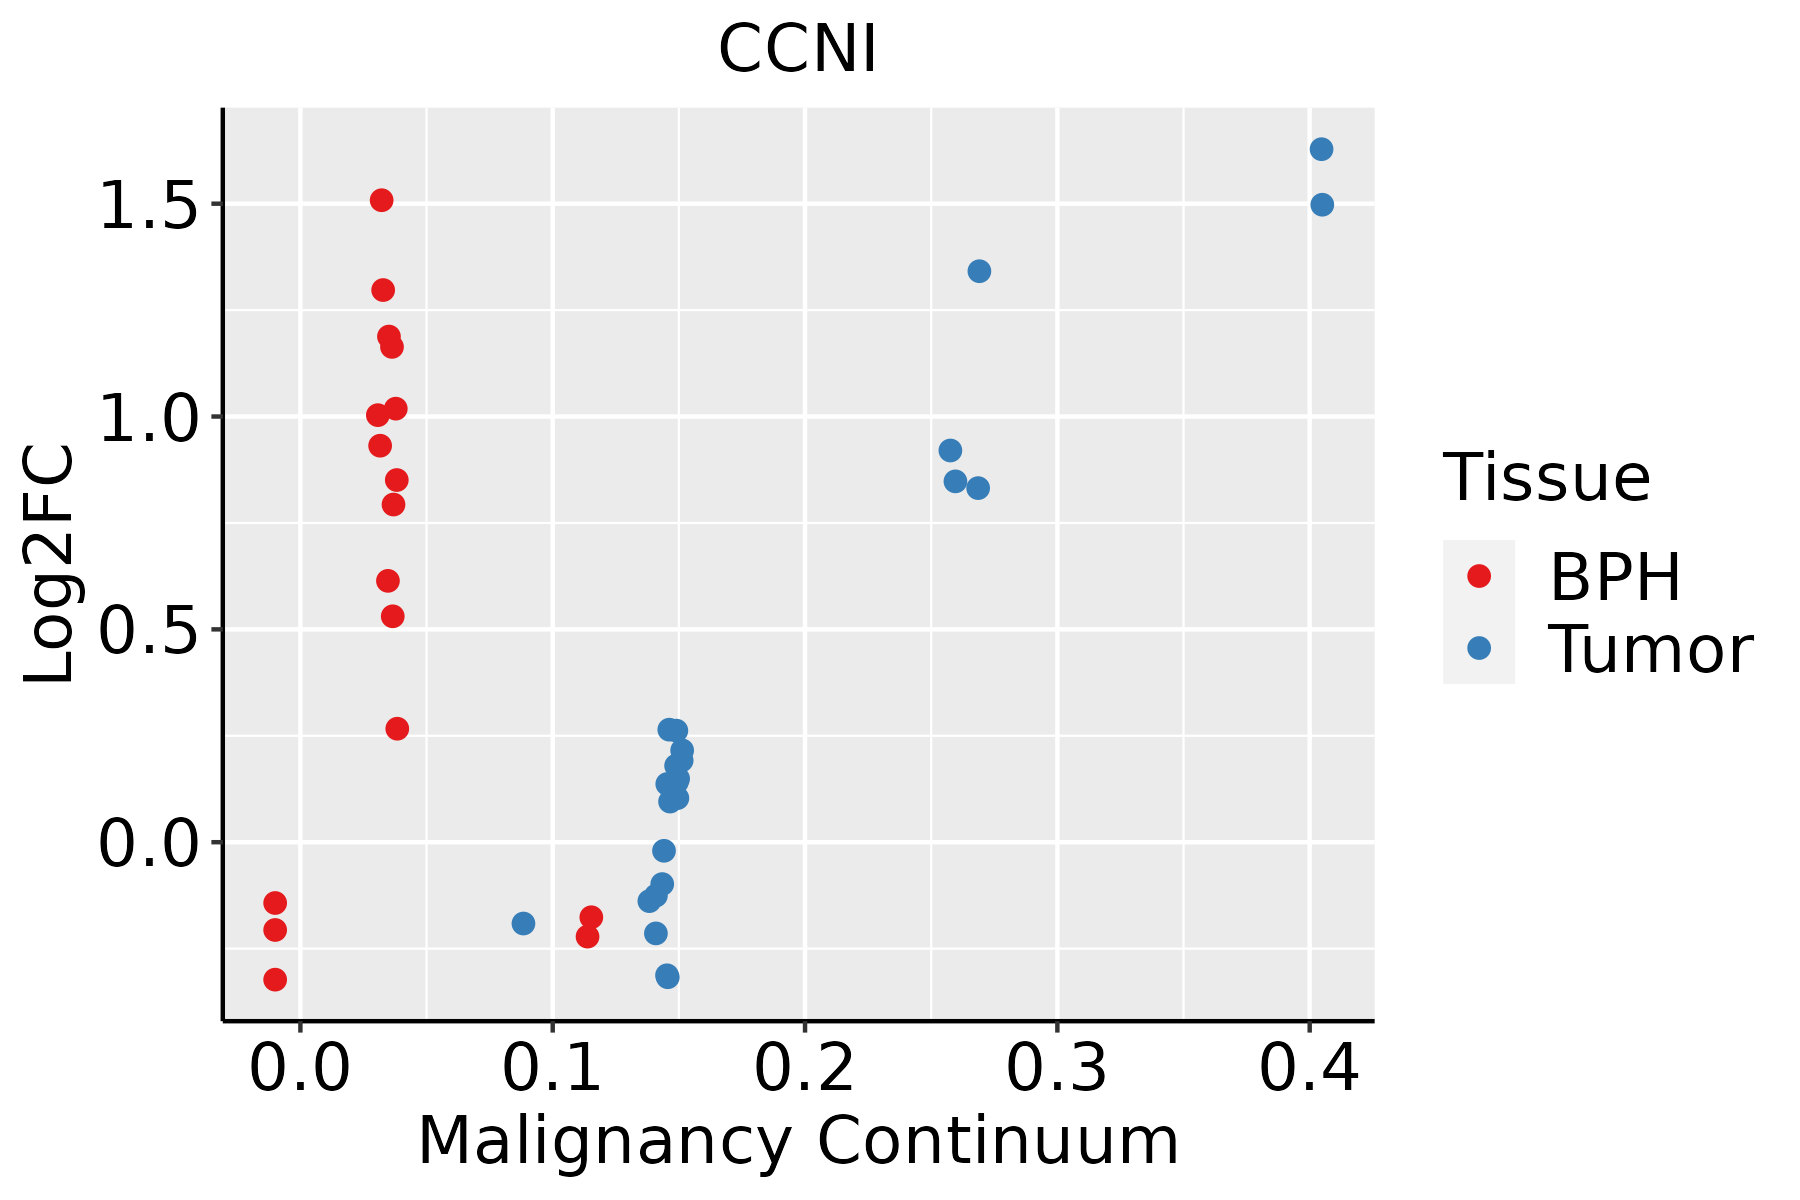 | BPH: Benign Prostatic Hyperplasia |
| Skin | 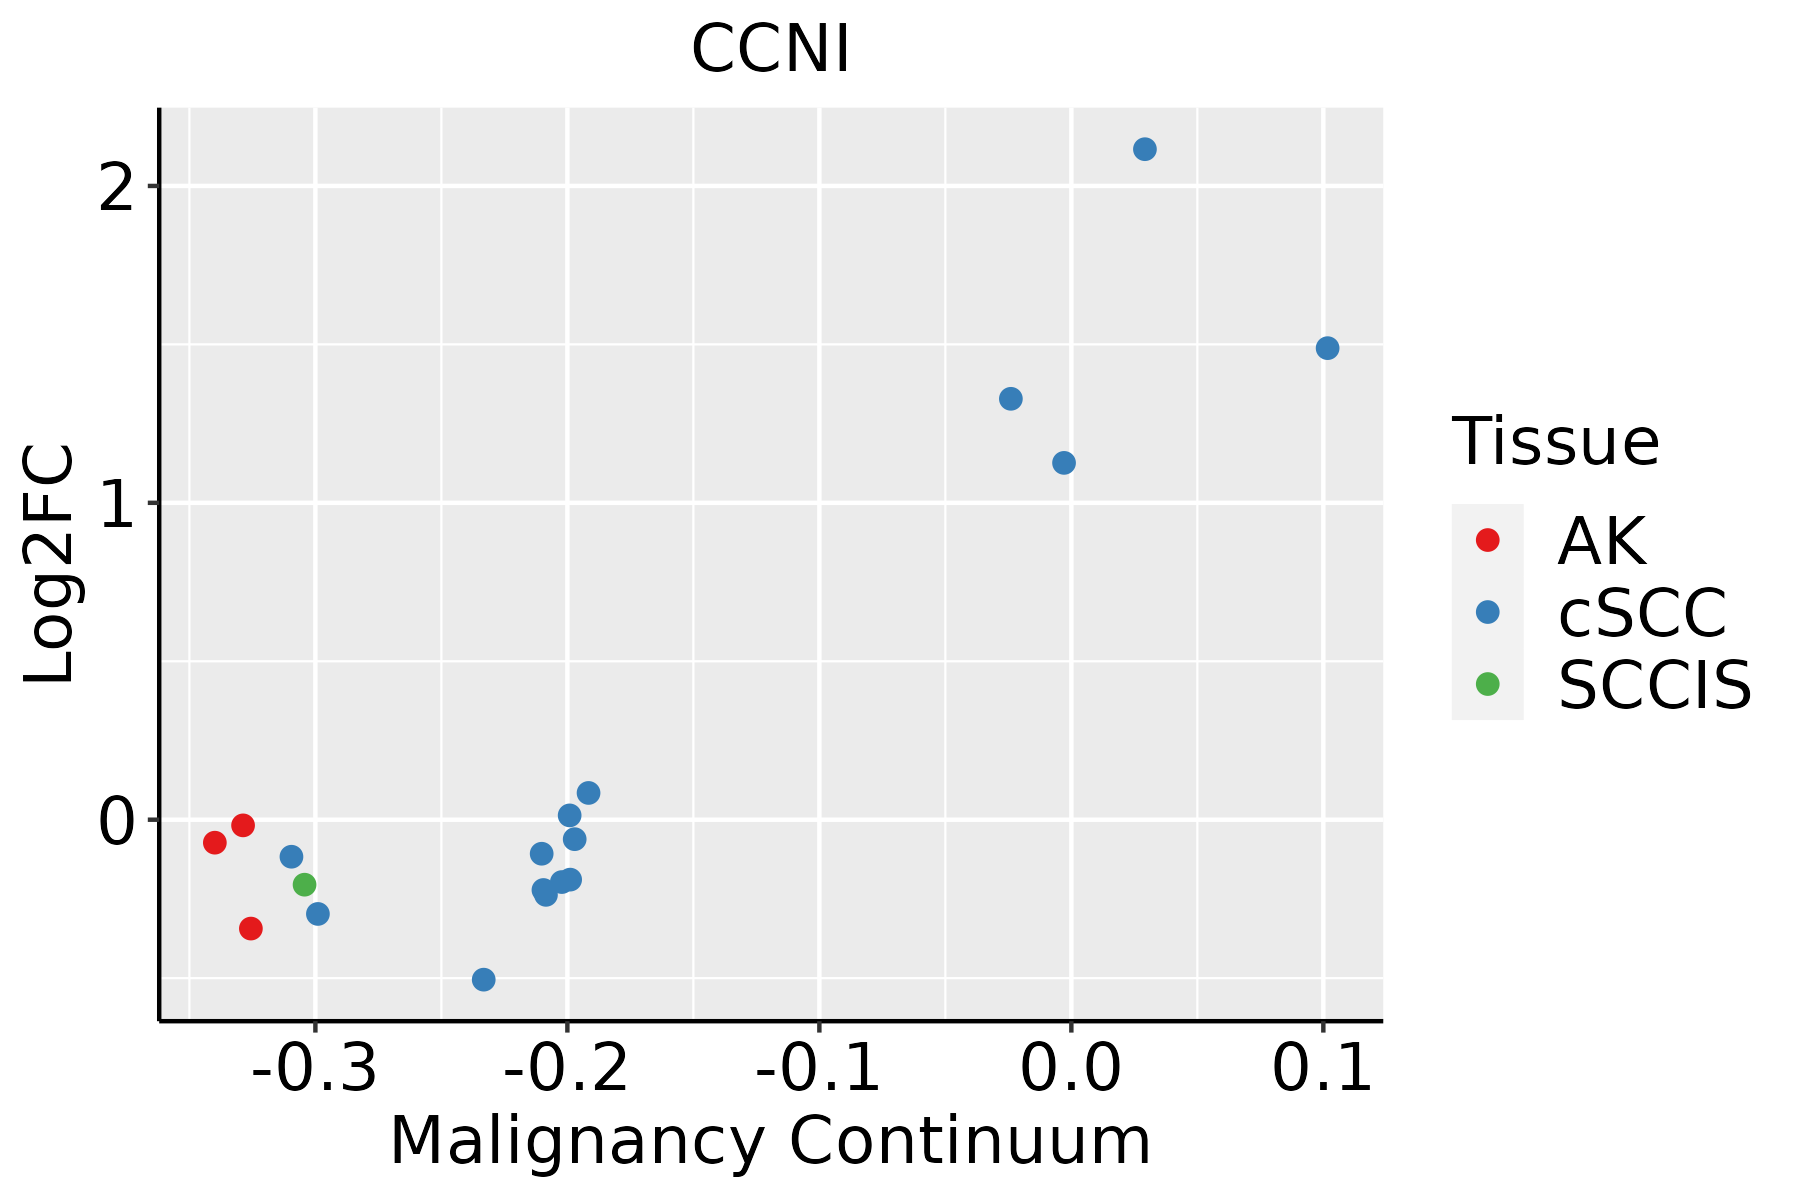 | AK: Actinic keratosis |
| cSCC: Cutaneous squamous cell carcinoma | ||
| SCCIS:squamous cell carcinoma in situ | ||
| Thyroid |  | ATC: Anaplastic thyroid cancer |
| HT: Hashimoto's thyroiditis | ||
| PTC: Papillary thyroid cancer |
| ∗log2FC in expression of this searched gene in stem-like cells from each diseased tissue sample relative to stem-like cells in normal samples in each tissue plotted against the malignancy continuum. Samples are colored based on if they are from different disease stage. |
Top |
Malignant transformation related pathway analysis |
| Find out the enriched GO biological processes and KEGG pathways involved in transition from healthy to precancer to cancer |
| Tissue | Disease Stage | Enriched GO biological Processes |
| Colorectum | AD |  |
| Colorectum | SER |  |
| Colorectum | MSS |  |
| Colorectum | MSI-H |  |
| Colorectum | FAP |  |
| ∗Top 15 enriched GO BP terms are showed in the bar plot of each disease state in each tissue. Each row represents a significant GO biological process which is colored according to the -log10(p.adjust). |
| Page: 1 2 3 4 5 6 7 8 9 |
| GO ID | Tissue | Disease Stage | Description | Gene Ratio | Bg Ratio | pvalue | p.adjust | Count |
| GO:00447724 | Breast | DCIS | mitotic cell cycle phase transition | 46/1390 | 424/18723 | 6.16e-03 | 4.39e-02 | 46 |
| GO:00447725 | Cervix | CC | mitotic cell cycle phase transition | 89/2311 | 424/18723 | 2.70e-07 | 1.12e-05 | 89 |
| GO:00719007 | Cervix | CC | regulation of protein serine/threonine kinase activity | 75/2311 | 359/18723 | 2.76e-06 | 8.02e-05 | 75 |
| GO:004477212 | Cervix | N_HPV | mitotic cell cycle phase transition | 22/534 | 424/18723 | 5.33e-03 | 3.84e-02 | 22 |
| GO:0071900 | Colorectum | AD | regulation of protein serine/threonine kinase activity | 98/3918 | 359/18723 | 2.18e-03 | 1.73e-02 | 98 |
| GO:00719001 | Colorectum | SER | regulation of protein serine/threonine kinase activity | 74/2897 | 359/18723 | 5.22e-03 | 3.96e-02 | 74 |
| GO:00719002 | Colorectum | MSS | regulation of protein serine/threonine kinase activity | 93/3467 | 359/18723 | 2.98e-04 | 3.91e-03 | 93 |
| GO:00719003 | Colorectum | FAP | regulation of protein serine/threonine kinase activity | 78/2622 | 359/18723 | 3.99e-05 | 8.48e-04 | 78 |
| GO:00719008 | Endometrium | AEH | regulation of protein serine/threonine kinase activity | 61/2100 | 359/18723 | 6.11e-04 | 5.98e-03 | 61 |
| GO:00447726 | Endometrium | AEH | mitotic cell cycle phase transition | 67/2100 | 424/18723 | 2.37e-03 | 1.78e-02 | 67 |
| GO:007190013 | Endometrium | EEC | regulation of protein serine/threonine kinase activity | 62/2168 | 359/18723 | 8.17e-04 | 7.61e-03 | 62 |
| GO:004477213 | Endometrium | EEC | mitotic cell cycle phase transition | 71/2168 | 424/18723 | 8.68e-04 | 7.97e-03 | 71 |
| GO:00447729 | Esophagus | HGIN | mitotic cell cycle phase transition | 89/2587 | 424/18723 | 2.80e-05 | 7.21e-04 | 89 |
| GO:004477216 | Esophagus | ESCC | mitotic cell cycle phase transition | 281/8552 | 424/18723 | 4.63e-18 | 4.45e-16 | 281 |
| GO:007190016 | Esophagus | ESCC | regulation of protein serine/threonine kinase activity | 227/8552 | 359/18723 | 1.12e-11 | 4.10e-10 | 227 |
| GO:19040294 | Esophagus | ESCC | regulation of cyclin-dependent protein kinase activity | 69/8552 | 98/18723 | 6.04e-07 | 7.91e-06 | 69 |
| GO:00000794 | Esophagus | ESCC | regulation of cyclin-dependent protein serine/threonine kinase activity | 66/8552 | 94/18723 | 1.24e-06 | 1.53e-05 | 66 |
| GO:00447721 | Liver | Cirrhotic | mitotic cell cycle phase transition | 139/4634 | 424/18723 | 1.02e-04 | 1.06e-03 | 139 |
| GO:007190011 | Liver | Cirrhotic | regulation of protein serine/threonine kinase activity | 110/4634 | 359/18723 | 6.19e-03 | 3.08e-02 | 110 |
| GO:00447722 | Liver | HCC | mitotic cell cycle phase transition | 240/7958 | 424/18723 | 2.47e-09 | 6.84e-08 | 240 |
| Page: 1 2 3 |
| Pathway ID | Tissue | Disease Stage | Description | Gene Ratio | Bg Ratio | pvalue | p.adjust | qvalue | Count |
| Page: 1 |
Top |
Cell-cell communication analysis |
| Identification of potential cell-cell interactions between two cell types and their ligand-receptor pairs for different disease states |
| Ligand | Receptor | LRpair | Pathway | Tissue | Disease Stage |
| Page: 1 |
Top |
Single-cell gene regulatory network inference analysis |
| Find out the significant the regulons (TFs) and the target genes of each regulon across cell types for different disease states |
| TF | Cell Type | Tissue | Disease Stage | Target Gene | RSS | Regulon Activity |
| ∗The dot plots of a searched regulon are shown for all cell subpopulations in each disease state of each tissue based on the regulon specific score inferred using pySCENIC and by calculating the average expression. |
| Page: 1 |
Top |
Somatic mutation of malignant transformation related genes |
| Annotation of somatic variants for genes involved in malignant transformation |
| Hugo Symbol | Variant Class | Variant Classification | dbSNP RS | HGVSc | HGVSp | HGVSp Short | SWISSPROT | BIOTYPE | SIFT | PolyPhen | Tumor Sample Barcode | Tissue | Histology | Sex | Age | Stage | Therapy Types | Drugs | Outcome |
| CCNI | SNV | Missense_Mutation | rs779499819 | c.95N>A | p.Arg32Gln | p.R32Q | Q14094 | protein_coding | tolerated(0.29) | benign(0) | TCGA-AZ-6601-01 | Colorectum | colon adenocarcinoma | Male | >=65 | I/II | Unknown | Unknown | PD |
| CCNI | SNV | Missense_Mutation | novel | c.568N>A | p.Ala190Thr | p.A190T | Q14094 | protein_coding | deleterious(0.02) | benign(0.047) | TCGA-AG-A002-01 | Colorectum | rectum adenocarcinoma | Male | <65 | I/II | Unknown | Unknown | SD |
| CCNI | SNV | Missense_Mutation | novel | c.245C>T | p.Ala82Val | p.A82V | Q14094 | protein_coding | tolerated(0.06) | benign(0.248) | TCGA-EI-6917-01 | Colorectum | rectum adenocarcinoma | Male | <65 | III/IV | Chemotherapy | 5fluorouracil+oxaciplatina+l-folinian | SD |
| CCNI | SNV | Missense_Mutation | novel | c.122C>A | p.Ser41Tyr | p.S41Y | Q14094 | protein_coding | deleterious(0) | probably_damaging(0.987) | TCGA-F5-6814-01 | Colorectum | rectum adenocarcinoma | Male | <65 | I/II | Unknown | Unknown | SD |
| CCNI | SNV | Missense_Mutation | novel | c.790C>T | p.Pro264Ser | p.P264S | Q14094 | protein_coding | tolerated(0.11) | benign(0.376) | TCGA-A5-A0G2-01 | Endometrium | uterine corpus endometrioid carcinoma | Female | <65 | III/IV | Unknown | Unknown | SD |
| CCNI | SNV | Missense_Mutation | novel | c.430A>G | p.Thr144Ala | p.T144A | Q14094 | protein_coding | tolerated(0.11) | benign(0.006) | TCGA-A5-A0G2-01 | Endometrium | uterine corpus endometrioid carcinoma | Female | <65 | III/IV | Unknown | Unknown | SD |
| CCNI | SNV | Missense_Mutation | novel | c.491A>G | p.Gln164Arg | p.Q164R | Q14094 | protein_coding | tolerated(0.42) | benign(0.001) | TCGA-A5-A0GG-01 | Endometrium | uterine corpus endometrioid carcinoma | Female | >=65 | I/II | Unknown | Unknown | SD |
| CCNI | SNV | Missense_Mutation | novel | c.967N>T | p.Arg323Cys | p.R323C | Q14094 | protein_coding | deleterious(0.01) | possibly_damaging(0.465) | TCGA-A5-A0GR-01 | Endometrium | uterine corpus endometrioid carcinoma | Female | >=65 | I/II | Unknown | Unknown | SD |
| CCNI | SNV | Missense_Mutation | novel | c.886N>A | p.Pro296Thr | p.P296T | Q14094 | protein_coding | tolerated(0.05) | benign(0.196) | TCGA-A5-A2K5-01 | Endometrium | uterine corpus endometrioid carcinoma | Female | >=65 | I/II | Unknown | Unknown | SD |
| CCNI | SNV | Missense_Mutation | rs772326265 | c.845N>T | p.Ser282Phe | p.S282F | Q14094 | protein_coding | deleterious(0.01) | benign(0.03) | TCGA-AP-A059-01 | Endometrium | uterine corpus endometrioid carcinoma | Female | >=65 | I/II | Unknown | Unknown | SD |
| Page: 1 2 3 |
Top |
Related drugs of malignant transformation related genes |
| Identification of chemicals and drugs interact with genes involved in malignant transfromation |
| (DGIdb 4.0) |
| Entrez ID | Symbol | Category | Interaction Types | Drug Claim Name | Drug Name | PMIDs |
| Page: 1 |

Copyright 2023-Present -The University of Texas Health Science Center at Houston |