
|
|||||
|
 | |
| |
| |
| |
| |
| |
|
Gene: CCNH |
Gene summary for CCNH |
| Gene information | Species | Human | Gene symbol | CCNH | Gene ID | 902 |
| Gene name | cyclin H | |
| Gene Alias | CAK | |
| Cytomap | 5q14.3 | |
| Gene Type | protein-coding | GO ID | GO:0000079 | UniProtAcc | P51946 |
Top |
Malignant transformation analysis |
| Identification of the aberrant gene expression in precancerous and cancerous lesions by comparing the gene expression of stem-like cells in diseased tissues with normal stem cells |
| Entrez ID | Symbol | Replicates | Species | Organ | Tissue | Adj P-value | Log2FC | Malignancy |
| 902 | CCNH | HTA11_3410_2000001011 | Human | Colorectum | AD | 5.00e-26 | -7.30e-01 | 0.0155 |
| 902 | CCNH | HTA11_2487_2000001011 | Human | Colorectum | SER | 9.87e-15 | -7.23e-01 | -0.1808 |
| 902 | CCNH | HTA11_1938_2000001011 | Human | Colorectum | AD | 2.11e-09 | -6.75e-01 | -0.0811 |
| 902 | CCNH | HTA11_78_2000001011 | Human | Colorectum | AD | 1.93e-07 | -5.77e-01 | -0.1088 |
| 902 | CCNH | HTA11_347_2000001011 | Human | Colorectum | AD | 1.45e-14 | -5.97e-01 | -0.1954 |
| 902 | CCNH | HTA11_2112_2000001011 | Human | Colorectum | SER | 9.44e-04 | -7.52e-01 | -0.2196 |
| 902 | CCNH | HTA11_3361_2000001011 | Human | Colorectum | AD | 6.12e-08 | -6.42e-01 | -0.1207 |
| 902 | CCNH | HTA11_83_2000001011 | Human | Colorectum | SER | 5.09e-09 | -7.21e-01 | -0.1526 |
| 902 | CCNH | HTA11_696_2000001011 | Human | Colorectum | AD | 1.84e-29 | -6.96e-01 | -0.1464 |
| 902 | CCNH | HTA11_866_2000001011 | Human | Colorectum | AD | 3.71e-25 | -6.64e-01 | -0.1001 |
| 902 | CCNH | HTA11_1391_2000001011 | Human | Colorectum | AD | 1.66e-16 | -6.82e-01 | -0.059 |
| 902 | CCNH | HTA11_2992_2000001011 | Human | Colorectum | SER | 8.05e-06 | -7.52e-01 | -0.1706 |
| 902 | CCNH | HTA11_5212_2000001011 | Human | Colorectum | AD | 3.37e-03 | -6.77e-01 | -0.2061 |
| 902 | CCNH | HTA11_546_2000001011 | Human | Colorectum | AD | 7.71e-07 | -7.00e-01 | -0.0842 |
| 902 | CCNH | HTA11_7862_2000001011 | Human | Colorectum | AD | 1.70e-06 | -7.31e-01 | -0.0179 |
| 902 | CCNH | HTA11_866_3004761011 | Human | Colorectum | AD | 8.73e-22 | -7.20e-01 | 0.096 |
| 902 | CCNH | HTA11_9408_2000001011 | Human | Colorectum | AD | 4.87e-03 | -7.52e-01 | 0.0451 |
| 902 | CCNH | HTA11_8622_2000001021 | Human | Colorectum | SER | 2.88e-04 | -7.04e-01 | 0.0528 |
| 902 | CCNH | HTA11_10623_2000001011 | Human | Colorectum | AD | 6.10e-04 | -6.66e-01 | -0.0177 |
| 902 | CCNH | HTA11_10711_2000001011 | Human | Colorectum | AD | 4.23e-12 | -6.99e-01 | 0.0338 |
| Page: 1 2 3 4 5 6 7 8 9 10 |
| Tissue | Expression Dynamics | Abbreviation |
| Colorectum (GSE201348) |  | FAP: Familial adenomatous polyposis |
| CRC: Colorectal cancer | ||
| Colorectum (HTA11) |  | AD: Adenomas |
| SER: Sessile serrated lesions | ||
| MSI-H: Microsatellite-high colorectal cancer | ||
| MSS: Microsatellite stable colorectal cancer | ||
| Esophagus | 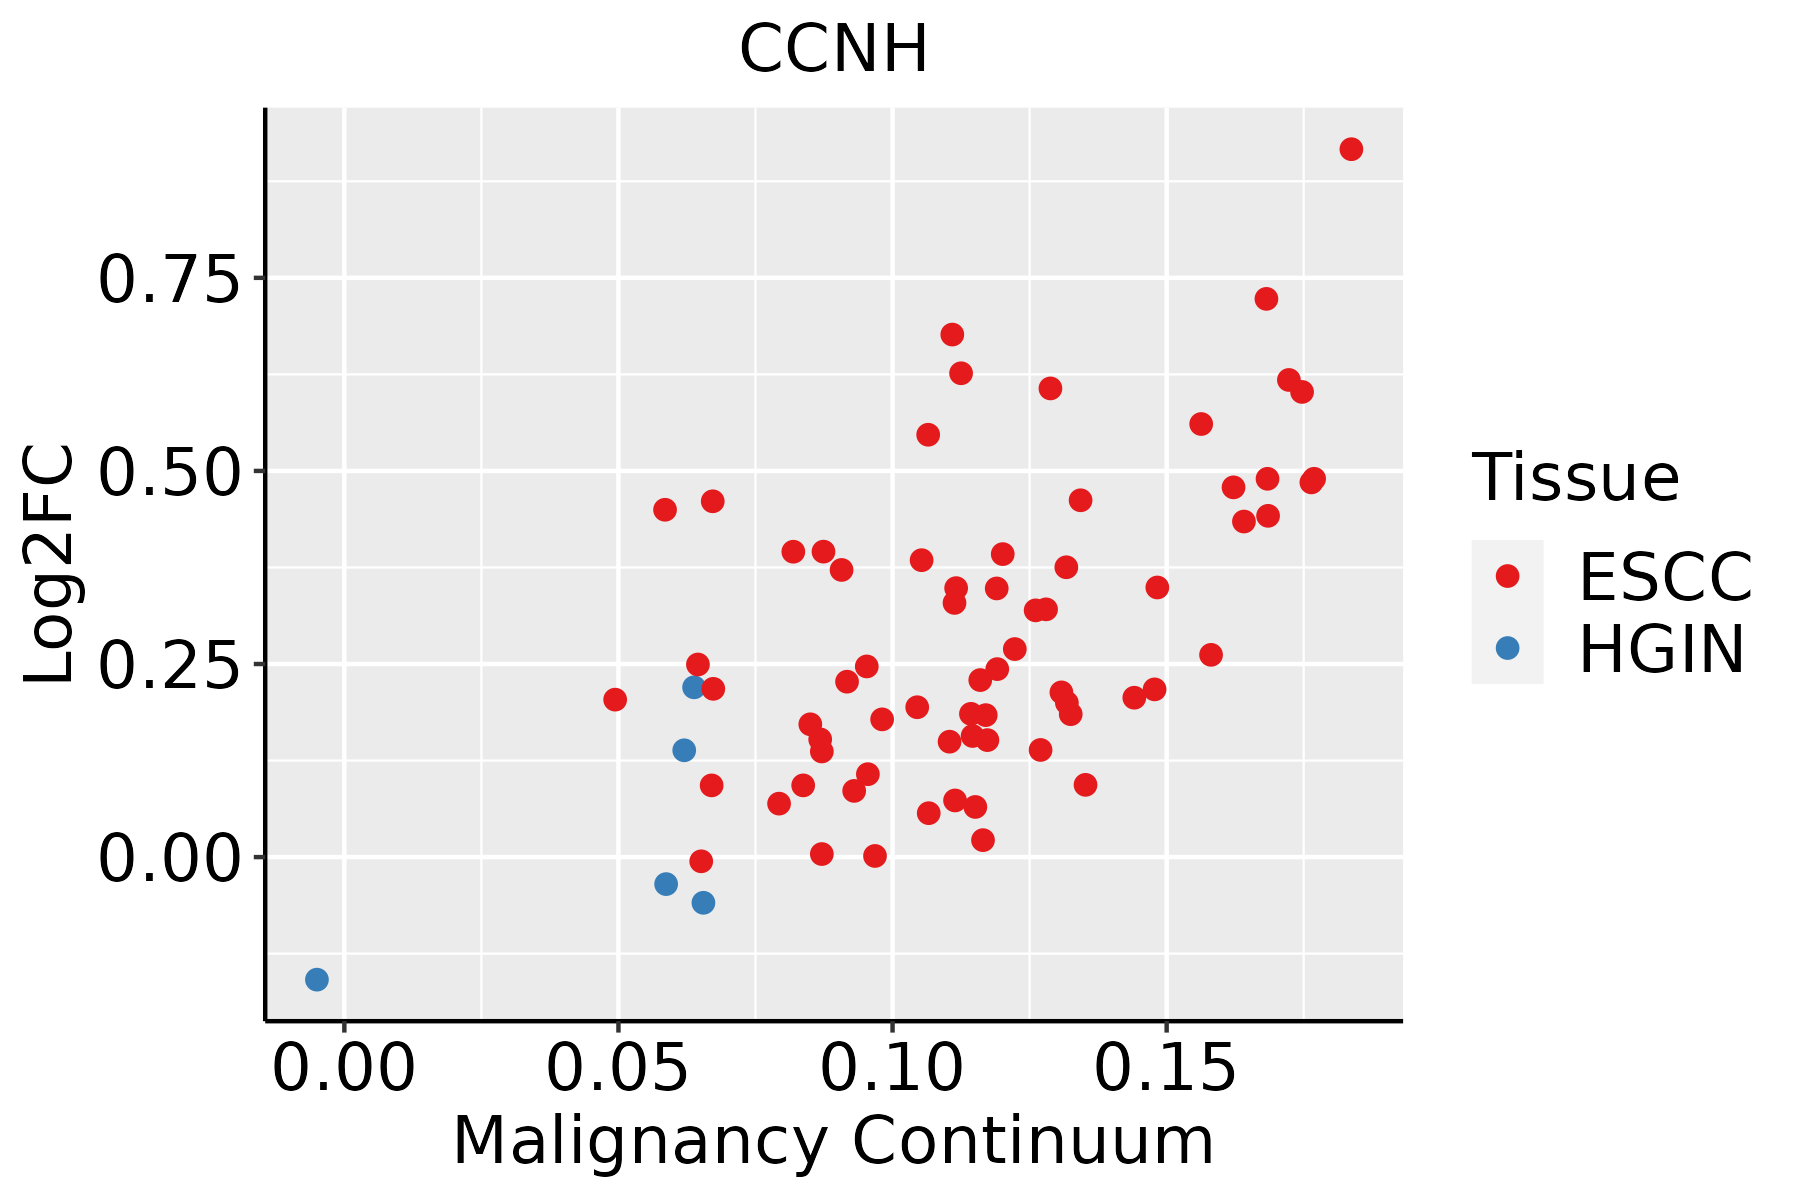 | ESCC: Esophageal squamous cell carcinoma |
| HGIN: High-grade intraepithelial neoplasias | ||
| LGIN: Low-grade intraepithelial neoplasias | ||
| Lung |  | AAH: Atypical adenomatous hyperplasia |
| AIS: Adenocarcinoma in situ | ||
| IAC: Invasive lung adenocarcinoma | ||
| MIA: Minimally invasive adenocarcinoma | ||
| Oral Cavity |  | EOLP: Erosive Oral lichen planus |
| LP: leukoplakia | ||
| NEOLP: Non-erosive oral lichen planus | ||
| OSCC: Oral squamous cell carcinoma | ||
| Prostate |  | BPH: Benign Prostatic Hyperplasia |
| Skin | 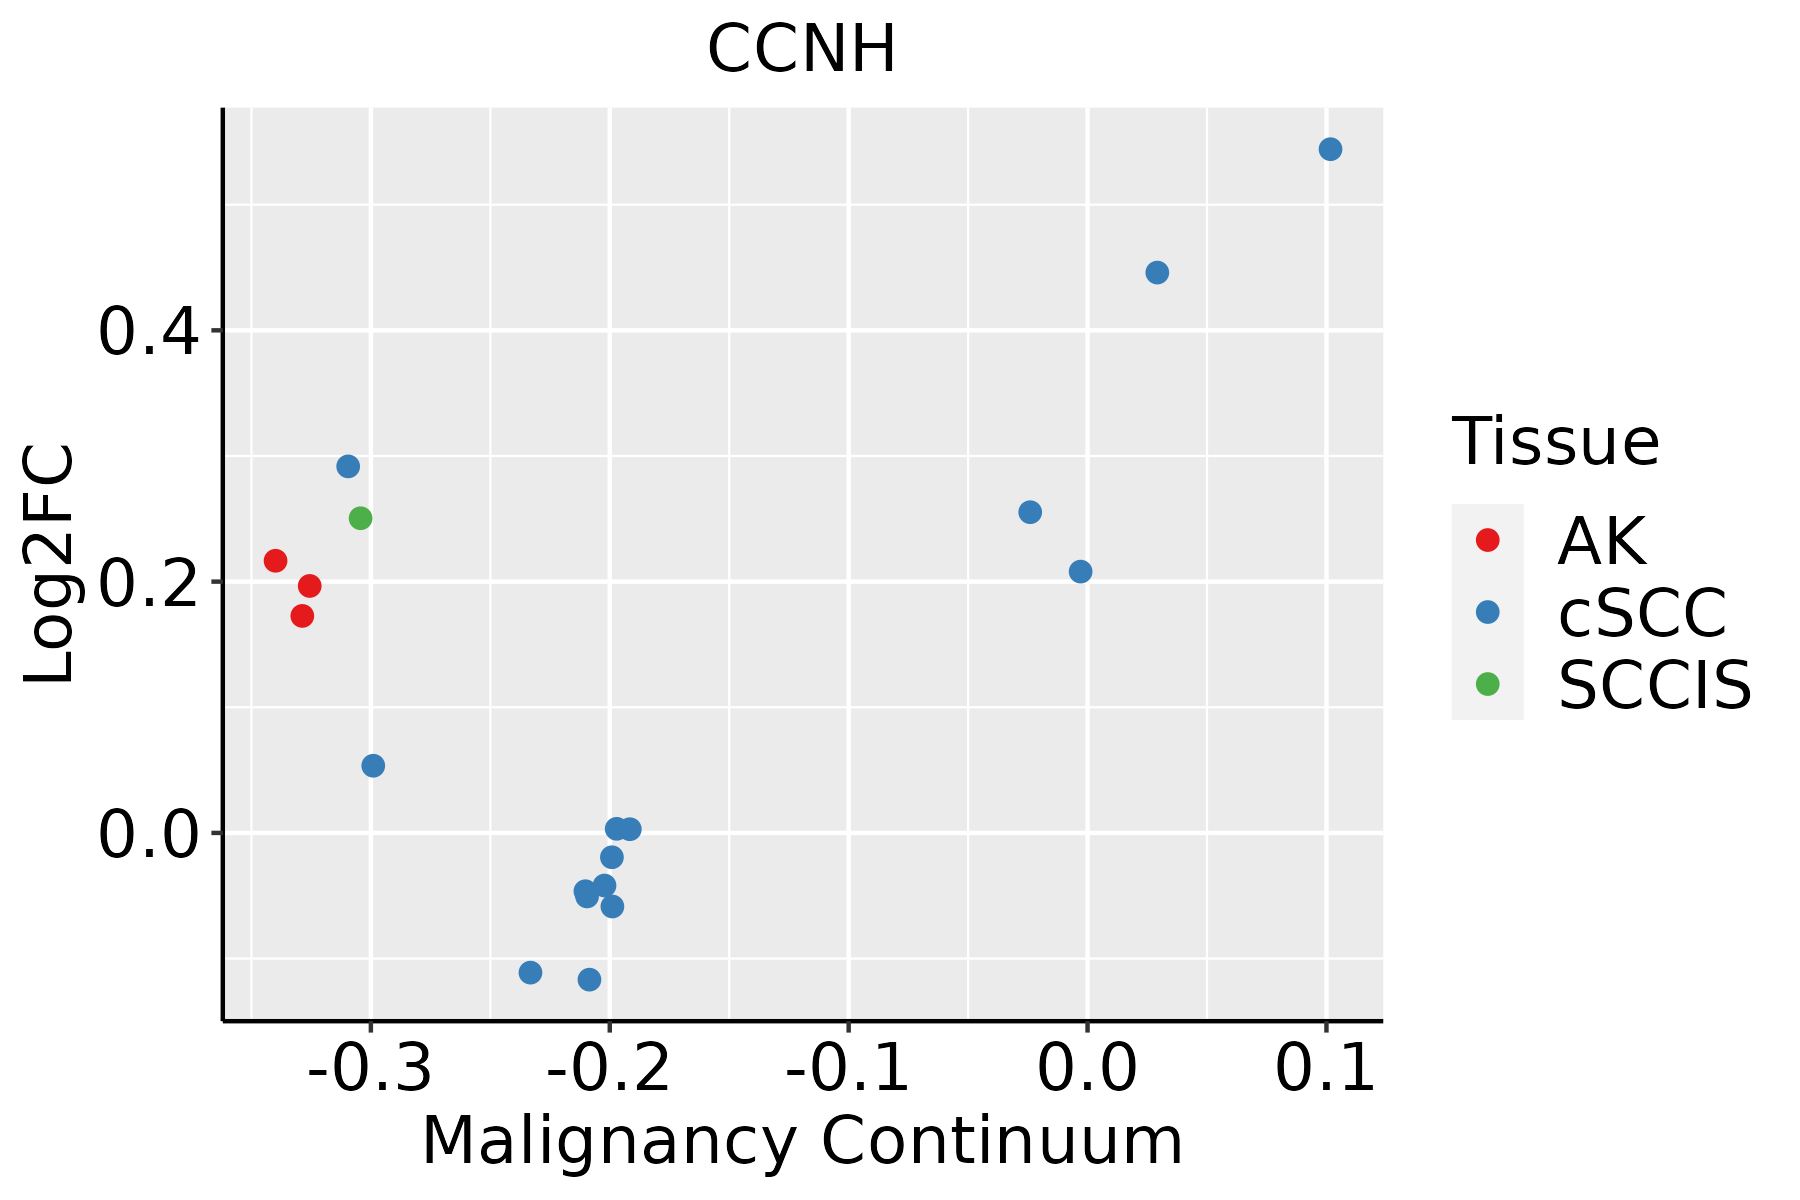 | AK: Actinic keratosis |
| cSCC: Cutaneous squamous cell carcinoma | ||
| SCCIS:squamous cell carcinoma in situ | ||
| Thyroid | 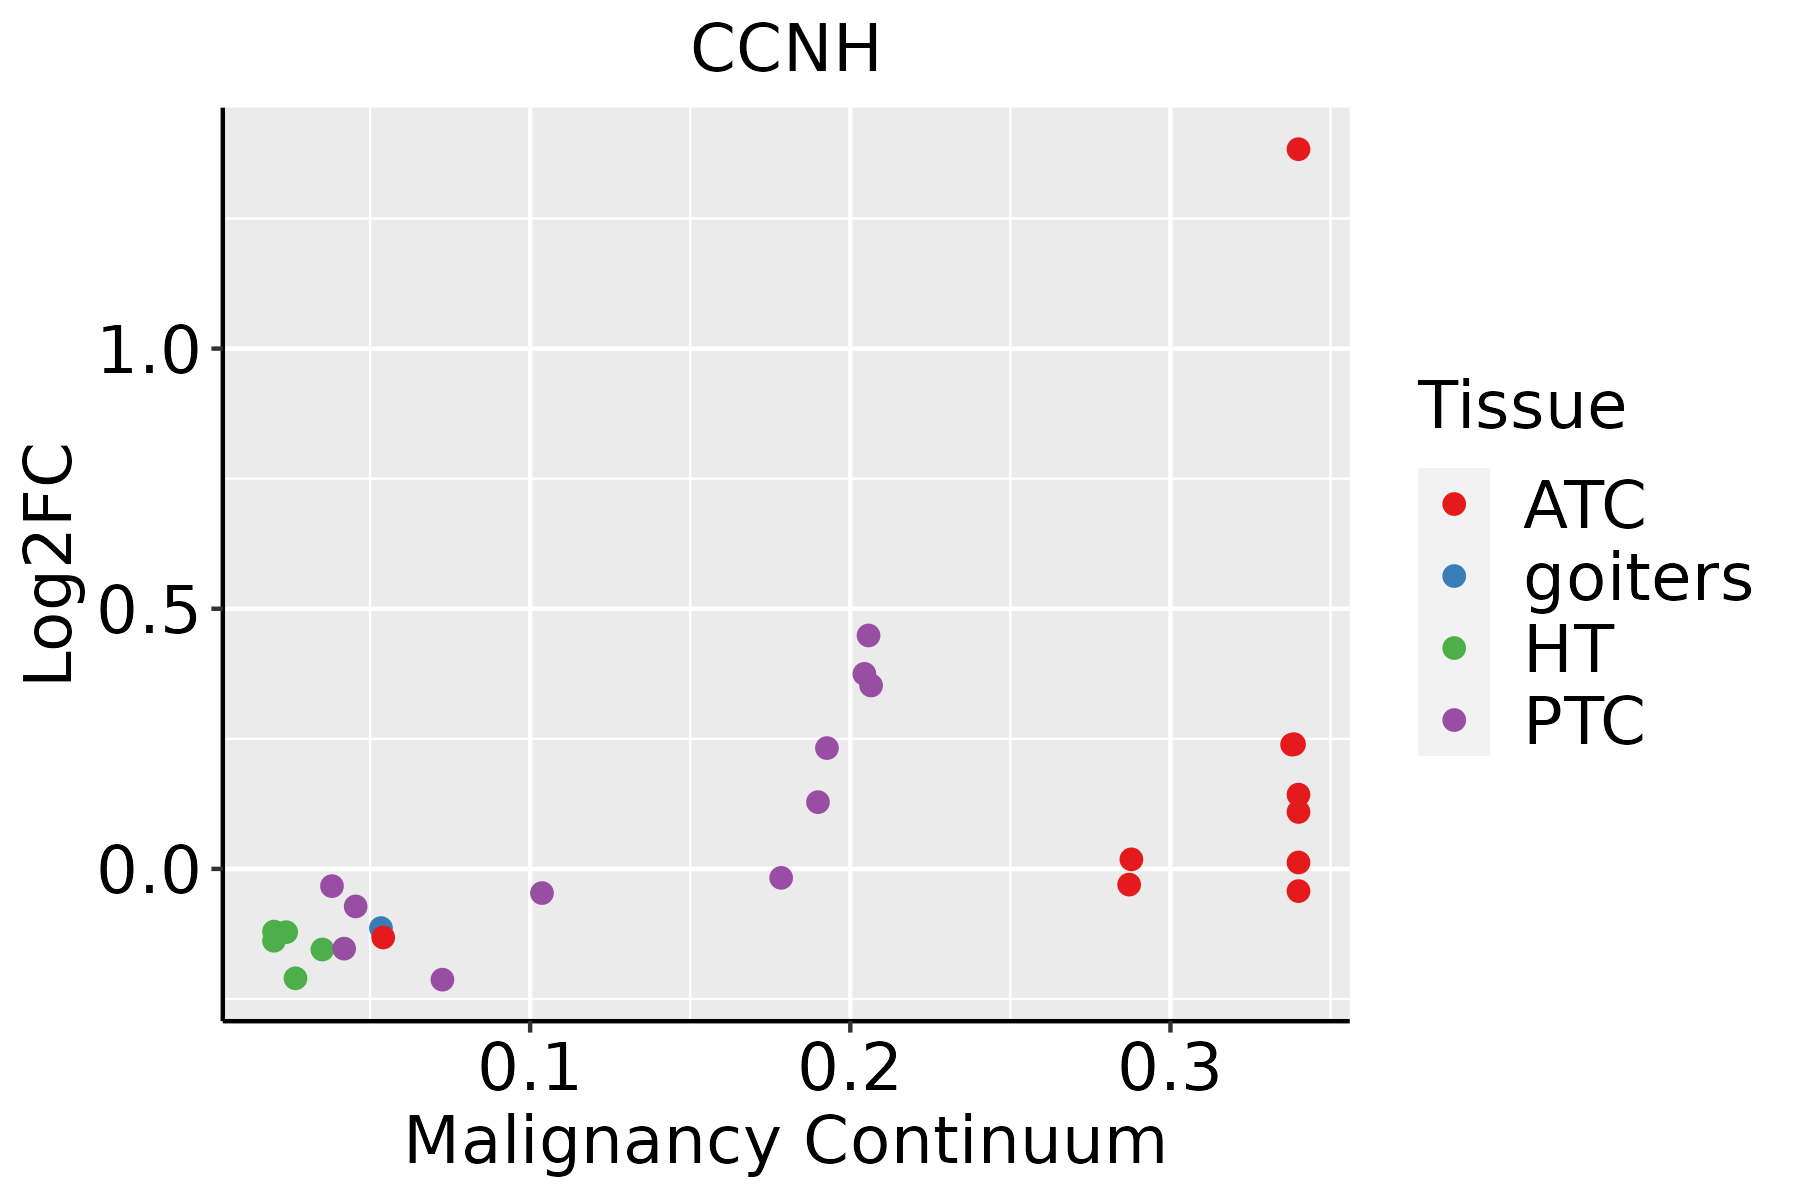 | ATC: Anaplastic thyroid cancer |
| HT: Hashimoto's thyroiditis | ||
| PTC: Papillary thyroid cancer |
| ∗log2FC in expression of this searched gene in stem-like cells from each diseased tissue sample relative to stem-like cells in normal samples in each tissue plotted against the malignancy continuum. Samples are colored based on if they are from different disease stage. |
Top |
Malignant transformation related pathway analysis |
| Find out the enriched GO biological processes and KEGG pathways involved in transition from healthy to precancer to cancer |
| Tissue | Disease Stage | Enriched GO biological Processes |
| Colorectum | AD |  |
| Colorectum | SER |  |
| Colorectum | MSS |  |
| Colorectum | MSI-H |  |
| Colorectum | FAP |  |
| ∗Top 15 enriched GO BP terms are showed in the bar plot of each disease state in each tissue. Each row represents a significant GO biological process which is colored according to the -log10(p.adjust). |
| Page: 1 2 3 4 5 6 7 8 9 |
| GO ID | Tissue | Disease Stage | Description | Gene Ratio | Bg Ratio | pvalue | p.adjust | Count |
| GO:0031647 | Colorectum | AD | regulation of protein stability | 108/3918 | 298/18723 | 6.33e-10 | 5.08e-08 | 108 |
| GO:0050821 | Colorectum | AD | protein stabilization | 73/3918 | 191/18723 | 3.02e-08 | 1.64e-06 | 73 |
| GO:0071900 | Colorectum | AD | regulation of protein serine/threonine kinase activity | 98/3918 | 359/18723 | 2.18e-03 | 1.73e-02 | 98 |
| GO:00316471 | Colorectum | SER | regulation of protein stability | 86/2897 | 298/18723 | 2.56e-09 | 2.42e-07 | 86 |
| GO:00508211 | Colorectum | SER | protein stabilization | 58/2897 | 191/18723 | 1.46e-07 | 8.59e-06 | 58 |
| GO:00719001 | Colorectum | SER | regulation of protein serine/threonine kinase activity | 74/2897 | 359/18723 | 5.22e-03 | 3.96e-02 | 74 |
| GO:00316472 | Colorectum | MSS | regulation of protein stability | 103/3467 | 298/18723 | 2.52e-11 | 3.49e-09 | 103 |
| GO:00508212 | Colorectum | MSS | protein stabilization | 68/3467 | 191/18723 | 1.53e-08 | 8.81e-07 | 68 |
| GO:00719002 | Colorectum | MSS | regulation of protein serine/threonine kinase activity | 93/3467 | 359/18723 | 2.98e-04 | 3.91e-03 | 93 |
| GO:00508214 | Colorectum | FAP | protein stabilization | 51/2622 | 191/18723 | 2.63e-06 | 9.96e-05 | 51 |
| GO:00316474 | Colorectum | FAP | regulation of protein stability | 70/2622 | 298/18723 | 6.60e-06 | 2.04e-04 | 70 |
| GO:00719003 | Colorectum | FAP | regulation of protein serine/threonine kinase activity | 78/2622 | 359/18723 | 3.99e-05 | 8.48e-04 | 78 |
| GO:00508215 | Colorectum | CRC | protein stabilization | 44/2078 | 191/18723 | 1.77e-06 | 8.92e-05 | 44 |
| GO:00316475 | Colorectum | CRC | regulation of protein stability | 58/2078 | 298/18723 | 1.38e-05 | 4.37e-04 | 58 |
| GO:00719004 | Colorectum | CRC | regulation of protein serine/threonine kinase activity | 65/2078 | 359/18723 | 4.67e-05 | 1.10e-03 | 65 |
| GO:0031647111 | Esophagus | ESCC | regulation of protein stability | 223/8552 | 298/18723 | 5.76e-25 | 1.52e-22 | 223 |
| GO:0050821111 | Esophagus | ESCC | protein stabilization | 140/8552 | 191/18723 | 6.50e-15 | 3.61e-13 | 140 |
| GO:007190016 | Esophagus | ESCC | regulation of protein serine/threonine kinase activity | 227/8552 | 359/18723 | 1.12e-11 | 4.10e-10 | 227 |
| GO:19040294 | Esophagus | ESCC | regulation of cyclin-dependent protein kinase activity | 69/8552 | 98/18723 | 6.04e-07 | 7.91e-06 | 69 |
| GO:00000794 | Esophagus | ESCC | regulation of cyclin-dependent protein serine/threonine kinase activity | 66/8552 | 94/18723 | 1.24e-06 | 1.53e-05 | 66 |
| Page: 1 2 3 4 5 |
| Pathway ID | Tissue | Disease Stage | Description | Gene Ratio | Bg Ratio | pvalue | p.adjust | qvalue | Count |
| hsa04110 | Colorectum | FAP | Cell cycle | 37/1404 | 157/8465 | 1.44e-02 | 4.77e-02 | 2.90e-02 | 37 |
| hsa041101 | Colorectum | FAP | Cell cycle | 37/1404 | 157/8465 | 1.44e-02 | 4.77e-02 | 2.90e-02 | 37 |
| hsa0411023 | Esophagus | ESCC | Cell cycle | 126/4205 | 157/8465 | 1.34e-15 | 5.60e-14 | 2.87e-14 | 126 |
| hsa0342022 | Esophagus | ESCC | Nucleotide excision repair | 54/4205 | 63/8465 | 2.01e-09 | 2.17e-08 | 1.11e-08 | 54 |
| hsa030222 | Esophagus | ESCC | Basal transcription factors | 35/4205 | 45/8465 | 1.01e-04 | 4.06e-04 | 2.08e-04 | 35 |
| hsa0411033 | Esophagus | ESCC | Cell cycle | 126/4205 | 157/8465 | 1.34e-15 | 5.60e-14 | 2.87e-14 | 126 |
| hsa0342032 | Esophagus | ESCC | Nucleotide excision repair | 54/4205 | 63/8465 | 2.01e-09 | 2.17e-08 | 1.11e-08 | 54 |
| hsa0302211 | Esophagus | ESCC | Basal transcription factors | 35/4205 | 45/8465 | 1.01e-04 | 4.06e-04 | 2.08e-04 | 35 |
| hsa041105 | Lung | IAC | Cell cycle | 30/1053 | 157/8465 | 1.03e-02 | 3.83e-02 | 2.54e-02 | 30 |
| hsa0411012 | Lung | IAC | Cell cycle | 30/1053 | 157/8465 | 1.03e-02 | 3.83e-02 | 2.54e-02 | 30 |
| hsa041108 | Oral cavity | OSCC | Cell cycle | 118/3704 | 157/8465 | 7.15e-16 | 2.66e-14 | 1.35e-14 | 118 |
| hsa0411015 | Oral cavity | OSCC | Cell cycle | 118/3704 | 157/8465 | 7.15e-16 | 2.66e-14 | 1.35e-14 | 118 |
| hsa0342021 | Oral cavity | LP | Nucleotide excision repair | 37/2418 | 63/8465 | 5.14e-07 | 6.33e-06 | 4.08e-06 | 37 |
| hsa0411022 | Oral cavity | LP | Cell cycle | 70/2418 | 157/8465 | 1.17e-05 | 8.27e-05 | 5.33e-05 | 70 |
| hsa0342031 | Oral cavity | LP | Nucleotide excision repair | 37/2418 | 63/8465 | 5.14e-07 | 6.33e-06 | 4.08e-06 | 37 |
| hsa0411032 | Oral cavity | LP | Cell cycle | 70/2418 | 157/8465 | 1.17e-05 | 8.27e-05 | 5.33e-05 | 70 |
| hsa0411041 | Oral cavity | EOLP | Cell cycle | 42/1218 | 157/8465 | 3.20e-05 | 1.61e-04 | 9.52e-05 | 42 |
| hsa0411051 | Oral cavity | EOLP | Cell cycle | 42/1218 | 157/8465 | 3.20e-05 | 1.61e-04 | 9.52e-05 | 42 |
| hsa0411061 | Oral cavity | NEOLP | Cell cycle | 37/1112 | 157/8465 | 2.29e-04 | 1.58e-03 | 9.95e-04 | 37 |
| hsa0411071 | Oral cavity | NEOLP | Cell cycle | 37/1112 | 157/8465 | 2.29e-04 | 1.58e-03 | 9.95e-04 | 37 |
| Page: 1 2 |
Top |
Cell-cell communication analysis |
| Identification of potential cell-cell interactions between two cell types and their ligand-receptor pairs for different disease states |
| Ligand | Receptor | LRpair | Pathway | Tissue | Disease Stage |
| Page: 1 |
Top |
Single-cell gene regulatory network inference analysis |
| Find out the significant the regulons (TFs) and the target genes of each regulon across cell types for different disease states |
| TF | Cell Type | Tissue | Disease Stage | Target Gene | RSS | Regulon Activity |
| ∗The dot plots of a searched regulon are shown for all cell subpopulations in each disease state of each tissue based on the regulon specific score inferred using pySCENIC and by calculating the average expression. |
| Page: 1 |
Top |
Somatic mutation of malignant transformation related genes |
| Annotation of somatic variants for genes involved in malignant transformation |
| Hugo Symbol | Variant Class | Variant Classification | dbSNP RS | HGVSc | HGVSp | HGVSp Short | SWISSPROT | BIOTYPE | SIFT | PolyPhen | Tumor Sample Barcode | Tissue | Histology | Sex | Age | Stage | Therapy Types | Drugs | Outcome |
| CCNH | SNV | Missense_Mutation | c.421N>C | p.Glu141Gln | p.E141Q | P51946 | protein_coding | deleterious(0.03) | probably_damaging(0.932) | TCGA-EW-A1PB-01 | Breast | breast invasive carcinoma | Female | >=65 | III/IV | Unknown | Unknown | SD | |
| CCNH | SNV | Missense_Mutation | c.206C>T | p.Ser69Leu | p.S69L | P51946 | protein_coding | tolerated(0.12) | benign(0.209) | TCGA-AA-3977-01 | Colorectum | colon adenocarcinoma | Male | >=65 | I/II | Unknown | Unknown | SD | |
| CCNH | SNV | Missense_Mutation | rs568535217 | c.379G>A | p.Gly127Arg | p.G127R | P51946 | protein_coding | deleterious(0.01) | probably_damaging(0.914) | TCGA-G4-6628-01 | Colorectum | colon adenocarcinoma | Male | >=65 | I/II | Unknown | Unknown | SD |
| CCNH | SNV | Missense_Mutation | novel | c.248N>T | p.Ala83Val | p.A83V | P51946 | protein_coding | deleterious(0) | probably_damaging(0.961) | TCGA-AG-3892-01 | Colorectum | rectum adenocarcinoma | Female | <65 | I/II | Unknown | Unknown | SD |
| CCNH | deletion | Frame_Shift_Del | c.643_646delNNNN | p.Thr215ProfsTer21 | p.T215Pfs*21 | P51946 | protein_coding | TCGA-AG-3878-01 | Colorectum | rectum adenocarcinoma | Male | <65 | I/II | Unknown | Unknown | SD | |||
| CCNH | SNV | Missense_Mutation | rs763000210 | c.196G>A | p.Glu66Lys | p.E66K | P51946 | protein_coding | tolerated(0.08) | benign(0.052) | TCGA-A5-A1OF-01 | Endometrium | uterine corpus endometrioid carcinoma | Female | <65 | I/II | Unknown | Unknown | SD |
| CCNH | SNV | Missense_Mutation | rs145378845 | c.602C>T | p.Thr201Met | p.T201M | P51946 | protein_coding | deleterious(0) | possibly_damaging(0.752) | TCGA-AJ-A3EK-01 | Endometrium | uterine corpus endometrioid carcinoma | Female | <65 | I/II | Chemotherapy | carboplatin | CR |
| CCNH | SNV | Missense_Mutation | novel | c.711N>A | p.Met237Ile | p.M237I | P51946 | protein_coding | tolerated(0.21) | benign(0.018) | TCGA-AP-A1DK-01 | Endometrium | uterine corpus endometrioid carcinoma | Female | <65 | I/II | Unknown | Unknown | SD |
| CCNH | SNV | Missense_Mutation | novel | c.478N>A | p.Val160Ile | p.V160I | P51946 | protein_coding | tolerated(0.49) | benign(0.003) | TCGA-AX-A06F-01 | Endometrium | uterine corpus endometrioid carcinoma | Female | <65 | III/IV | Chemotherapy | carboplatin | SD |
| CCNH | SNV | Missense_Mutation | rs201354427 | c.865G>A | p.Val289Ile | p.V289I | P51946 | protein_coding | tolerated(0.36) | benign(0) | TCGA-B5-A0JR-01 | Endometrium | uterine corpus endometrioid carcinoma | Female | >=65 | I/II | Unknown | Unknown | SD |
| Page: 1 2 3 |
Top |
Related drugs of malignant transformation related genes |
| Identification of chemicals and drugs interact with genes involved in malignant transfromation |
| (DGIdb 4.0) |
| Entrez ID | Symbol | Category | Interaction Types | Drug Claim Name | Drug Name | PMIDs |
| Page: 1 |

Copyright 2023-Present -The University of Texas Health Science Center at Houston |