
|
|||||
|
 | |
| |
| |
| |
| |
| |
|
Gene: CCNG2 |
Gene summary for CCNG2 |
| Gene information | Species | Human | Gene symbol | CCNG2 | Gene ID | 901 |
| Gene name | cyclin G2 | |
| Gene Alias | CCNG2 | |
| Cytomap | 4q21.1 | |
| Gene Type | protein-coding | GO ID | GO:0000079 | UniProtAcc | A0A024RDC7 |
Top |
Malignant transformation analysis |
| Identification of the aberrant gene expression in precancerous and cancerous lesions by comparing the gene expression of stem-like cells in diseased tissues with normal stem cells |
| Entrez ID | Symbol | Replicates | Species | Organ | Tissue | Adj P-value | Log2FC | Malignancy |
| 901 | CCNG2 | GSM4909282 | Human | Breast | IDC | 3.76e-05 | -2.46e-01 | -0.0288 |
| 901 | CCNG2 | GSM4909286 | Human | Breast | IDC | 6.18e-03 | 3.40e-02 | 0.1081 |
| 901 | CCNG2 | GSM4909287 | Human | Breast | IDC | 1.26e-04 | -2.34e-01 | 0.2057 |
| 901 | CCNG2 | GSM4909290 | Human | Breast | IDC | 3.73e-02 | -2.33e-01 | 0.2096 |
| 901 | CCNG2 | GSM4909293 | Human | Breast | IDC | 9.86e-24 | 6.77e-01 | 0.1581 |
| 901 | CCNG2 | GSM4909296 | Human | Breast | IDC | 5.56e-03 | -1.23e-01 | 0.1524 |
| 901 | CCNG2 | GSM4909297 | Human | Breast | IDC | 1.13e-02 | 6.36e-02 | 0.1517 |
| 901 | CCNG2 | GSM4909298 | Human | Breast | IDC | 6.79e-05 | 2.91e-01 | 0.1551 |
| 901 | CCNG2 | GSM4909311 | Human | Breast | IDC | 2.38e-13 | -1.49e-01 | 0.1534 |
| 901 | CCNG2 | GSM4909312 | Human | Breast | IDC | 3.84e-04 | 3.23e-01 | 0.1552 |
| 901 | CCNG2 | GSM4909315 | Human | Breast | IDC | 1.39e-02 | -2.45e-01 | 0.21 |
| 901 | CCNG2 | GSM4909319 | Human | Breast | IDC | 5.06e-13 | -2.86e-01 | 0.1563 |
| 901 | CCNG2 | GSM4909321 | Human | Breast | IDC | 2.41e-04 | -1.54e-01 | 0.1559 |
| 901 | CCNG2 | ctrl6 | Human | Breast | Precancer | 5.77e-03 | 4.19e-01 | -0.0061 |
| 901 | CCNG2 | brca3 | Human | Breast | Precancer | 3.75e-04 | 2.18e-01 | -0.0263 |
| 901 | CCNG2 | M5 | Human | Breast | IDC | 4.10e-03 | 6.42e-01 | 0.1598 |
| 901 | CCNG2 | NCCBC14 | Human | Breast | DCIS | 2.52e-05 | 2.50e-01 | 0.2021 |
| 901 | CCNG2 | NCCBC5 | Human | Breast | DCIS | 1.46e-06 | -2.00e-01 | 0.2046 |
| 901 | CCNG2 | P1 | Human | Breast | IDC | 3.37e-07 | -1.41e-01 | 0.1527 |
| 901 | CCNG2 | DCIS2 | Human | Breast | DCIS | 6.70e-32 | 1.16e-02 | 0.0085 |
| Page: 1 2 3 |
| Tissue | Expression Dynamics | Abbreviation |
| Breast |  | IDC: Invasive ductal carcinoma |
| DCIS: Ductal carcinoma in situ | ||
| Precancer(BRCA1-mut): Precancerous lesion from BRCA1 mutation carriers | ||
| Liver |  | HCC: Hepatocellular carcinoma |
| NAFLD: Non-alcoholic fatty liver disease | ||
| Prostate | 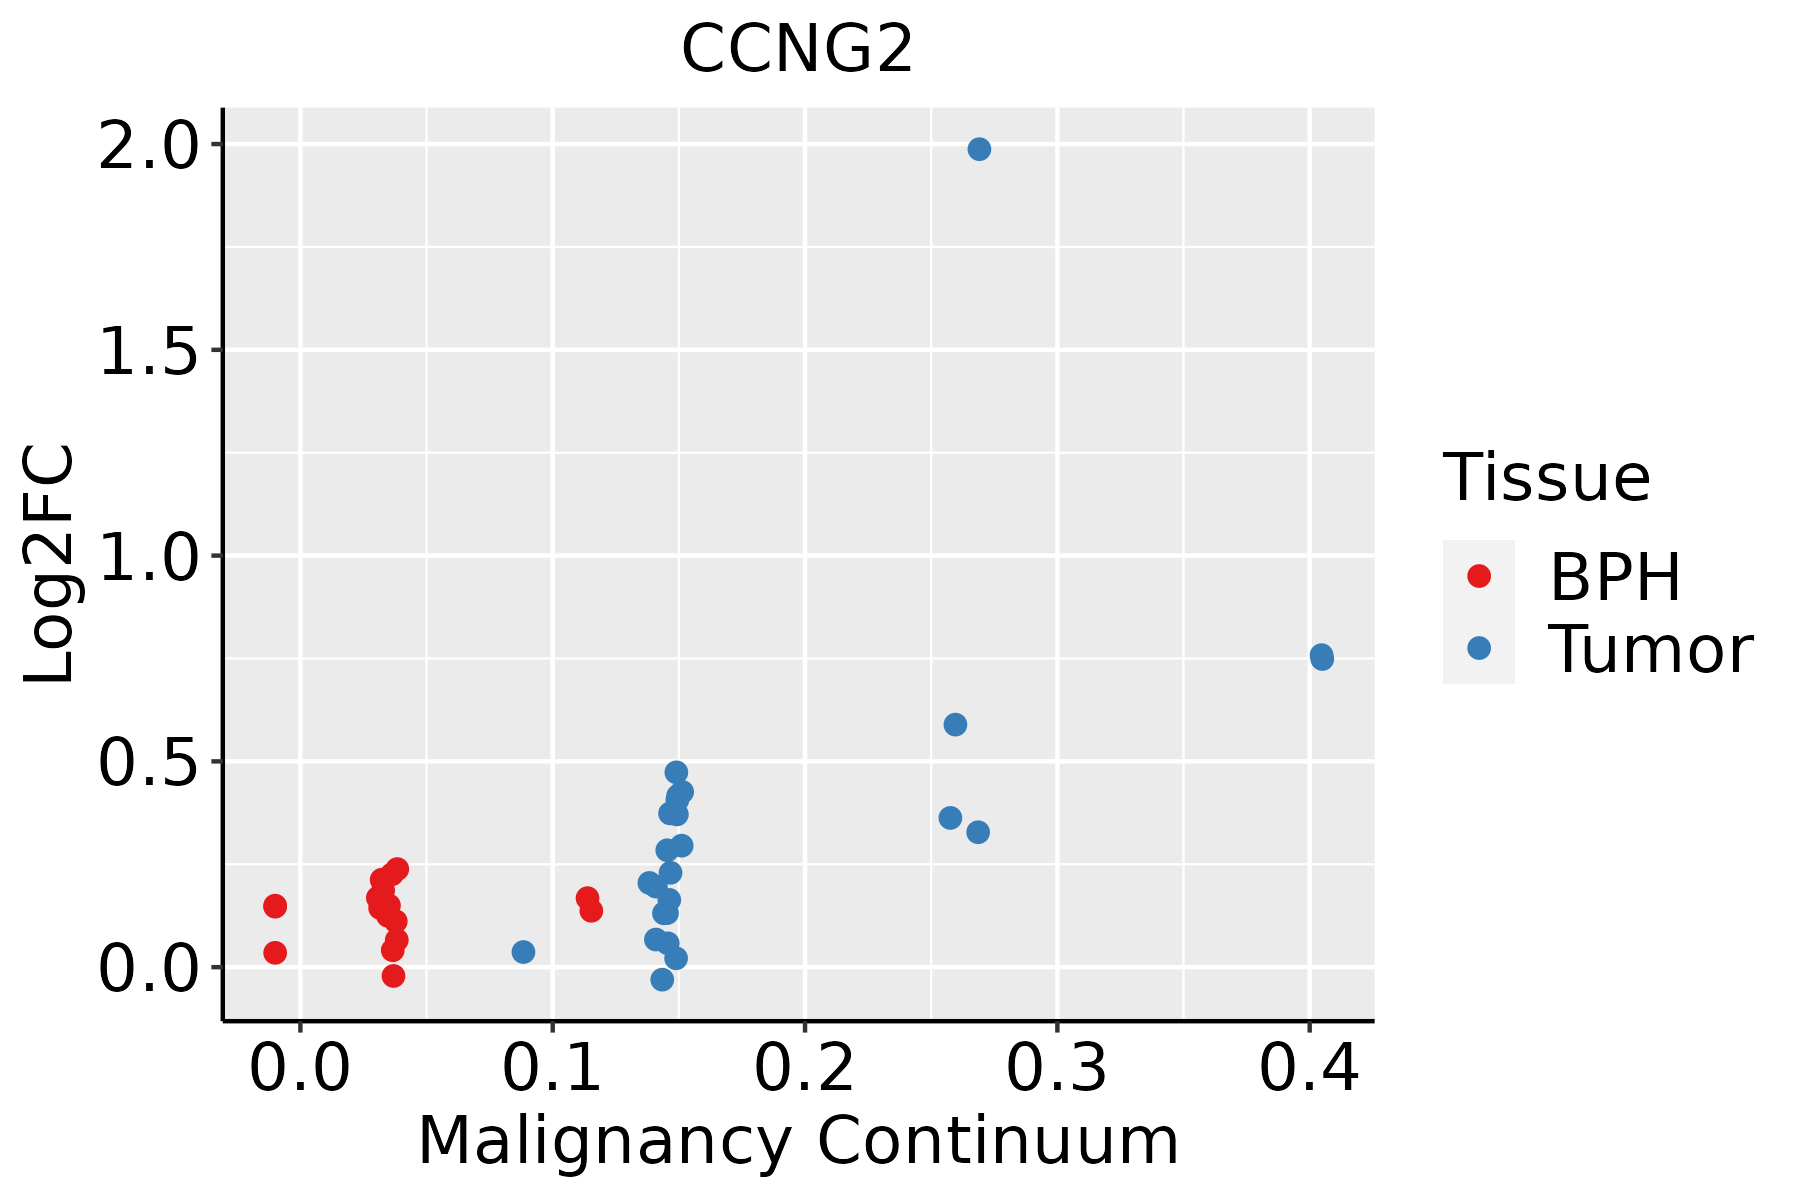 | BPH: Benign Prostatic Hyperplasia |
| Thyroid | 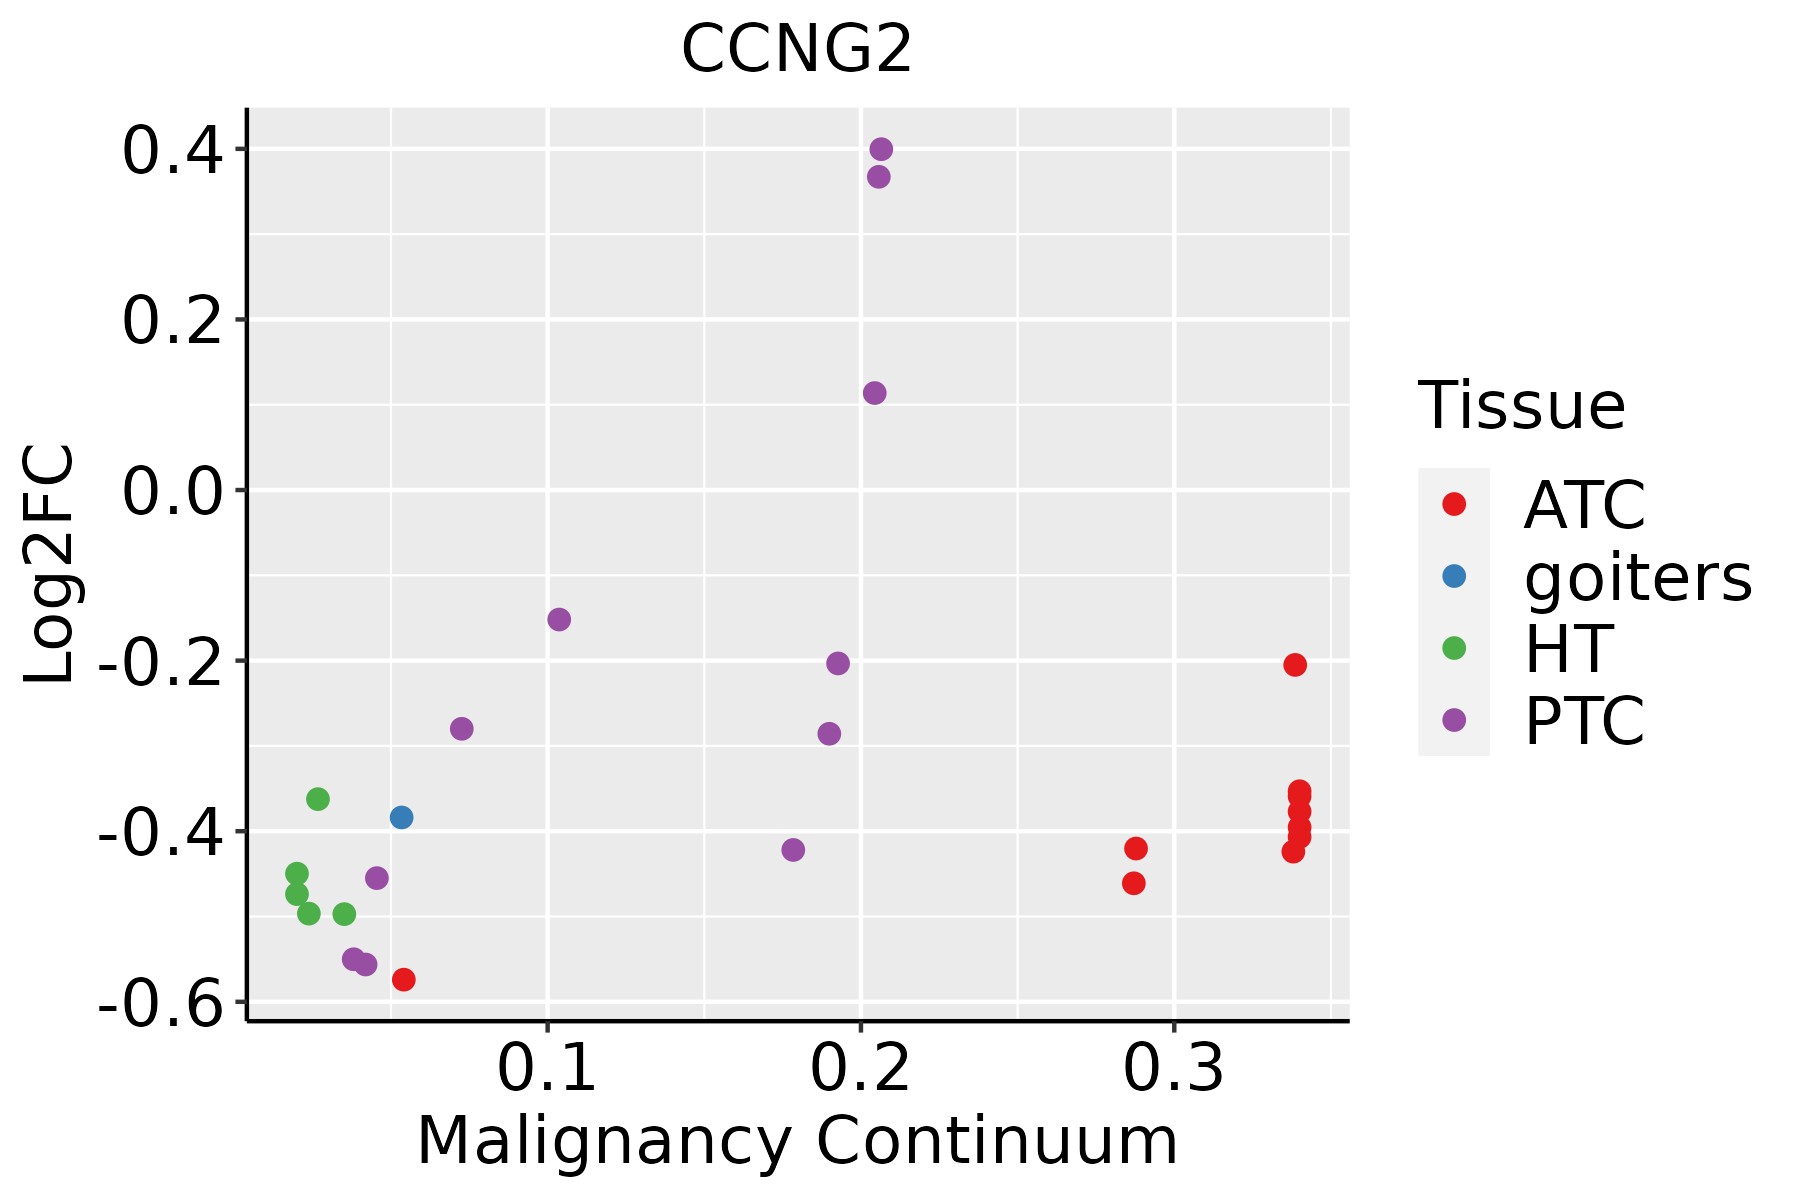 | ATC: Anaplastic thyroid cancer |
| HT: Hashimoto's thyroiditis | ||
| PTC: Papillary thyroid cancer |
| ∗log2FC in expression of this searched gene in stem-like cells from each diseased tissue sample relative to stem-like cells in normal samples in each tissue plotted against the malignancy continuum. Samples are colored based on if they are from different disease stage. |
Top |
Malignant transformation related pathway analysis |
| Find out the enriched GO biological processes and KEGG pathways involved in transition from healthy to precancer to cancer |
| Tissue | Disease Stage | Enriched GO biological Processes |
| Colorectum | AD |  |
| Colorectum | SER |  |
| Colorectum | MSS |  |
| Colorectum | MSI-H |  |
| Colorectum | FAP |  |
| ∗Top 15 enriched GO BP terms are showed in the bar plot of each disease state in each tissue. Each row represents a significant GO biological process which is colored according to the -log10(p.adjust). |
| Page: 1 2 3 4 5 6 7 8 9 |
| GO ID | Tissue | Disease Stage | Description | Gene Ratio | Bg Ratio | pvalue | p.adjust | Count |
| GO:00447724 | Breast | DCIS | mitotic cell cycle phase transition | 46/1390 | 424/18723 | 6.16e-03 | 4.39e-02 | 46 |
| GO:00447721 | Liver | Cirrhotic | mitotic cell cycle phase transition | 139/4634 | 424/18723 | 1.02e-04 | 1.06e-03 | 139 |
| GO:007190011 | Liver | Cirrhotic | regulation of protein serine/threonine kinase activity | 110/4634 | 359/18723 | 6.19e-03 | 3.08e-02 | 110 |
| GO:00447722 | Liver | HCC | mitotic cell cycle phase transition | 240/7958 | 424/18723 | 2.47e-09 | 6.84e-08 | 240 |
| GO:007190021 | Liver | HCC | regulation of protein serine/threonine kinase activity | 189/7958 | 359/18723 | 5.97e-05 | 5.47e-04 | 189 |
| GO:0000079 | Liver | HCC | regulation of cyclin-dependent protein serine/threonine kinase activity | 55/7958 | 94/18723 | 1.25e-03 | 6.91e-03 | 55 |
| GO:1904029 | Liver | HCC | regulation of cyclin-dependent protein kinase activity | 57/7958 | 98/18723 | 1.26e-03 | 6.92e-03 | 57 |
| GO:00447727 | Prostate | BPH | mitotic cell cycle phase transition | 112/3107 | 424/18723 | 1.57e-07 | 3.58e-06 | 112 |
| GO:00719009 | Prostate | BPH | regulation of protein serine/threonine kinase activity | 97/3107 | 359/18723 | 3.42e-07 | 7.23e-06 | 97 |
| GO:19040292 | Prostate | BPH | regulation of cyclin-dependent protein kinase activity | 34/3107 | 98/18723 | 1.00e-05 | 1.39e-04 | 34 |
| GO:00000792 | Prostate | BPH | regulation of cyclin-dependent protein serine/threonine kinase activity | 32/3107 | 94/18723 | 2.79e-05 | 3.27e-04 | 32 |
| GO:007190014 | Prostate | Tumor | regulation of protein serine/threonine kinase activity | 98/3246 | 359/18723 | 1.39e-06 | 2.51e-05 | 98 |
| GO:19040291 | Prostate | Tumor | regulation of cyclin-dependent protein kinase activity | 34/3246 | 98/18723 | 2.60e-05 | 3.18e-04 | 34 |
| GO:004477214 | Prostate | Tumor | mitotic cell cycle phase transition | 106/3246 | 424/18723 | 3.61e-05 | 4.21e-04 | 106 |
| GO:00000791 | Prostate | Tumor | regulation of cyclin-dependent protein serine/threonine kinase activity | 32/3246 | 94/18723 | 6.75e-05 | 7.21e-04 | 32 |
| GO:007190019 | Thyroid | HT | regulation of protein serine/threonine kinase activity | 43/1272 | 359/18723 | 2.09e-04 | 3.01e-03 | 43 |
| GO:19040296 | Thyroid | HT | regulation of cyclin-dependent protein kinase activity | 15/1272 | 98/18723 | 2.47e-03 | 2.08e-02 | 15 |
| GO:00000796 | Thyroid | HT | regulation of cyclin-dependent protein serine/threonine kinase activity | 14/1272 | 94/18723 | 4.36e-03 | 3.17e-02 | 14 |
| GO:004477218 | Thyroid | PTC | mitotic cell cycle phase transition | 196/5968 | 424/18723 | 3.17e-10 | 1.02e-08 | 196 |
| GO:0071900110 | Thyroid | PTC | regulation of protein serine/threonine kinase activity | 164/5968 | 359/18723 | 2.41e-08 | 5.43e-07 | 164 |
| Page: 1 2 |
| Pathway ID | Tissue | Disease Stage | Description | Gene Ratio | Bg Ratio | pvalue | p.adjust | qvalue | Count |
| hsa041157 | Breast | IDC | p53 signaling pathway | 16/867 | 74/8465 | 2.86e-03 | 1.86e-02 | 1.39e-02 | 16 |
| hsa0411512 | Breast | IDC | p53 signaling pathway | 16/867 | 74/8465 | 2.86e-03 | 1.86e-02 | 1.39e-02 | 16 |
| hsa0411521 | Breast | DCIS | p53 signaling pathway | 16/846 | 74/8465 | 2.23e-03 | 1.47e-02 | 1.08e-02 | 16 |
| hsa0411531 | Breast | DCIS | p53 signaling pathway | 16/846 | 74/8465 | 2.23e-03 | 1.47e-02 | 1.08e-02 | 16 |
| hsa040682 | Liver | Cirrhotic | FoxO signaling pathway | 52/2530 | 131/8465 | 9.98e-03 | 3.32e-02 | 2.05e-02 | 52 |
| hsa040683 | Liver | Cirrhotic | FoxO signaling pathway | 52/2530 | 131/8465 | 9.98e-03 | 3.32e-02 | 2.05e-02 | 52 |
| hsa040684 | Liver | HCC | FoxO signaling pathway | 85/4020 | 131/8465 | 3.99e-05 | 2.16e-04 | 1.20e-04 | 85 |
| hsa041156 | Liver | HCC | p53 signaling pathway | 46/4020 | 74/8465 | 7.64e-03 | 2.08e-02 | 1.16e-02 | 46 |
| hsa040685 | Liver | HCC | FoxO signaling pathway | 85/4020 | 131/8465 | 3.99e-05 | 2.16e-04 | 1.20e-04 | 85 |
| hsa0411511 | Liver | HCC | p53 signaling pathway | 46/4020 | 74/8465 | 7.64e-03 | 2.08e-02 | 1.16e-02 | 46 |
| hsa040687 | Prostate | BPH | FoxO signaling pathway | 54/1718 | 131/8465 | 3.05e-08 | 3.59e-07 | 2.22e-07 | 54 |
| hsa041158 | Prostate | BPH | p53 signaling pathway | 30/1718 | 74/8465 | 5.15e-05 | 3.40e-04 | 2.10e-04 | 30 |
| hsa0406812 | Prostate | BPH | FoxO signaling pathway | 54/1718 | 131/8465 | 3.05e-08 | 3.59e-07 | 2.22e-07 | 54 |
| hsa0411513 | Prostate | BPH | p53 signaling pathway | 30/1718 | 74/8465 | 5.15e-05 | 3.40e-04 | 2.10e-04 | 30 |
| hsa0406822 | Prostate | Tumor | FoxO signaling pathway | 54/1791 | 131/8465 | 1.32e-07 | 1.51e-06 | 9.36e-07 | 54 |
| hsa0411522 | Prostate | Tumor | p53 signaling pathway | 29/1791 | 74/8465 | 2.99e-04 | 1.65e-03 | 1.02e-03 | 29 |
| hsa0406832 | Prostate | Tumor | FoxO signaling pathway | 54/1791 | 131/8465 | 1.32e-07 | 1.51e-06 | 9.36e-07 | 54 |
| hsa0411532 | Prostate | Tumor | p53 signaling pathway | 29/1791 | 74/8465 | 2.99e-04 | 1.65e-03 | 1.02e-03 | 29 |
| Page: 1 |
Top |
Cell-cell communication analysis |
| Identification of potential cell-cell interactions between two cell types and their ligand-receptor pairs for different disease states |
| Ligand | Receptor | LRpair | Pathway | Tissue | Disease Stage |
| Page: 1 |
Top |
Single-cell gene regulatory network inference analysis |
| Find out the significant the regulons (TFs) and the target genes of each regulon across cell types for different disease states |
| TF | Cell Type | Tissue | Disease Stage | Target Gene | RSS | Regulon Activity |
| ∗The dot plots of a searched regulon are shown for all cell subpopulations in each disease state of each tissue based on the regulon specific score inferred using pySCENIC and by calculating the average expression. |
| Page: 1 |
Top |
Somatic mutation of malignant transformation related genes |
| Annotation of somatic variants for genes involved in malignant transformation |
| Hugo Symbol | Variant Class | Variant Classification | dbSNP RS | HGVSc | HGVSp | HGVSp Short | SWISSPROT | BIOTYPE | SIFT | PolyPhen | Tumor Sample Barcode | Tissue | Histology | Sex | Age | Stage | Therapy Types | Drugs | Outcome |
| CCNG2 | SNV | Missense_Mutation | rs558158350 | c.200C>T | p.Ala67Val | p.A67V | Q16589 | protein_coding | deleterious(0.01) | benign(0.065) | TCGA-A2-A0EV-01 | Breast | breast invasive carcinoma | Female | >=65 | I/II | Unknown | Unknown | SD |
| CCNG2 | insertion | In_Frame_Ins | novel | c.374_375insCCTTCAGCTCAAAGTCCTCATCAGGCCAAA | p.Val125_Ile126insLeuGlnLeuLysValLeuIleArgProLys | p.V125_I126insLQLKVLIRPK | Q16589 | protein_coding | TCGA-A8-A08H-01 | Breast | breast invasive carcinoma | Female | >=65 | I/II | Unknown | Unknown | SD | ||
| CCNG2 | insertion | In_Frame_Ins | novel | c.501_502insATTATATATTATGAATTTCATAAGTCTGAAATACAA | p.Ile169_Leu170insTyrTyrGluPheHisLysSerGluIleGlnIleIle | p.I169_L170insYYEFHKSEIQII | Q16589 | protein_coding | TCGA-BH-A0B4-01 | Breast | breast invasive carcinoma | Male | >=65 | III/IV | Hormone Therapy | tamoxiphen | SD | ||
| CCNG2 | insertion | In_Frame_Ins | novel | c.453_454insTCTCTTCAAAGCAGG | p.Tyr151_Glu152insSerLeuGlnSerArg | p.Y151_E152insSLQSR | Q16589 | protein_coding | TCGA-BH-A0B8-01 | Breast | breast invasive carcinoma | Female | <65 | I/II | Hormone Therapy | arimidex | SD | ||
| CCNG2 | insertion | Nonsense_Mutation | novel | c.455_456insGCCATGGTTTTATTAACAGTCACCAGC | p.Glu152_Leu153insProTrpPheTyrTerGlnSerProAla | p.E152_L153insPWFY*QSPA | Q16589 | protein_coding | TCGA-BH-A0B8-01 | Breast | breast invasive carcinoma | Female | <65 | I/II | Hormone Therapy | arimidex | SD | ||
| CCNG2 | SNV | Missense_Mutation | c.707N>C | p.Ile236Thr | p.I236T | Q16589 | protein_coding | deleterious(0.01) | benign(0.045) | TCGA-CK-4951-01 | Colorectum | colon adenocarcinoma | Female | >=65 | I/II | Unknown | Unknown | PD | |
| CCNG2 | SNV | Missense_Mutation | c.938N>A | p.Cys313Tyr | p.C313Y | Q16589 | protein_coding | deleterious_low_confidence(0) | benign(0.172) | TCGA-D5-6928-01 | Colorectum | colon adenocarcinoma | Male | >=65 | I/II | Unknown | Unknown | SD | |
| CCNG2 | deletion | Frame_Shift_Del | novel | c.205delN | p.Phe70LeufsTer22 | p.F70Lfs*22 | Q16589 | protein_coding | TCGA-AA-3950-01 | Colorectum | colon adenocarcinoma | Female | >=65 | I/II | Unknown | Unknown | SD | ||
| CCNG2 | insertion | Frame_Shift_Ins | novel | c.430_431insACAAGAGGCTTCT | p.Ile144AsnfsTer13 | p.I144Nfs*13 | Q16589 | protein_coding | TCGA-AM-5820-01 | Colorectum | colon adenocarcinoma | Female | <65 | I/II | Unknown | Unknown | SD | ||
| CCNG2 | SNV | Missense_Mutation | novel | c.829G>T | p.Ala277Ser | p.A277S | Q16589 | protein_coding | deleterious(0.02) | probably_damaging(0.996) | TCGA-AP-A051-01 | Endometrium | uterine corpus endometrioid carcinoma | Female | >=65 | I/II | Unknown | Unknown | SD |
| Page: 1 2 3 |
Top |
Related drugs of malignant transformation related genes |
| Identification of chemicals and drugs interact with genes involved in malignant transfromation |
| (DGIdb 4.0) |
| Entrez ID | Symbol | Category | Interaction Types | Drug Claim Name | Drug Name | PMIDs |
| Page: 1 |

Copyright 2023-Present -The University of Texas Health Science Center at Houston |