
|
|||||
|
 | |
| |
| |
| |
| |
| |
|
Gene: CCNG1 |
Gene summary for CCNG1 |
| Gene information | Species | Human | Gene symbol | CCNG1 | Gene ID | 900 |
| Gene name | cyclin G1 | |
| Gene Alias | CCNG | |
| Cytomap | 5q34 | |
| Gene Type | protein-coding | GO ID | GO:0000079 | UniProtAcc | P51959 |
Top |
Malignant transformation analysis |
| Identification of the aberrant gene expression in precancerous and cancerous lesions by comparing the gene expression of stem-like cells in diseased tissues with normal stem cells |
| Entrez ID | Symbol | Replicates | Species | Organ | Tissue | Adj P-value | Log2FC | Malignancy |
| 900 | CCNG1 | LZE4T | Human | Esophagus | ESCC | 9.88e-08 | 1.01e-01 | 0.0811 |
| 900 | CCNG1 | LZE7T | Human | Esophagus | ESCC | 2.13e-03 | 1.30e-01 | 0.0667 |
| 900 | CCNG1 | LZE24T | Human | Esophagus | ESCC | 1.13e-02 | 1.61e-01 | 0.0596 |
| 900 | CCNG1 | LZE21T | Human | Esophagus | ESCC | 1.11e-02 | -2.48e-01 | 0.0655 |
| 900 | CCNG1 | LZE6T | Human | Esophagus | ESCC | 8.83e-08 | -9.06e-03 | 0.0845 |
| 900 | CCNG1 | P2T-E | Human | Esophagus | ESCC | 5.64e-20 | 3.52e-01 | 0.1177 |
| 900 | CCNG1 | P4T-E | Human | Esophagus | ESCC | 5.44e-10 | 1.49e-01 | 0.1323 |
| 900 | CCNG1 | P5T-E | Human | Esophagus | ESCC | 1.94e-17 | -6.32e-02 | 0.1327 |
| 900 | CCNG1 | P8T-E | Human | Esophagus | ESCC | 1.81e-14 | -6.34e-02 | 0.0889 |
| 900 | CCNG1 | P9T-E | Human | Esophagus | ESCC | 3.14e-14 | -7.34e-02 | 0.1131 |
| 900 | CCNG1 | P10T-E | Human | Esophagus | ESCC | 1.81e-14 | 5.99e-03 | 0.116 |
| 900 | CCNG1 | P12T-E | Human | Esophagus | ESCC | 1.05e-07 | 1.89e-01 | 0.1122 |
| 900 | CCNG1 | P15T-E | Human | Esophagus | ESCC | 4.66e-10 | 1.38e-01 | 0.1149 |
| 900 | CCNG1 | P16T-E | Human | Esophagus | ESCC | 6.58e-21 | 9.66e-02 | 0.1153 |
| 900 | CCNG1 | P20T-E | Human | Esophagus | ESCC | 5.16e-03 | -9.79e-02 | 0.1124 |
| 900 | CCNG1 | P21T-E | Human | Esophagus | ESCC | 2.49e-11 | 1.86e-01 | 0.1617 |
| 900 | CCNG1 | P22T-E | Human | Esophagus | ESCC | 3.35e-22 | 1.90e-01 | 0.1236 |
| 900 | CCNG1 | P23T-E | Human | Esophagus | ESCC | 2.31e-10 | 1.15e-01 | 0.108 |
| 900 | CCNG1 | P24T-E | Human | Esophagus | ESCC | 4.09e-10 | -2.78e-02 | 0.1287 |
| 900 | CCNG1 | P26T-E | Human | Esophagus | ESCC | 3.48e-18 | 1.80e-01 | 0.1276 |
| Page: 1 2 3 4 5 6 |
| Tissue | Expression Dynamics | Abbreviation |
| Esophagus | 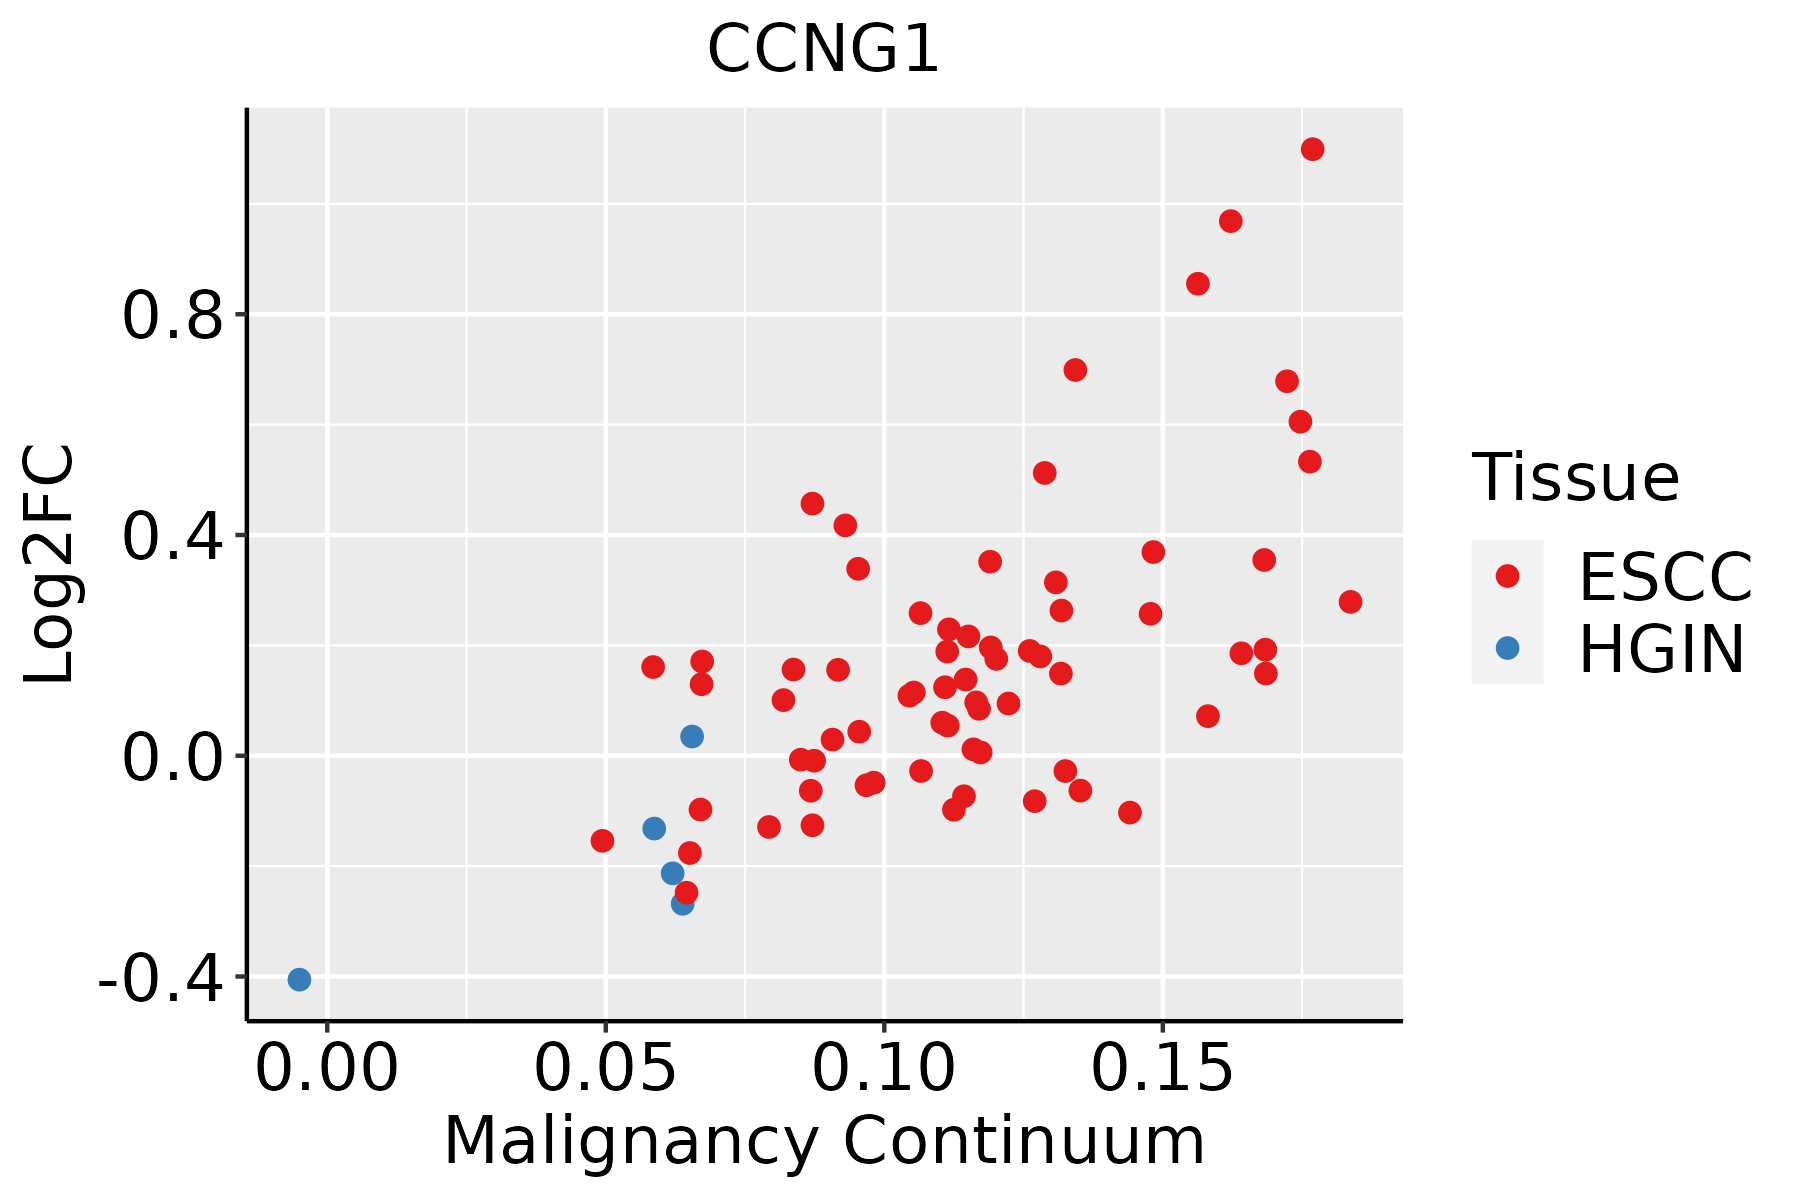 | ESCC: Esophageal squamous cell carcinoma |
| HGIN: High-grade intraepithelial neoplasias | ||
| LGIN: Low-grade intraepithelial neoplasias | ||
| Liver | 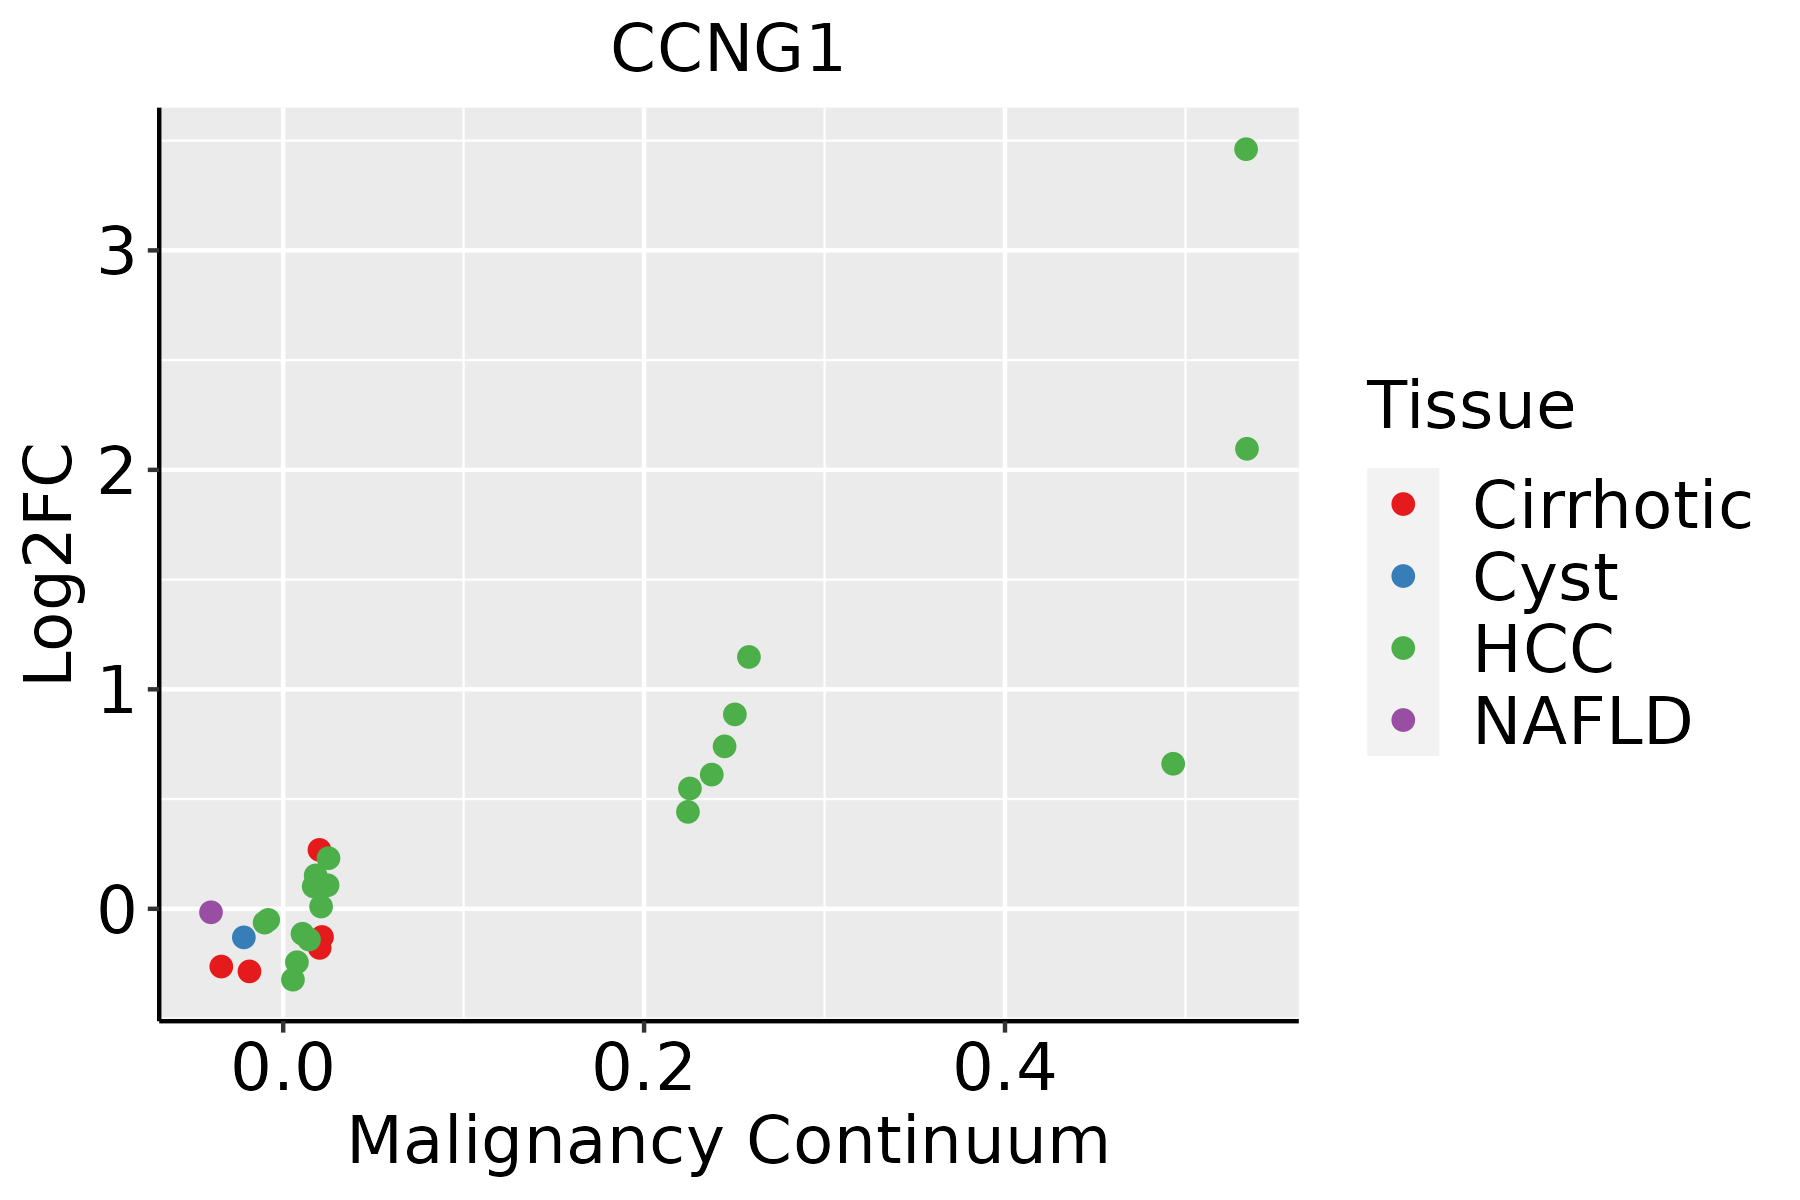 | HCC: Hepatocellular carcinoma |
| NAFLD: Non-alcoholic fatty liver disease | ||
| Oral Cavity | 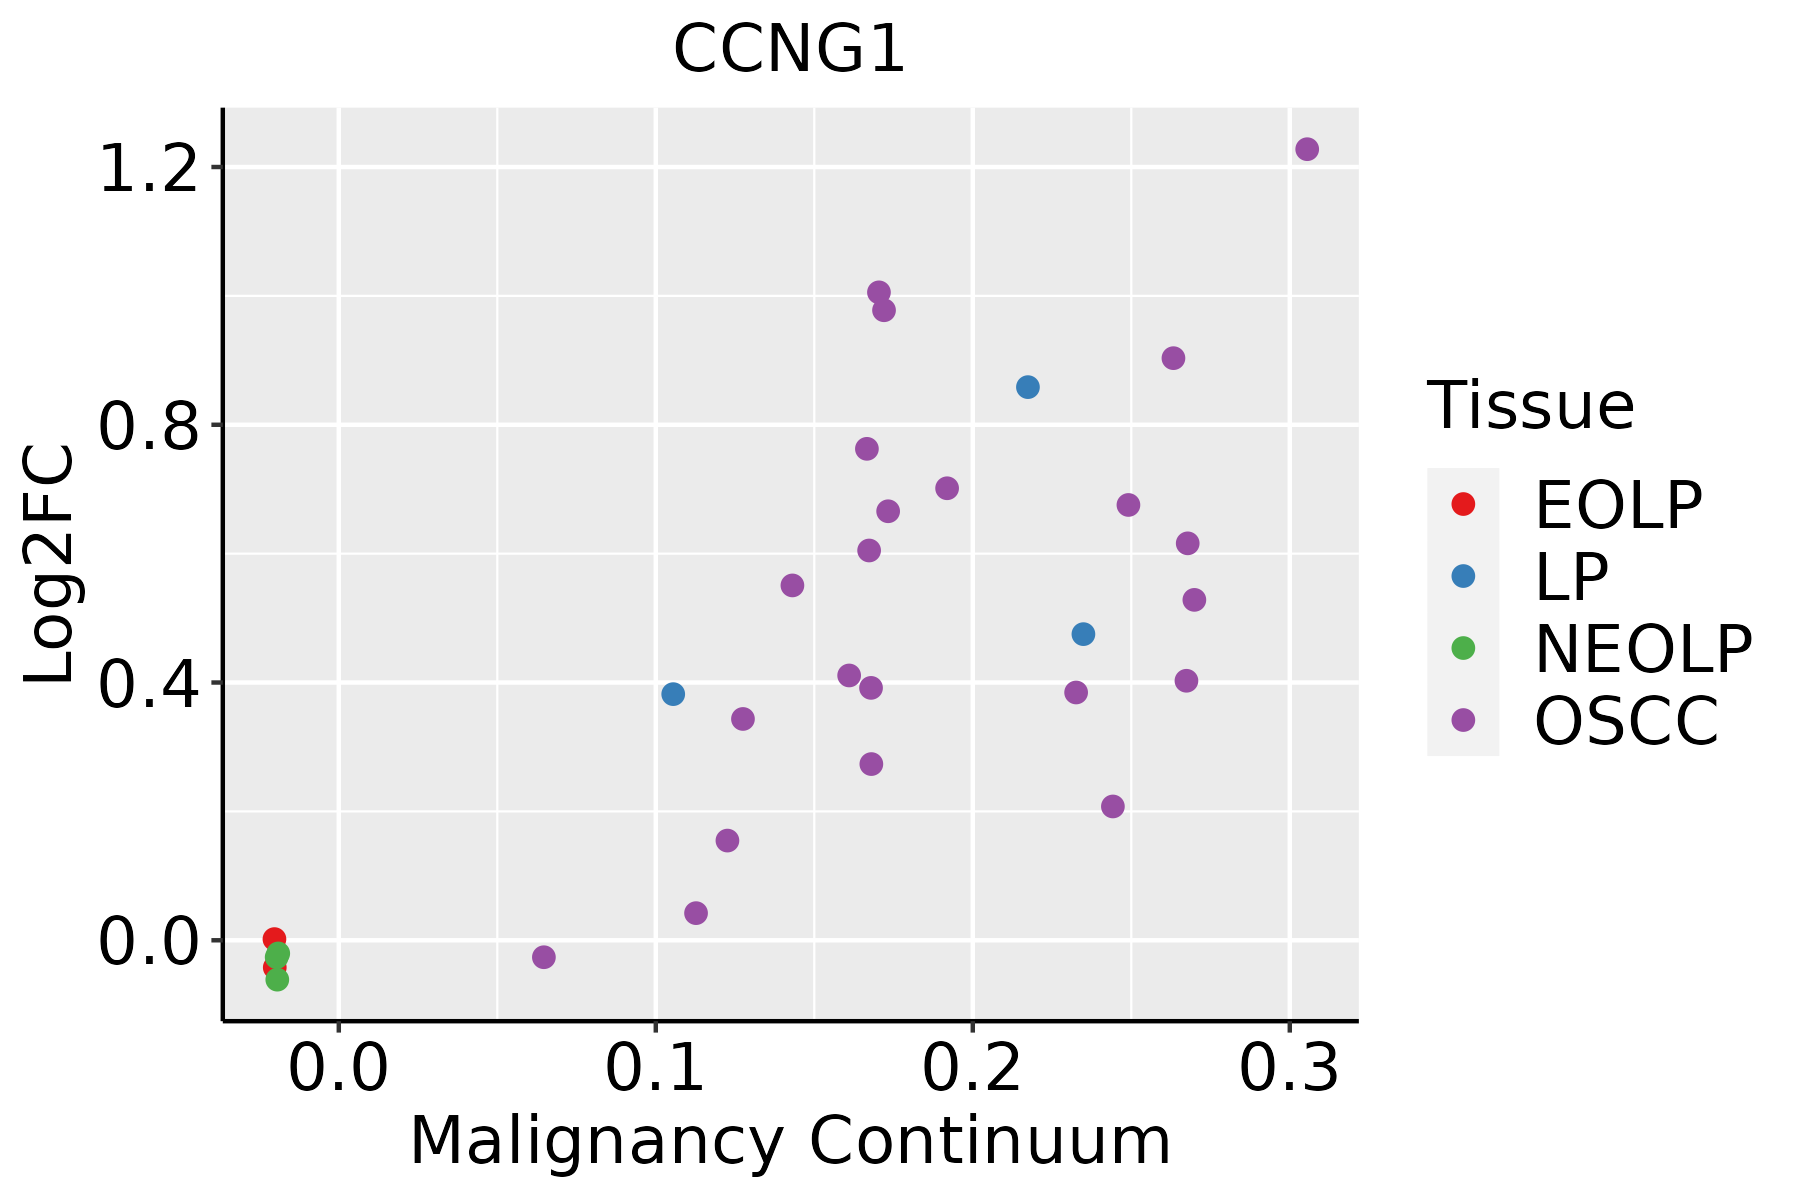 | EOLP: Erosive Oral lichen planus |
| LP: leukoplakia | ||
| NEOLP: Non-erosive oral lichen planus | ||
| OSCC: Oral squamous cell carcinoma | ||
| Prostate |  | BPH: Benign Prostatic Hyperplasia |
| Skin | 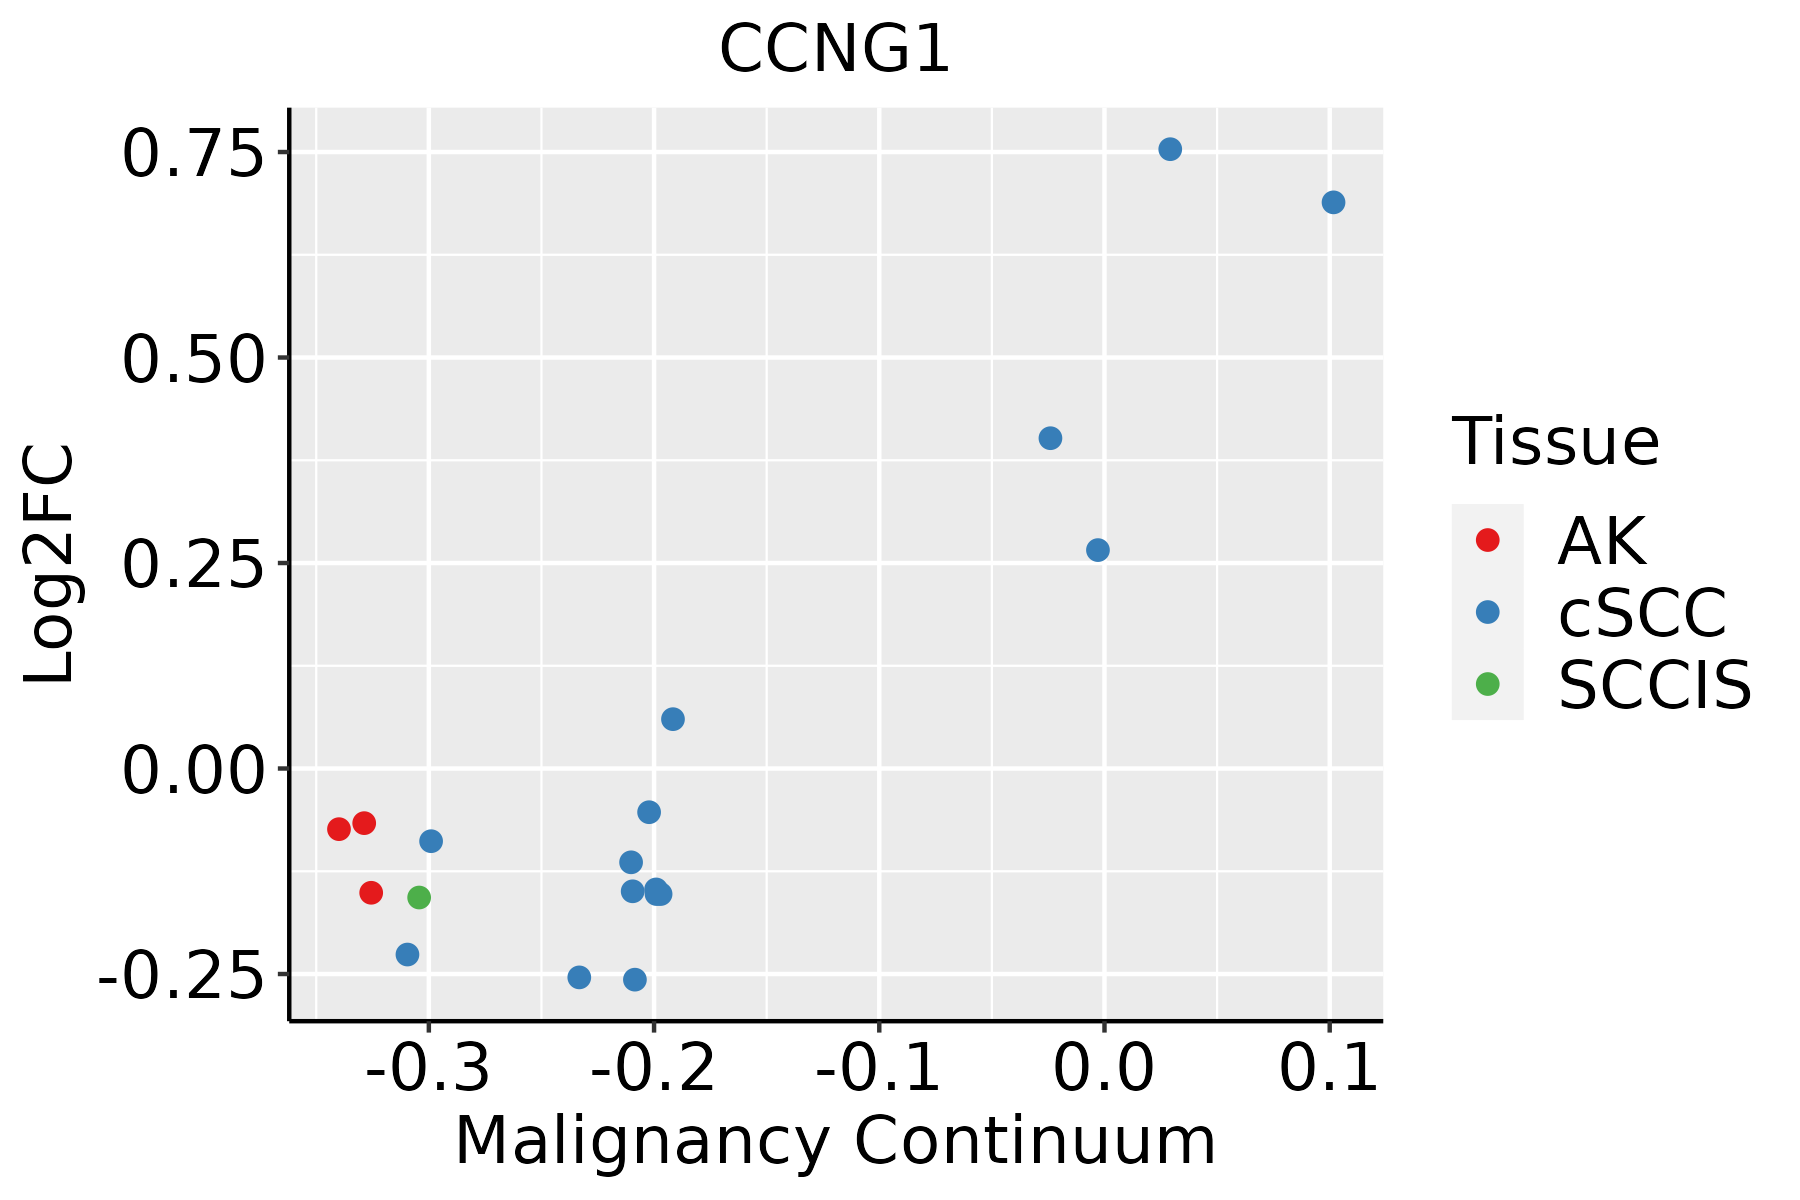 | AK: Actinic keratosis |
| cSCC: Cutaneous squamous cell carcinoma | ||
| SCCIS:squamous cell carcinoma in situ | ||
| Thyroid | 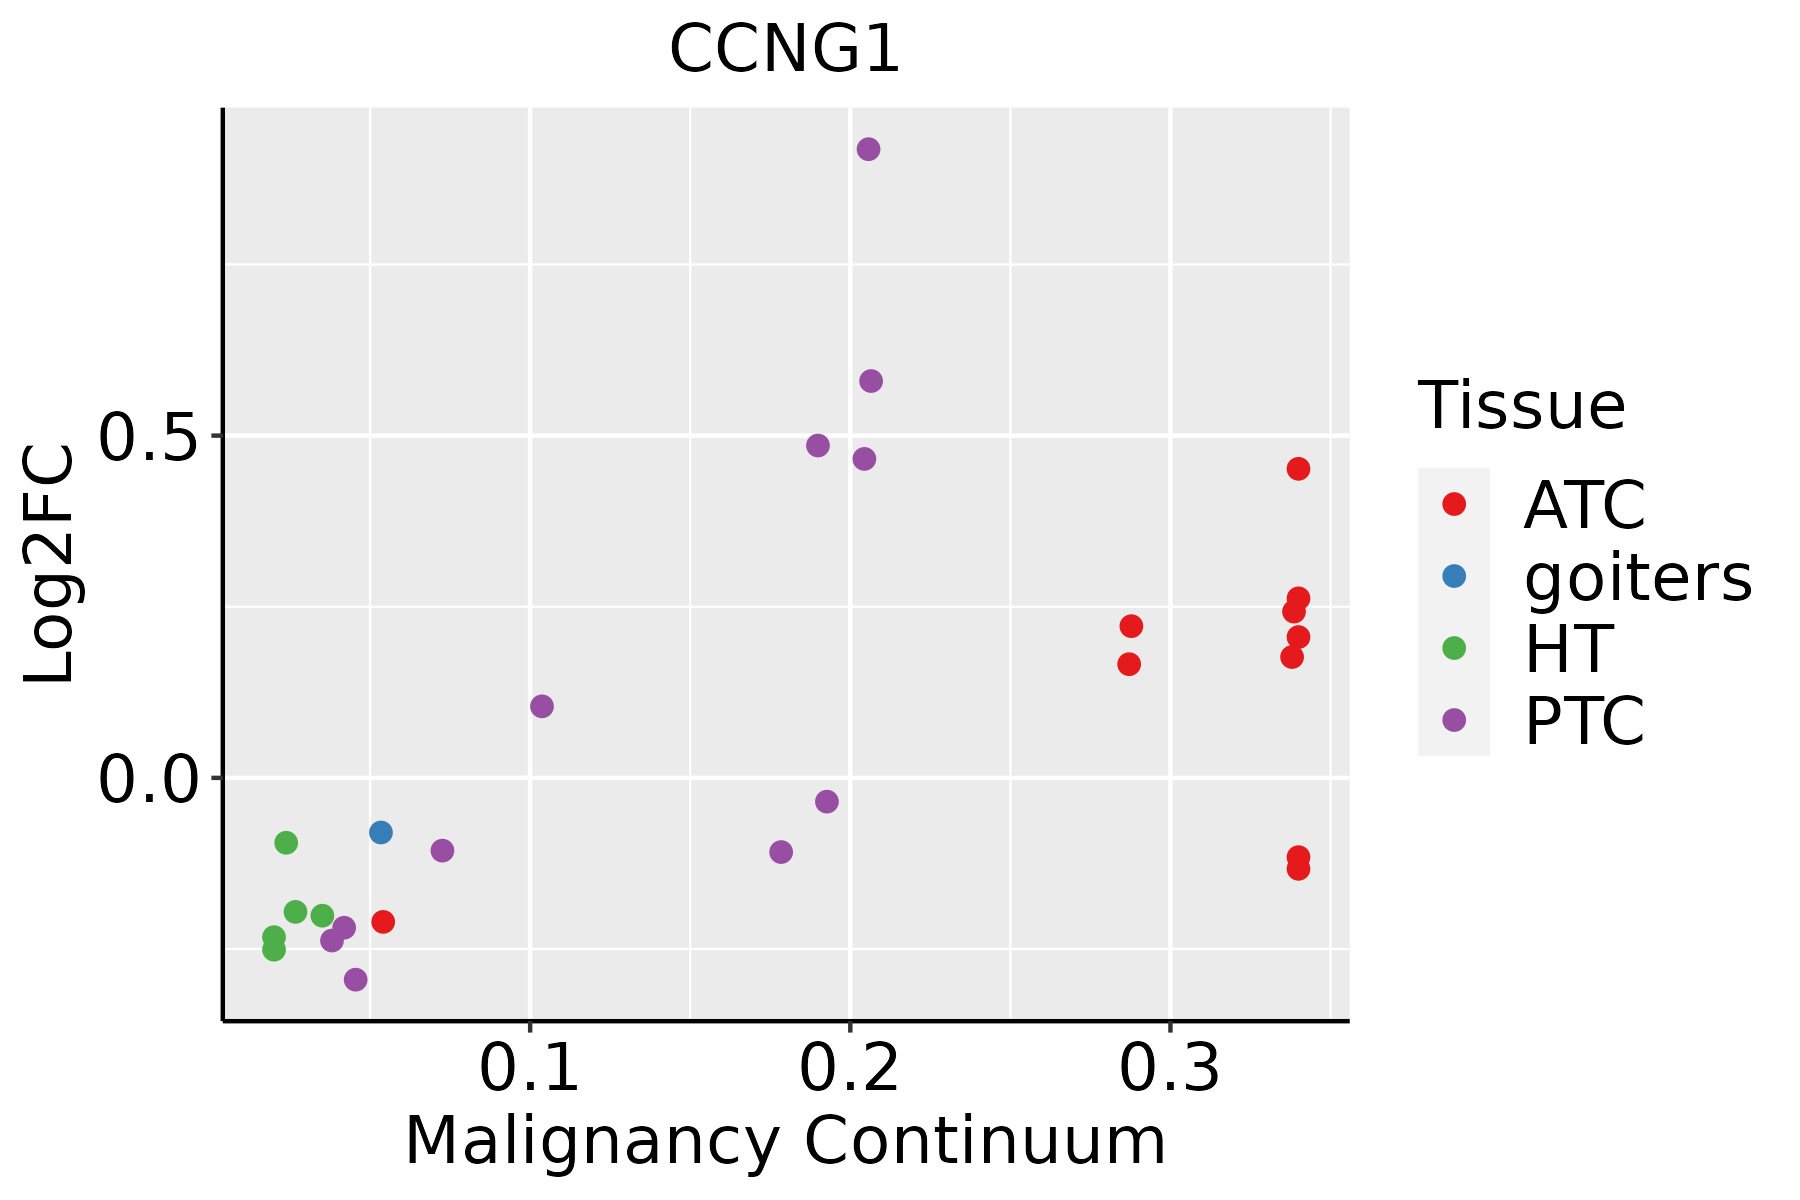 | ATC: Anaplastic thyroid cancer |
| HT: Hashimoto's thyroiditis | ||
| PTC: Papillary thyroid cancer |
| ∗log2FC in expression of this searched gene in stem-like cells from each diseased tissue sample relative to stem-like cells in normal samples in each tissue plotted against the malignancy continuum. Samples are colored based on if they are from different disease stage. |
Top |
Malignant transformation related pathway analysis |
| Find out the enriched GO biological processes and KEGG pathways involved in transition from healthy to precancer to cancer |
| Tissue | Disease Stage | Enriched GO biological Processes |
| Colorectum | AD |  |
| Colorectum | SER |  |
| Colorectum | MSS |  |
| Colorectum | MSI-H |  |
| Colorectum | FAP |  |
| ∗Top 15 enriched GO BP terms are showed in the bar plot of each disease state in each tissue. Each row represents a significant GO biological process which is colored according to the -log10(p.adjust). |
| Page: 1 2 3 4 5 6 7 8 9 |
| GO ID | Tissue | Disease Stage | Description | Gene Ratio | Bg Ratio | pvalue | p.adjust | Count |
| GO:004477216 | Esophagus | ESCC | mitotic cell cycle phase transition | 281/8552 | 424/18723 | 4.63e-18 | 4.45e-16 | 281 |
| GO:007190016 | Esophagus | ESCC | regulation of protein serine/threonine kinase activity | 227/8552 | 359/18723 | 1.12e-11 | 4.10e-10 | 227 |
| GO:19040294 | Esophagus | ESCC | regulation of cyclin-dependent protein kinase activity | 69/8552 | 98/18723 | 6.04e-07 | 7.91e-06 | 69 |
| GO:00000794 | Esophagus | ESCC | regulation of cyclin-dependent protein serine/threonine kinase activity | 66/8552 | 94/18723 | 1.24e-06 | 1.53e-05 | 66 |
| GO:00447721 | Liver | Cirrhotic | mitotic cell cycle phase transition | 139/4634 | 424/18723 | 1.02e-04 | 1.06e-03 | 139 |
| GO:007190011 | Liver | Cirrhotic | regulation of protein serine/threonine kinase activity | 110/4634 | 359/18723 | 6.19e-03 | 3.08e-02 | 110 |
| GO:00447722 | Liver | HCC | mitotic cell cycle phase transition | 240/7958 | 424/18723 | 2.47e-09 | 6.84e-08 | 240 |
| GO:007190021 | Liver | HCC | regulation of protein serine/threonine kinase activity | 189/7958 | 359/18723 | 5.97e-05 | 5.47e-04 | 189 |
| GO:0000079 | Liver | HCC | regulation of cyclin-dependent protein serine/threonine kinase activity | 55/7958 | 94/18723 | 1.25e-03 | 6.91e-03 | 55 |
| GO:1904029 | Liver | HCC | regulation of cyclin-dependent protein kinase activity | 57/7958 | 98/18723 | 1.26e-03 | 6.92e-03 | 57 |
| GO:00447728 | Oral cavity | OSCC | mitotic cell cycle phase transition | 255/7305 | 424/18723 | 5.29e-19 | 6.98e-17 | 255 |
| GO:007190010 | Oral cavity | OSCC | regulation of protein serine/threonine kinase activity | 201/7305 | 359/18723 | 3.90e-11 | 1.27e-09 | 201 |
| GO:19040293 | Oral cavity | OSCC | regulation of cyclin-dependent protein kinase activity | 60/7305 | 98/18723 | 6.90e-06 | 7.56e-05 | 60 |
| GO:00000793 | Oral cavity | OSCC | regulation of cyclin-dependent protein serine/threonine kinase activity | 58/7305 | 94/18723 | 6.92e-06 | 7.57e-05 | 58 |
| GO:004477215 | Oral cavity | LP | mitotic cell cycle phase transition | 150/4623 | 424/18723 | 4.38e-07 | 1.23e-05 | 150 |
| GO:007190015 | Oral cavity | LP | regulation of protein serine/threonine kinase activity | 119/4623 | 359/18723 | 1.70e-04 | 1.90e-03 | 119 |
| GO:000007911 | Oral cavity | LP | regulation of cyclin-dependent protein serine/threonine kinase activity | 34/4623 | 94/18723 | 8.52e-03 | 4.61e-02 | 34 |
| GO:00447727 | Prostate | BPH | mitotic cell cycle phase transition | 112/3107 | 424/18723 | 1.57e-07 | 3.58e-06 | 112 |
| GO:00719009 | Prostate | BPH | regulation of protein serine/threonine kinase activity | 97/3107 | 359/18723 | 3.42e-07 | 7.23e-06 | 97 |
| GO:19040292 | Prostate | BPH | regulation of cyclin-dependent protein kinase activity | 34/3107 | 98/18723 | 1.00e-05 | 1.39e-04 | 34 |
| Page: 1 2 |
| Pathway ID | Tissue | Disease Stage | Description | Gene Ratio | Bg Ratio | pvalue | p.adjust | qvalue | Count |
| hsa0411524 | Esophagus | ESCC | p53 signaling pathway | 65/4205 | 74/8465 | 3.88e-12 | 6.50e-11 | 3.33e-11 | 65 |
| hsa0411534 | Esophagus | ESCC | p53 signaling pathway | 65/4205 | 74/8465 | 3.88e-12 | 6.50e-11 | 3.33e-11 | 65 |
| hsa041156 | Liver | HCC | p53 signaling pathway | 46/4020 | 74/8465 | 7.64e-03 | 2.08e-02 | 1.16e-02 | 46 |
| hsa0411511 | Liver | HCC | p53 signaling pathway | 46/4020 | 74/8465 | 7.64e-03 | 2.08e-02 | 1.16e-02 | 46 |
| hsa041159 | Oral cavity | OSCC | p53 signaling pathway | 57/3704 | 74/8465 | 4.99e-09 | 5.07e-08 | 2.58e-08 | 57 |
| hsa0411514 | Oral cavity | OSCC | p53 signaling pathway | 57/3704 | 74/8465 | 4.99e-09 | 5.07e-08 | 2.58e-08 | 57 |
| hsa0411523 | Oral cavity | LP | p53 signaling pathway | 38/2418 | 74/8465 | 2.82e-05 | 1.92e-04 | 1.24e-04 | 38 |
| hsa0411533 | Oral cavity | LP | p53 signaling pathway | 38/2418 | 74/8465 | 2.82e-05 | 1.92e-04 | 1.24e-04 | 38 |
| hsa041158 | Prostate | BPH | p53 signaling pathway | 30/1718 | 74/8465 | 5.15e-05 | 3.40e-04 | 2.10e-04 | 30 |
| hsa0411513 | Prostate | BPH | p53 signaling pathway | 30/1718 | 74/8465 | 5.15e-05 | 3.40e-04 | 2.10e-04 | 30 |
| hsa0411522 | Prostate | Tumor | p53 signaling pathway | 29/1791 | 74/8465 | 2.99e-04 | 1.65e-03 | 1.02e-03 | 29 |
| hsa0411532 | Prostate | Tumor | p53 signaling pathway | 29/1791 | 74/8465 | 2.99e-04 | 1.65e-03 | 1.02e-03 | 29 |
| Page: 1 |
Top |
Cell-cell communication analysis |
| Identification of potential cell-cell interactions between two cell types and their ligand-receptor pairs for different disease states |
| Ligand | Receptor | LRpair | Pathway | Tissue | Disease Stage |
| Page: 1 |
Top |
Single-cell gene regulatory network inference analysis |
| Find out the significant the regulons (TFs) and the target genes of each regulon across cell types for different disease states |
| TF | Cell Type | Tissue | Disease Stage | Target Gene | RSS | Regulon Activity |
| ∗The dot plots of a searched regulon are shown for all cell subpopulations in each disease state of each tissue based on the regulon specific score inferred using pySCENIC and by calculating the average expression. |
| Page: 1 |
Top |
Somatic mutation of malignant transformation related genes |
| Annotation of somatic variants for genes involved in malignant transformation |
| Hugo Symbol | Variant Class | Variant Classification | dbSNP RS | HGVSc | HGVSp | HGVSp Short | SWISSPROT | BIOTYPE | SIFT | PolyPhen | Tumor Sample Barcode | Tissue | Histology | Sex | Age | Stage | Therapy Types | Drugs | Outcome |
| CCNG1 | insertion | In_Frame_Ins | novel | c.135_136insCTGAGATTCACACTCACCACAATTATTCCTGTTAACAGTCTGCCACAT | p.Leu45_Arg46insLeuArgPheThrLeuThrThrIleIleProValAsnSerLeuProHis | p.L45_R46insLRFTLTTIIPVNSLPH | P51959 | protein_coding | TCGA-AO-A0J9-01 | Breast | breast invasive carcinoma | Female | <65 | III/IV | Chemotherapy | cyclophosphamide | PD | ||
| CCNG1 | SNV | Missense_Mutation | novel | c.405N>A | p.Met135Ile | p.M135I | P51959 | protein_coding | tolerated(0.33) | benign(0.163) | TCGA-HM-A4S6-01 | Cervix | cervical & endocervical cancer | Female | <65 | III/IV | Chemotherapy | cisplatin | CR |
| CCNG1 | SNV | Missense_Mutation | c.629N>C | p.Leu210Ser | p.L210S | P51959 | protein_coding | tolerated(0.08) | probably_damaging(0.929) | TCGA-AA-3811-01 | Colorectum | colon adenocarcinoma | Female | >=65 | III/IV | Unknown | Unknown | PD | |
| CCNG1 | SNV | Missense_Mutation | c.157N>A | p.Asp53Asn | p.D53N | P51959 | protein_coding | tolerated(0.41) | benign(0.062) | TCGA-AA-3854-01 | Colorectum | colon adenocarcinoma | Female | >=65 | I/II | Unknown | Unknown | SD | |
| CCNG1 | SNV | Missense_Mutation | novel | c.555A>T | p.Gln185His | p.Q185H | P51959 | protein_coding | deleterious(0.04) | benign(0.026) | TCGA-AG-3731-01 | Colorectum | rectum adenocarcinoma | Male | >=65 | III/IV | Chemotherapy | folinic | PR |
| CCNG1 | SNV | Missense_Mutation | novel | c.141G>T | p.Met47Ile | p.M47I | P51959 | protein_coding | tolerated(0.51) | benign(0.021) | TCGA-AG-A002-01 | Colorectum | rectum adenocarcinoma | Male | <65 | I/II | Unknown | Unknown | SD |
| CCNG1 | SNV | Missense_Mutation | novel | c.872C>A | p.Pro291His | p.P291H | P51959 | protein_coding | deleterious(0.05) | probably_damaging(0.998) | TCGA-A5-A1OF-01 | Endometrium | uterine corpus endometrioid carcinoma | Female | <65 | I/II | Unknown | Unknown | SD |
| CCNG1 | SNV | Missense_Mutation | c.809N>A | p.Ser270Tyr | p.S270Y | P51959 | protein_coding | deleterious(0) | probably_damaging(0.997) | TCGA-A5-A2K5-01 | Endometrium | uterine corpus endometrioid carcinoma | Female | >=65 | I/II | Unknown | Unknown | SD | |
| CCNG1 | SNV | Missense_Mutation | c.107T>G | p.Leu36Arg | p.L36R | P51959 | protein_coding | deleterious(0) | probably_damaging(0.948) | TCGA-AP-A056-01 | Endometrium | uterine corpus endometrioid carcinoma | Female | <65 | I/II | Unknown | Unknown | SD | |
| CCNG1 | SNV | Missense_Mutation | novel | c.61N>A | p.Leu21Met | p.L21M | P51959 | protein_coding | deleterious(0.03) | benign(0.218) | TCGA-AP-A1DK-01 | Endometrium | uterine corpus endometrioid carcinoma | Female | <65 | I/II | Unknown | Unknown | SD |
| Page: 1 2 3 4 |
Top |
Related drugs of malignant transformation related genes |
| Identification of chemicals and drugs interact with genes involved in malignant transfromation |
| (DGIdb 4.0) |
| Entrez ID | Symbol | Category | Interaction Types | Drug Claim Name | Drug Name | PMIDs |
| 900 | CCNG1 | KINASE | MX-DNG1 |
| Page: 1 |

Copyright 2023-Present -The University of Texas Health Science Center at Houston |