
|
|||||
|
 | |
| |
| |
| |
| |
| |
|
Gene: CCNE2 |
Gene summary for CCNE2 |
| Gene information | Species | Human | Gene symbol | CCNE2 | Gene ID | 9134 |
| Gene name | cyclin E2 | |
| Gene Alias | CYCE2 | |
| Cytomap | 8q22.1 | |
| Gene Type | protein-coding | GO ID | GO:0000003 | UniProtAcc | A0A024R9B0 |
Top |
Malignant transformation analysis |
| Identification of the aberrant gene expression in precancerous and cancerous lesions by comparing the gene expression of stem-like cells in diseased tissues with normal stem cells |
| Entrez ID | Symbol | Replicates | Species | Organ | Tissue | Adj P-value | Log2FC | Malignancy |
| 9134 | CCNE2 | C21 | Human | Oral cavity | OSCC | 4.98e-12 | 5.93e-01 | 0.2678 |
| 9134 | CCNE2 | C30 | Human | Oral cavity | OSCC | 1.45e-06 | 5.01e-01 | 0.3055 |
| 9134 | CCNE2 | C43 | Human | Oral cavity | OSCC | 2.35e-09 | 1.30e-01 | 0.1704 |
| 9134 | CCNE2 | C46 | Human | Oral cavity | OSCC | 8.22e-03 | 1.79e-01 | 0.1673 |
| 9134 | CCNE2 | C57 | Human | Oral cavity | OSCC | 4.93e-03 | 2.08e-01 | 0.1679 |
| 9134 | CCNE2 | LN22 | Human | Oral cavity | OSCC | 2.09e-04 | 4.44e-01 | 0.1733 |
| 9134 | CCNE2 | LN46 | Human | Oral cavity | OSCC | 4.37e-04 | 2.71e-01 | 0.1666 |
| 9134 | CCNE2 | SYSMH3 | Human | Oral cavity | OSCC | 8.97e-05 | 2.10e-01 | 0.2442 |
| Page: 1 |
| Tissue | Expression Dynamics | Abbreviation |
| Oral Cavity | 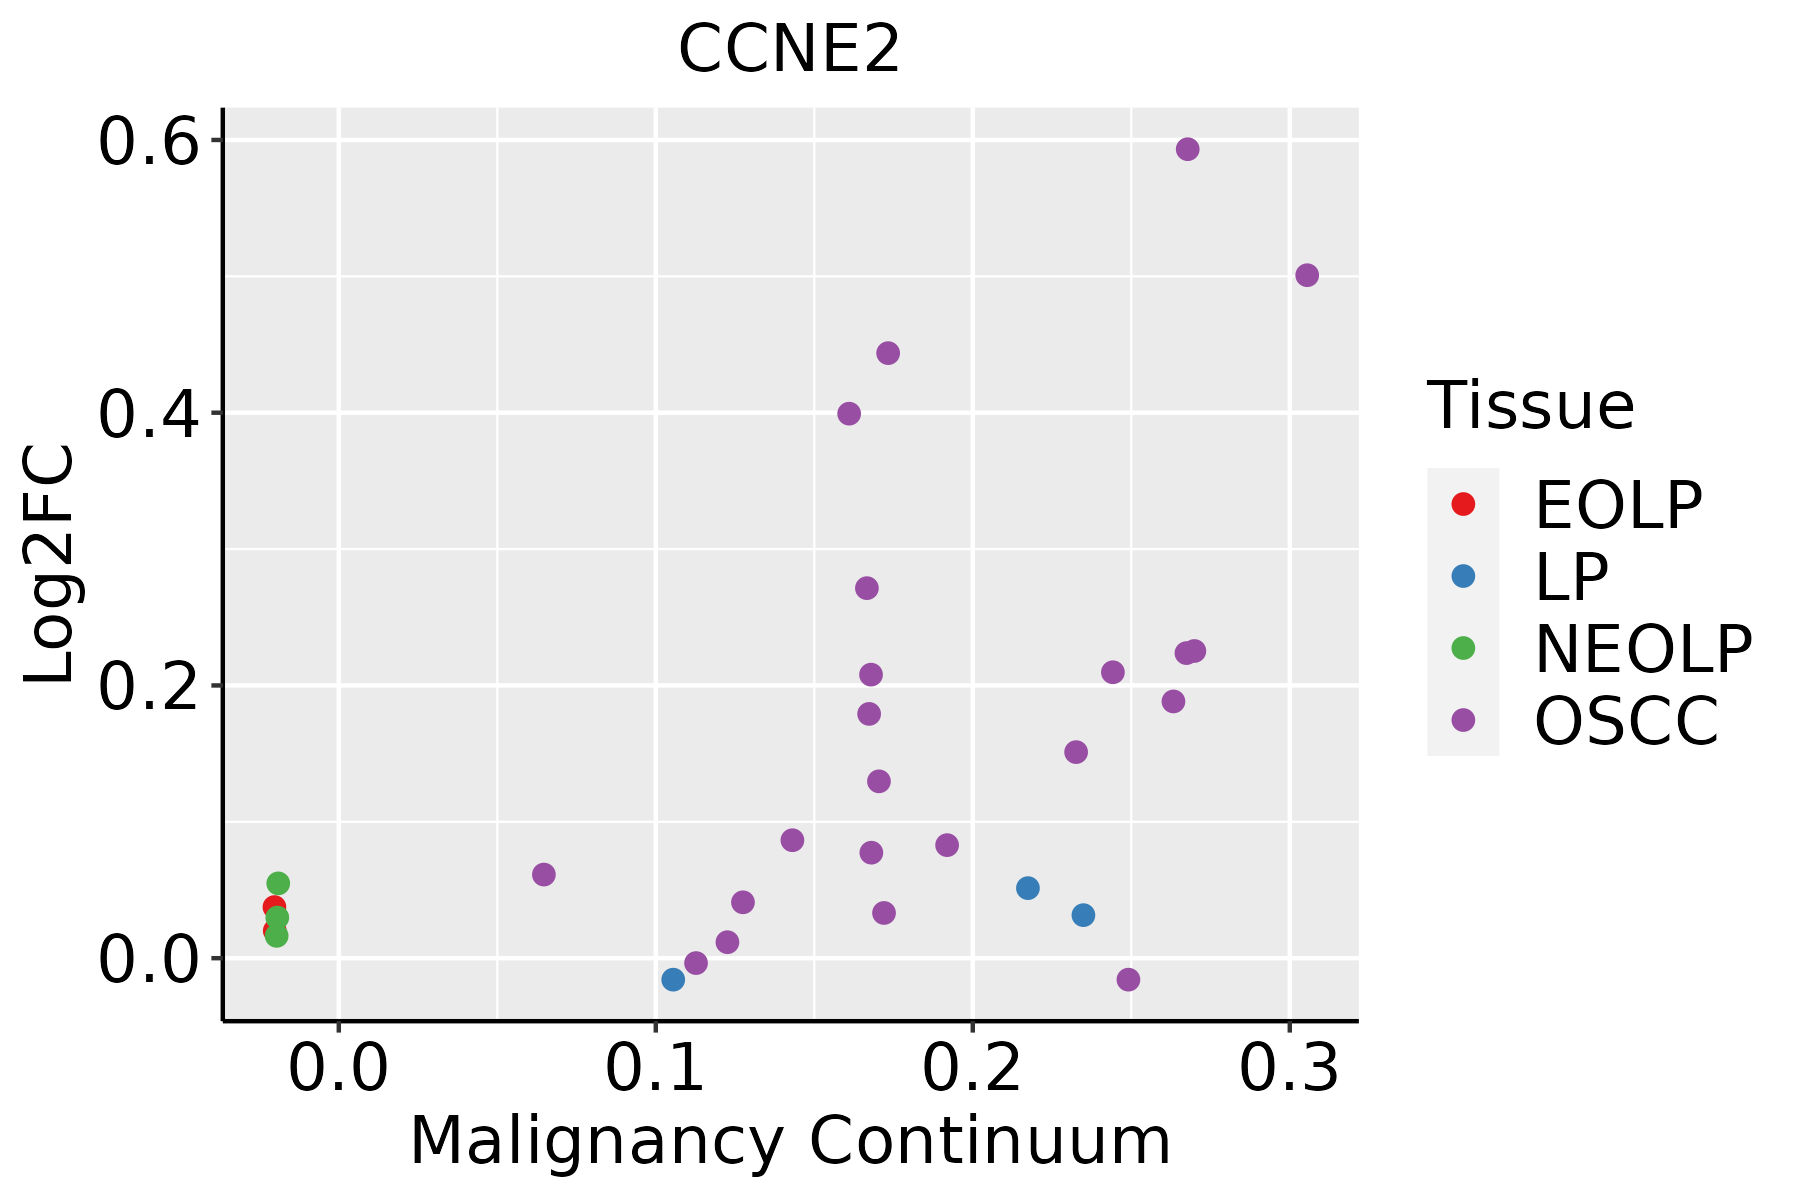 | EOLP: Erosive Oral lichen planus |
| LP: leukoplakia | ||
| NEOLP: Non-erosive oral lichen planus | ||
| OSCC: Oral squamous cell carcinoma |
| ∗log2FC in expression of this searched gene in stem-like cells from each diseased tissue sample relative to stem-like cells in normal samples in each tissue plotted against the malignancy continuum. Samples are colored based on if they are from different disease stage. |
Top |
Malignant transformation related pathway analysis |
| Find out the enriched GO biological processes and KEGG pathways involved in transition from healthy to precancer to cancer |
| Tissue | Disease Stage | Enriched GO biological Processes |
| Colorectum | AD |  |
| Colorectum | SER |  |
| Colorectum | MSS |  |
| Colorectum | MSI-H |  |
| Colorectum | FAP |  |
| ∗Top 15 enriched GO BP terms are showed in the bar plot of each disease state in each tissue. Each row represents a significant GO biological process which is colored according to the -log10(p.adjust). |
| Page: 1 2 3 4 5 6 7 8 9 |
| GO ID | Tissue | Disease Stage | Description | Gene Ratio | Bg Ratio | pvalue | p.adjust | Count |
| GO:00447728 | Oral cavity | OSCC | mitotic cell cycle phase transition | 255/7305 | 424/18723 | 5.29e-19 | 6.98e-17 | 255 |
| GO:00070592 | Oral cavity | OSCC | chromosome segregation | 206/7305 | 346/18723 | 5.82e-15 | 3.76e-13 | 206 |
| GO:00062603 | Oral cavity | OSCC | DNA replication | 159/7305 | 260/18723 | 3.25e-13 | 1.59e-11 | 159 |
| GO:00482852 | Oral cavity | OSCC | organelle fission | 265/7305 | 488/18723 | 3.22e-12 | 1.27e-10 | 265 |
| GO:007190010 | Oral cavity | OSCC | regulation of protein serine/threonine kinase activity | 201/7305 | 359/18723 | 3.90e-11 | 1.27e-09 | 201 |
| GO:00002801 | Oral cavity | OSCC | nuclear division | 237/7305 | 439/18723 | 9.62e-11 | 2.90e-09 | 237 |
| GO:00988132 | Oral cavity | OSCC | nuclear chromosome segregation | 162/7305 | 281/18723 | 1.56e-10 | 4.56e-09 | 162 |
| GO:000072316 | Oral cavity | OSCC | telomere maintenance | 85/7305 | 131/18723 | 1.72e-09 | 4.09e-08 | 85 |
| GO:00000826 | Oral cavity | OSCC | G1/S transition of mitotic cell cycle | 120/7305 | 214/18723 | 2.86e-07 | 4.40e-06 | 120 |
| GO:00448436 | Oral cavity | OSCC | cell cycle G1/S phase transition | 131/7305 | 241/18723 | 8.77e-07 | 1.20e-05 | 131 |
| GO:19040293 | Oral cavity | OSCC | regulation of cyclin-dependent protein kinase activity | 60/7305 | 98/18723 | 6.90e-06 | 7.56e-05 | 60 |
| GO:00000793 | Oral cavity | OSCC | regulation of cyclin-dependent protein serine/threonine kinase activity | 58/7305 | 94/18723 | 6.92e-06 | 7.57e-05 | 58 |
| GO:00062611 | Oral cavity | OSCC | DNA-dependent DNA replication | 84/7305 | 151/18723 | 2.46e-05 | 2.30e-04 | 84 |
| GO:0006270 | Oral cavity | OSCC | DNA replication initiation | 25/7305 | 34/18723 | 4.63e-05 | 3.90e-04 | 25 |
| GO:00322006 | Oral cavity | OSCC | telomere organization | 85/7305 | 159/18723 | 1.47e-04 | 1.04e-03 | 85 |
| Page: 1 |
| Pathway ID | Tissue | Disease Stage | Description | Gene Ratio | Bg Ratio | pvalue | p.adjust | qvalue | Count |
| hsa041108 | Oral cavity | OSCC | Cell cycle | 118/3704 | 157/8465 | 7.15e-16 | 2.66e-14 | 1.35e-14 | 118 |
| hsa0516928 | Oral cavity | OSCC | Epstein-Barr virus infection | 144/3704 | 202/8465 | 1.08e-15 | 3.60e-14 | 1.83e-14 | 144 |
| hsa0516630 | Oral cavity | OSCC | Human T-cell leukemia virus 1 infection | 150/3704 | 222/8465 | 3.68e-13 | 7.26e-12 | 3.70e-12 | 150 |
| hsa0421820 | Oral cavity | OSCC | Cellular senescence | 112/3704 | 156/8465 | 8.04e-13 | 1.42e-11 | 7.21e-12 | 112 |
| hsa051659 | Oral cavity | OSCC | Human papillomavirus infection | 200/3704 | 331/8465 | 3.83e-10 | 4.93e-09 | 2.51e-09 | 200 |
| hsa041159 | Oral cavity | OSCC | p53 signaling pathway | 57/3704 | 74/8465 | 4.99e-09 | 5.07e-08 | 2.58e-08 | 57 |
| hsa052228 | Oral cavity | OSCC | Small cell lung cancer | 66/3704 | 92/8465 | 4.43e-08 | 3.38e-07 | 1.72e-07 | 66 |
| hsa051618 | Oral cavity | OSCC | Hepatitis B | 103/3704 | 162/8465 | 2.34e-07 | 1.51e-06 | 7.69e-07 | 103 |
| hsa051628 | Oral cavity | OSCC | Measles | 90/3704 | 139/8465 | 4.10e-07 | 2.50e-06 | 1.27e-06 | 90 |
| hsa052038 | Oral cavity | OSCC | Viral carcinogenesis | 124/3704 | 204/8465 | 5.57e-07 | 3.28e-06 | 1.67e-06 | 124 |
| hsa0521510 | Oral cavity | OSCC | Prostate cancer | 66/3704 | 97/8465 | 1.05e-06 | 5.89e-06 | 3.00e-06 | 66 |
| hsa041516 | Oral cavity | OSCC | PI3K-Akt signaling pathway | 185/3704 | 354/8465 | 6.26e-04 | 1.86e-03 | 9.49e-04 | 185 |
| hsa04114 | Oral cavity | OSCC | Oocyte meiosis | 74/3704 | 131/8465 | 2.13e-03 | 5.75e-03 | 2.92e-03 | 74 |
| hsa0411015 | Oral cavity | OSCC | Cell cycle | 118/3704 | 157/8465 | 7.15e-16 | 2.66e-14 | 1.35e-14 | 118 |
| hsa05169113 | Oral cavity | OSCC | Epstein-Barr virus infection | 144/3704 | 202/8465 | 1.08e-15 | 3.60e-14 | 1.83e-14 | 144 |
| hsa05166113 | Oral cavity | OSCC | Human T-cell leukemia virus 1 infection | 150/3704 | 222/8465 | 3.68e-13 | 7.26e-12 | 3.70e-12 | 150 |
| hsa04218110 | Oral cavity | OSCC | Cellular senescence | 112/3704 | 156/8465 | 8.04e-13 | 1.42e-11 | 7.21e-12 | 112 |
| hsa0516514 | Oral cavity | OSCC | Human papillomavirus infection | 200/3704 | 331/8465 | 3.83e-10 | 4.93e-09 | 2.51e-09 | 200 |
| hsa0411514 | Oral cavity | OSCC | p53 signaling pathway | 57/3704 | 74/8465 | 4.99e-09 | 5.07e-08 | 2.58e-08 | 57 |
| hsa0522215 | Oral cavity | OSCC | Small cell lung cancer | 66/3704 | 92/8465 | 4.43e-08 | 3.38e-07 | 1.72e-07 | 66 |
| Page: 1 2 |
Top |
Cell-cell communication analysis |
| Identification of potential cell-cell interactions between two cell types and their ligand-receptor pairs for different disease states |
| Ligand | Receptor | LRpair | Pathway | Tissue | Disease Stage |
| Page: 1 |
Top |
Single-cell gene regulatory network inference analysis |
| Find out the significant the regulons (TFs) and the target genes of each regulon across cell types for different disease states |
| TF | Cell Type | Tissue | Disease Stage | Target Gene | RSS | Regulon Activity |
| ∗The dot plots of a searched regulon are shown for all cell subpopulations in each disease state of each tissue based on the regulon specific score inferred using pySCENIC and by calculating the average expression. |
| Page: 1 |
Top |
Somatic mutation of malignant transformation related genes |
| Annotation of somatic variants for genes involved in malignant transformation |
| Hugo Symbol | Variant Class | Variant Classification | dbSNP RS | HGVSc | HGVSp | HGVSp Short | SWISSPROT | BIOTYPE | SIFT | PolyPhen | Tumor Sample Barcode | Tissue | Histology | Sex | Age | Stage | Therapy Types | Drugs | Outcome |
| CCNE2 | SNV | Missense_Mutation | c.423N>A | p.Met141Ile | p.M141I | O96020 | protein_coding | deleterious(0.02) | probably_damaging(0.993) | TCGA-BH-A0HF-01 | Breast | breast invasive carcinoma | Female | >=65 | I/II | Hormone Therapy | arimidex | SD | |
| CCNE2 | SNV | Missense_Mutation | c.299N>T | p.Ser100Leu | p.S100L | O96020 | protein_coding | deleterious(0) | benign(0.36) | TCGA-D8-A1JJ-01 | Breast | breast invasive carcinoma | Female | <65 | I/II | Chemotherapy | doxorubicine | SD | |
| CCNE2 | SNV | Missense_Mutation | c.130N>C | p.Glu44Gln | p.E44Q | O96020 | protein_coding | tolerated(0.53) | benign(0.047) | TCGA-D8-A1XQ-01 | Breast | breast invasive carcinoma | Female | >=65 | I/II | Unknown | Unknown | SD | |
| CCNE2 | deletion | Frame_Shift_Del | novel | c.1029_1050delNNNNNNNNNNNNNNNNNNNNNN | p.Lys344TrpfsTer20 | p.K344Wfs*20 | O96020 | protein_coding | TCGA-D8-A1Y3-01 | Breast | breast invasive carcinoma | Female | <65 | III/IV | Chemotherapy | doxorubicine+cyclophosphamide | SD | ||
| CCNE2 | SNV | Missense_Mutation | rs776621866 | c.368N>C | p.Arg123Thr | p.R123T | O96020 | protein_coding | tolerated(0.98) | benign(0.003) | TCGA-C5-A902-01 | Cervix | cervical & endocervical cancer | Female | <65 | I/II | Chemotherapy | cisplatin | SD |
| CCNE2 | SNV | Missense_Mutation | rs754771951 | c.283C>A | p.Leu95Ile | p.L95I | O96020 | protein_coding | tolerated(0.31) | benign(0.382) | TCGA-AA-A010-01 | Colorectum | colon adenocarcinoma | Female | <65 | I/II | Chemotherapy | folinic | CR |
| CCNE2 | SNV | Missense_Mutation | novel | c.1034N>A | p.Thr345Asn | p.T345N | O96020 | protein_coding | tolerated(0.41) | benign(0) | TCGA-CA-6717-01 | Colorectum | colon adenocarcinoma | Male | <65 | I/II | Chemotherapy | oxaliplatin | CR |
| CCNE2 | SNV | Missense_Mutation | novel | c.136G>A | p.Val46Ile | p.V46I | O96020 | protein_coding | tolerated(0.61) | benign(0) | TCGA-AG-3726-01 | Colorectum | rectum adenocarcinoma | Female | <65 | I/II | Unknown | Unknown | SD |
| CCNE2 | SNV | Missense_Mutation | novel | c.838N>T | p.Asp280Tyr | p.D280Y | O96020 | protein_coding | deleterious(0) | probably_damaging(1) | TCGA-AG-A002-01 | Colorectum | rectum adenocarcinoma | Male | <65 | I/II | Unknown | Unknown | SD |
| CCNE2 | SNV | Missense_Mutation | novel | c.175N>T | p.Pro59Ser | p.P59S | O96020 | protein_coding | tolerated(1) | benign(0.003) | TCGA-F5-6814-01 | Colorectum | rectum adenocarcinoma | Male | <65 | I/II | Unknown | Unknown | SD |
| Page: 1 2 3 4 5 |
Top |
Related drugs of malignant transformation related genes |
| Identification of chemicals and drugs interact with genes involved in malignant transfromation |
| (DGIdb 4.0) |
| Entrez ID | Symbol | Category | Interaction Types | Drug Claim Name | Drug Name | PMIDs |
| Page: 1 |

Copyright 2023-Present -The University of Texas Health Science Center at Houston |