
|
|||||
|
 | |
| |
| |
| |
| |
| |
|
Gene: CCND3 |
Gene summary for CCND3 |
| Gene information | Species | Human | Gene symbol | CCND3 | Gene ID | 896 |
| Gene name | cyclin D3 | |
| Gene Alias | CCND3 | |
| Cytomap | 6p21.1 | |
| Gene Type | protein-coding | GO ID | GO:0000079 | UniProtAcc | P30281 |
Top |
Malignant transformation analysis |
| Identification of the aberrant gene expression in precancerous and cancerous lesions by comparing the gene expression of stem-like cells in diseased tissues with normal stem cells |
| Entrez ID | Symbol | Replicates | Species | Organ | Tissue | Adj P-value | Log2FC | Malignancy |
| 896 | CCND3 | EEC-subject4 | Human | Endometrium | EEC | 2.64e-02 | 1.51e-01 | -0.2571 |
| 896 | CCND3 | GSM6177620_NYU_UCEC1_lib2_lib2 | Human | Endometrium | EEC | 8.04e-03 | 9.38e-02 | -0.1875 |
| 896 | CCND3 | GSM6177621_NYU_UCEC2_lib1_lib1 | Human | Endometrium | EEC | 1.78e-05 | -2.40e-02 | -0.1934 |
| 896 | CCND3 | GSM6177622_NYU_UCEC3_lib1_lib1 | Human | Endometrium | EEC | 1.88e-06 | 1.81e-02 | -0.1917 |
| 896 | CCND3 | LZE4T | Human | Esophagus | ESCC | 4.21e-02 | 9.29e-02 | 0.0811 |
| 896 | CCND3 | LZE7T | Human | Esophagus | ESCC | 3.22e-08 | 3.58e-01 | 0.0667 |
| 896 | CCND3 | LZE8T | Human | Esophagus | ESCC | 4.16e-02 | 5.92e-02 | 0.067 |
| 896 | CCND3 | LZE20T | Human | Esophagus | ESCC | 9.88e-05 | 1.29e-02 | 0.0662 |
| 896 | CCND3 | LZE22T | Human | Esophagus | ESCC | 1.55e-02 | 3.09e-01 | 0.068 |
| 896 | CCND3 | LZE24T | Human | Esophagus | ESCC | 3.80e-32 | 9.54e-01 | 0.0596 |
| 896 | CCND3 | LZE6T | Human | Esophagus | ESCC | 2.25e-02 | 2.32e-01 | 0.0845 |
| 896 | CCND3 | P1T-E | Human | Esophagus | ESCC | 2.88e-02 | 2.73e-01 | 0.0875 |
| 896 | CCND3 | P2T-E | Human | Esophagus | ESCC | 2.64e-42 | 7.95e-01 | 0.1177 |
| 896 | CCND3 | P4T-E | Human | Esophagus | ESCC | 3.85e-17 | 3.89e-01 | 0.1323 |
| 896 | CCND3 | P5T-E | Human | Esophagus | ESCC | 1.37e-13 | 5.21e-01 | 0.1327 |
| 896 | CCND3 | P8T-E | Human | Esophagus | ESCC | 3.43e-18 | 4.19e-01 | 0.0889 |
| 896 | CCND3 | P9T-E | Human | Esophagus | ESCC | 1.51e-09 | 2.62e-01 | 0.1131 |
| 896 | CCND3 | P10T-E | Human | Esophagus | ESCC | 5.85e-09 | 8.91e-02 | 0.116 |
| 896 | CCND3 | P11T-E | Human | Esophagus | ESCC | 9.80e-07 | 4.57e-01 | 0.1426 |
| 896 | CCND3 | P12T-E | Human | Esophagus | ESCC | 4.51e-10 | 2.70e-01 | 0.1122 |
| Page: 1 2 3 4 5 6 7 |
| Tissue | Expression Dynamics | Abbreviation |
| Endometrium | 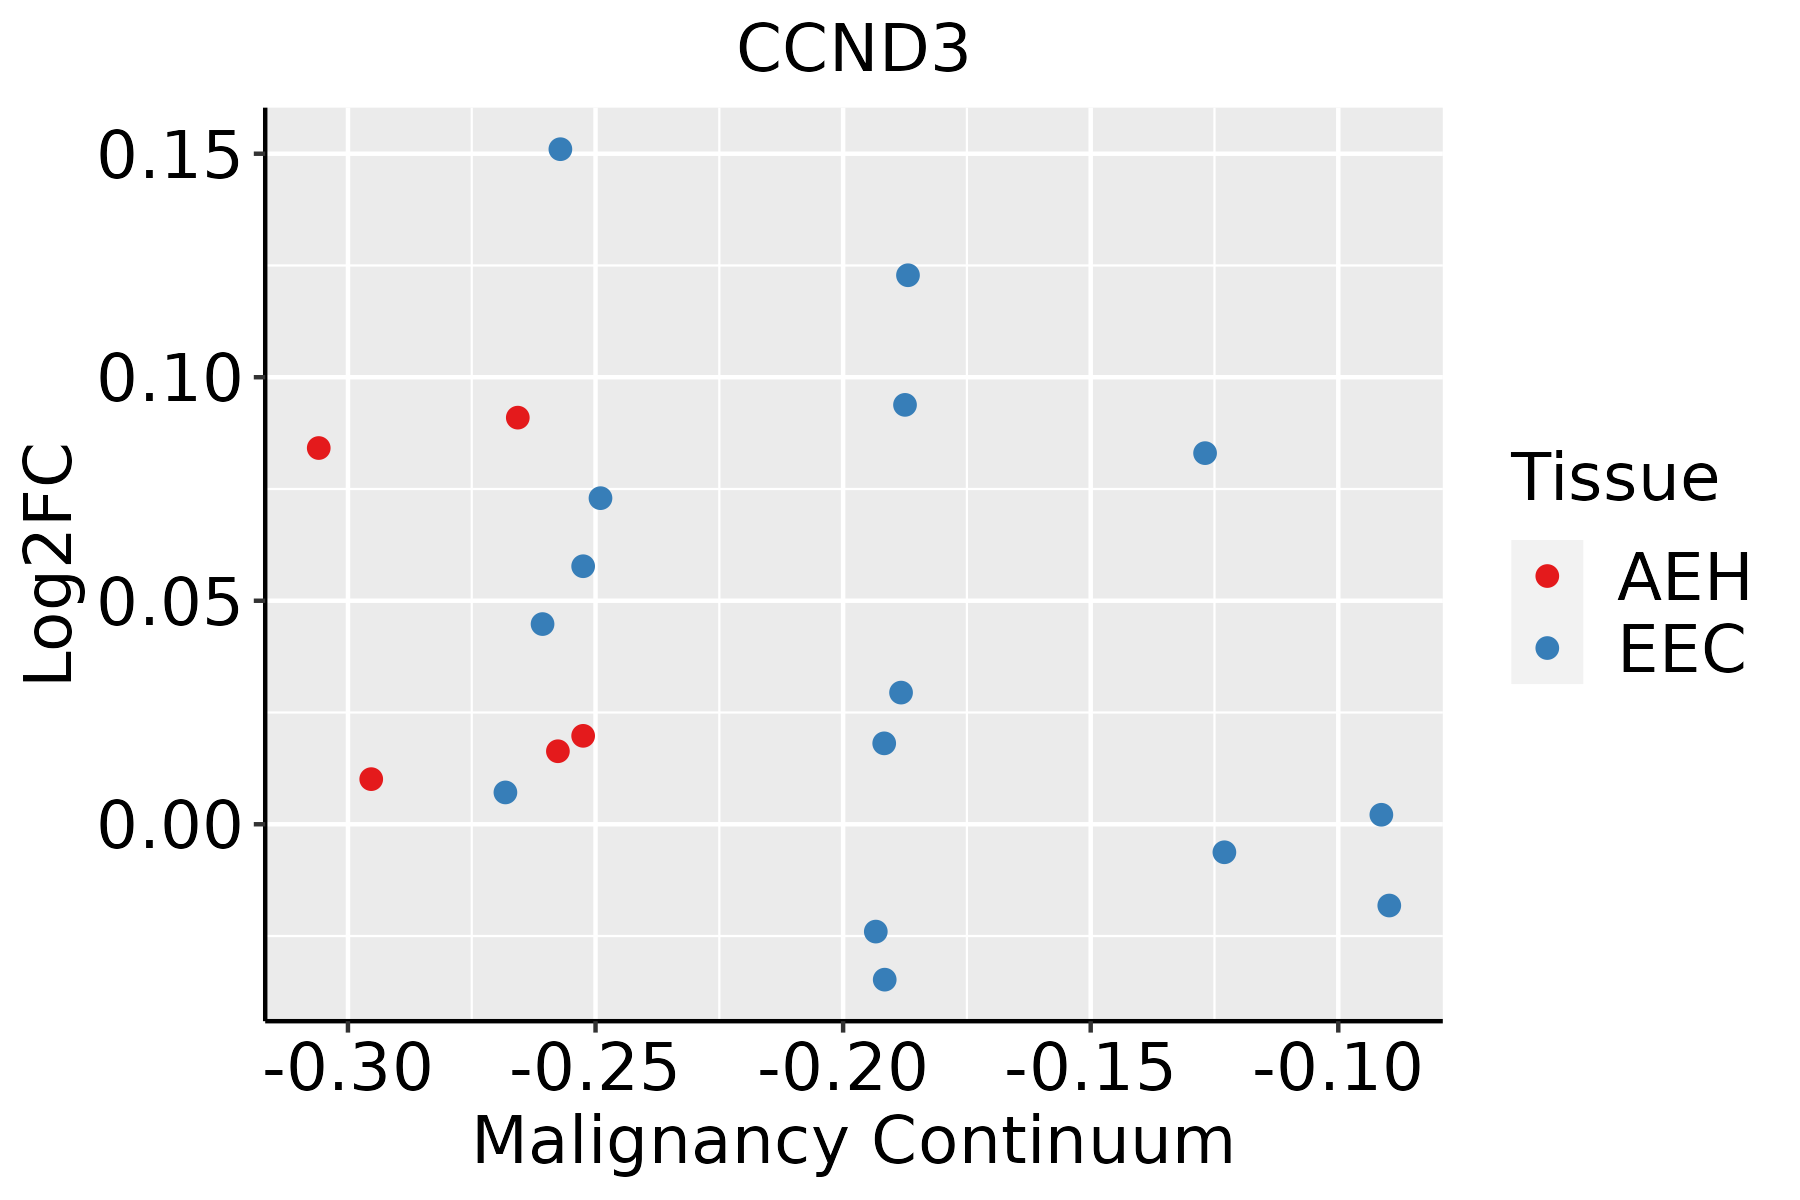 | AEH: Atypical endometrial hyperplasia |
| EEC: Endometrioid Cancer | ||
| Esophagus |  | ESCC: Esophageal squamous cell carcinoma |
| HGIN: High-grade intraepithelial neoplasias | ||
| LGIN: Low-grade intraepithelial neoplasias | ||
| Liver | 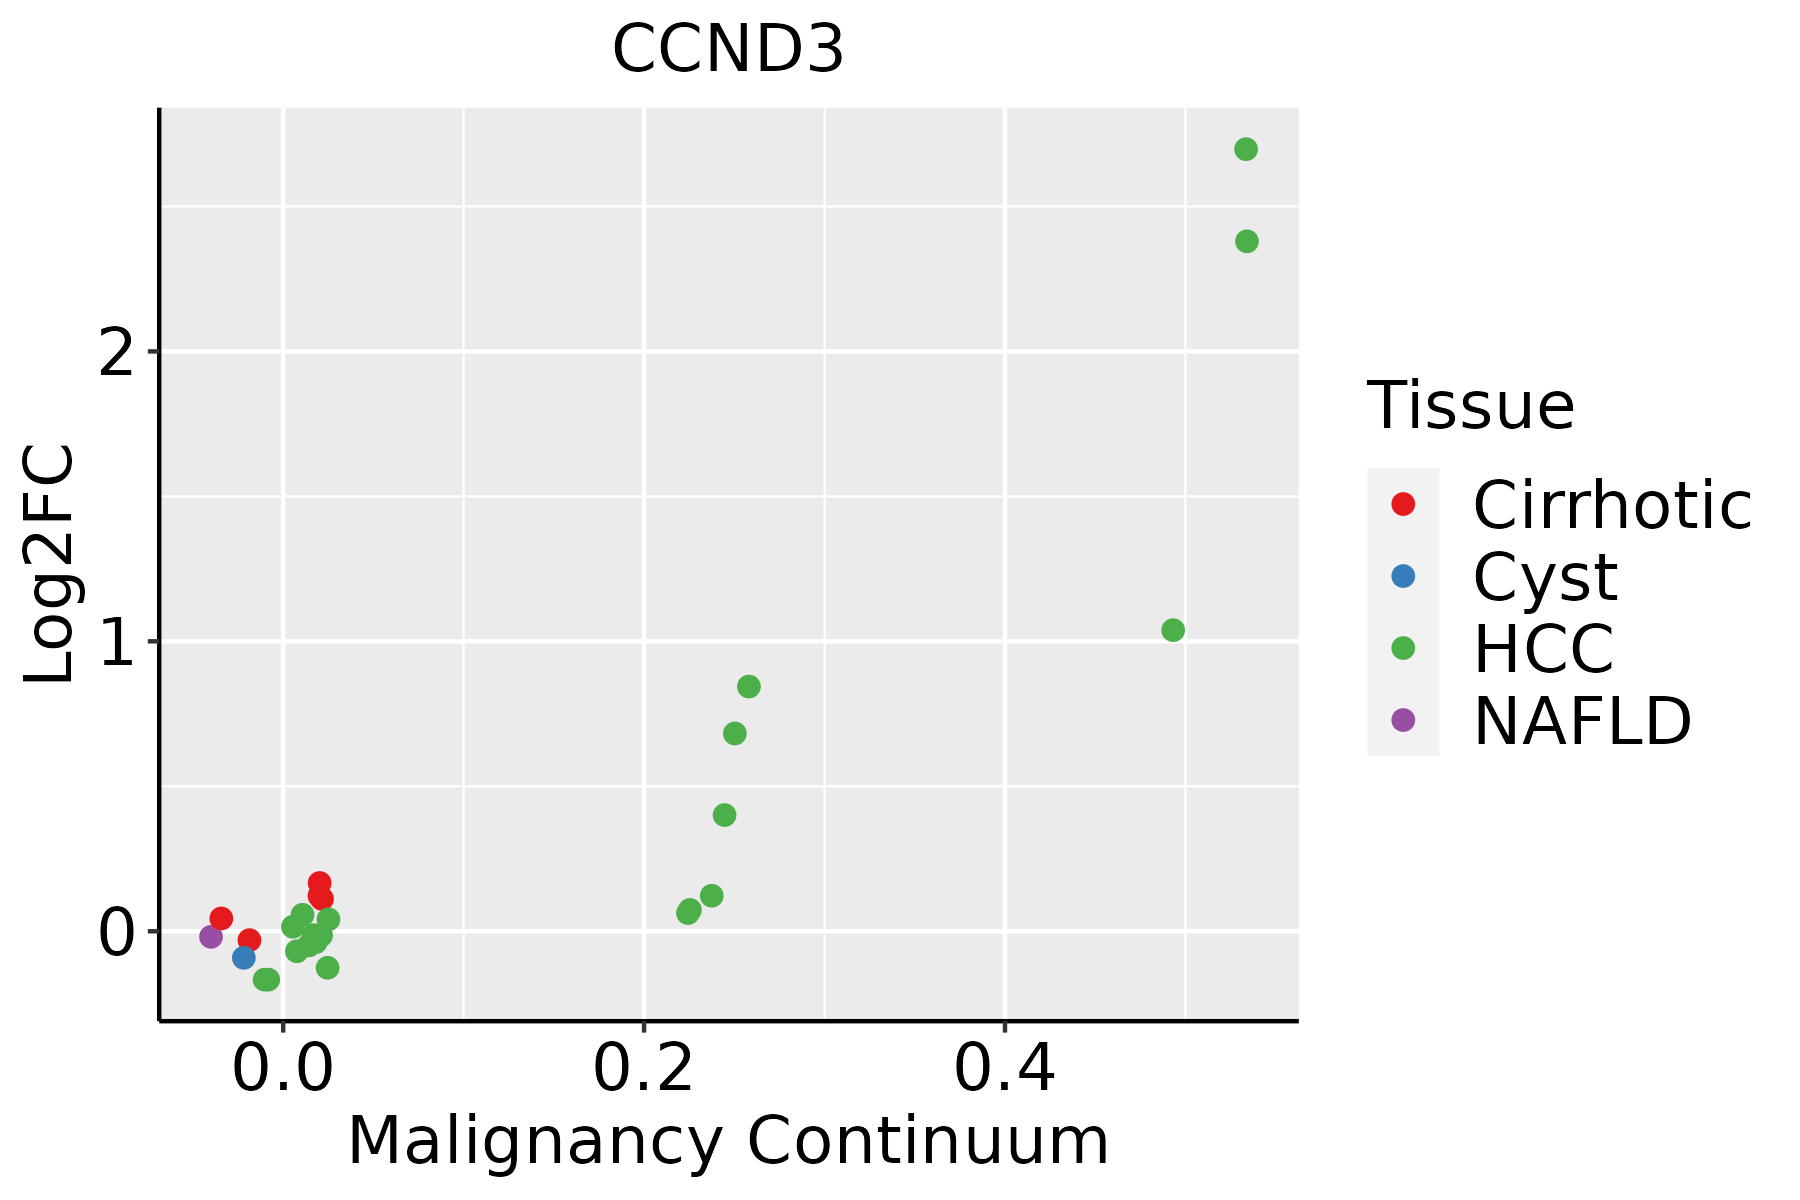 | HCC: Hepatocellular carcinoma |
| NAFLD: Non-alcoholic fatty liver disease | ||
| Lung | 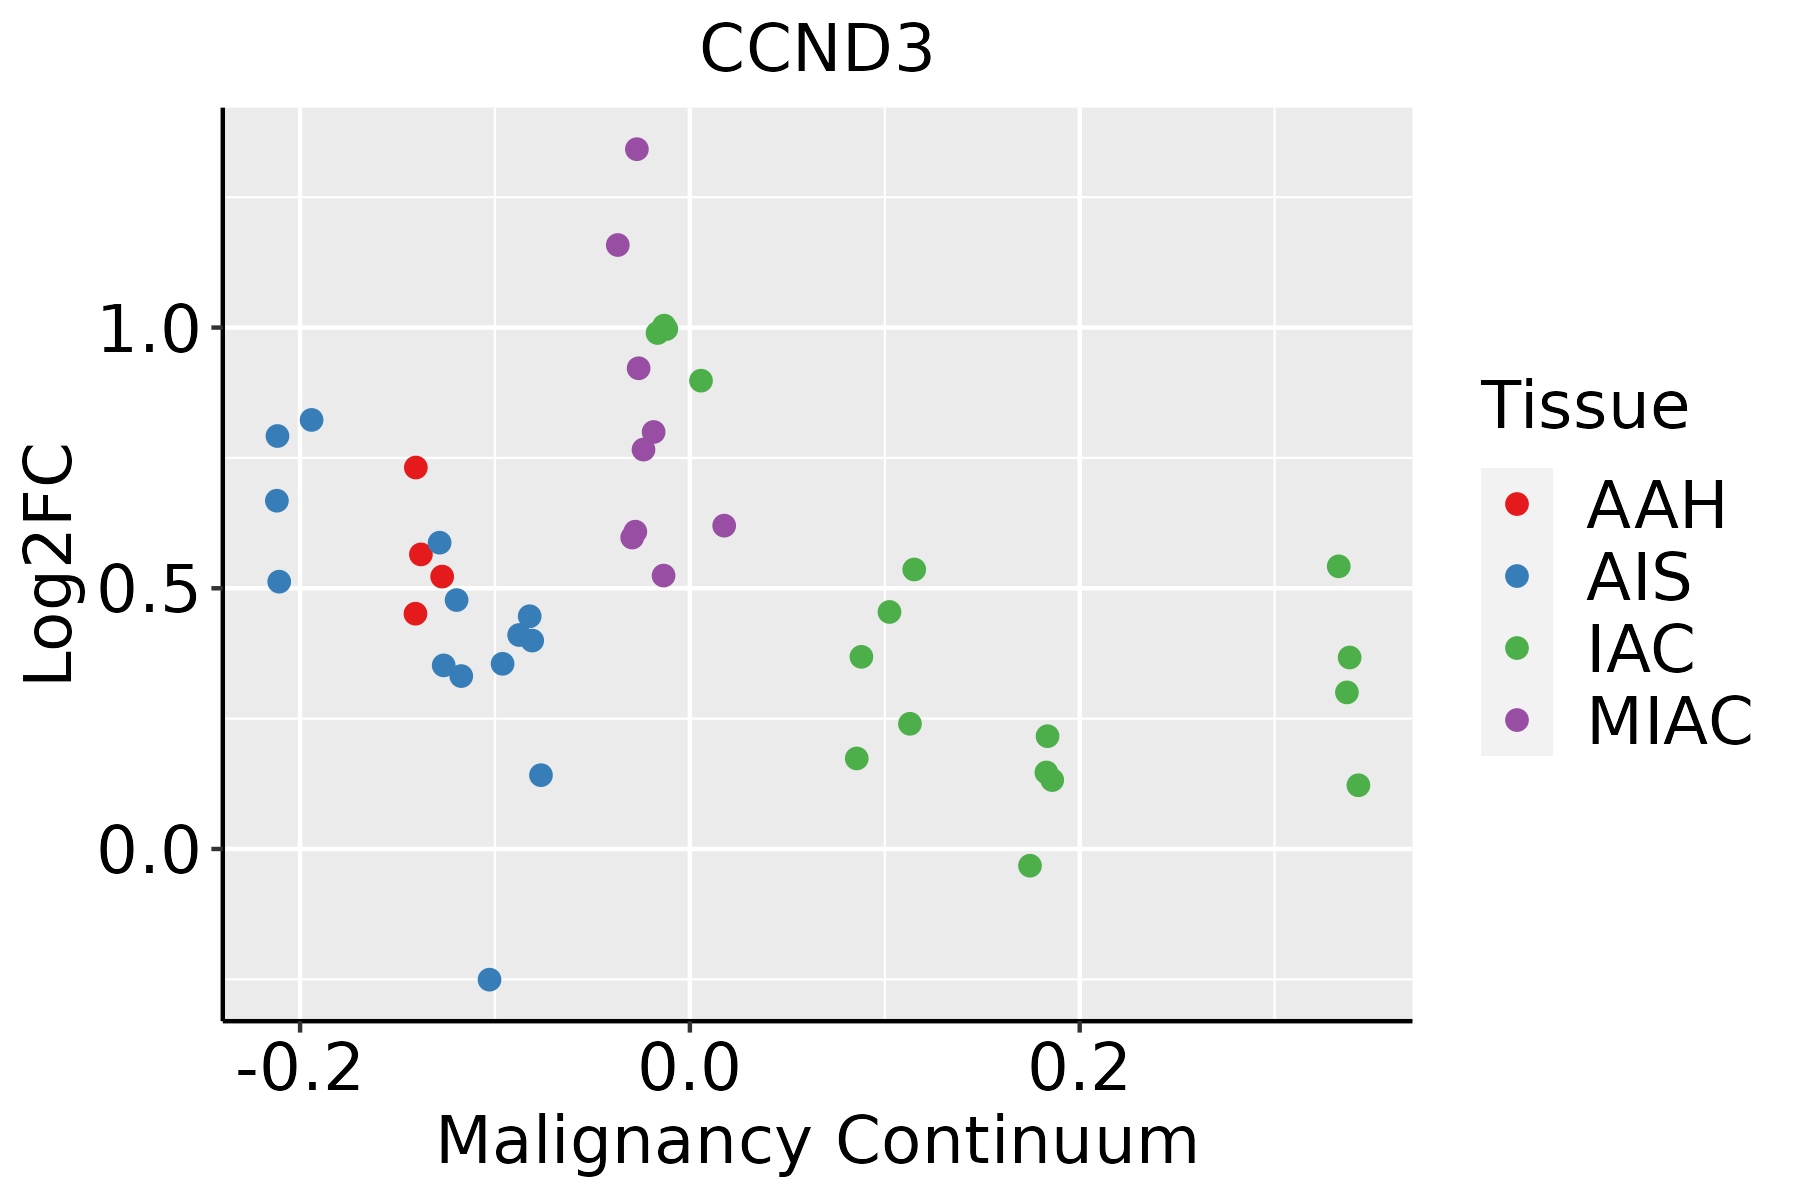 | AAH: Atypical adenomatous hyperplasia |
| AIS: Adenocarcinoma in situ | ||
| IAC: Invasive lung adenocarcinoma | ||
| MIA: Minimally invasive adenocarcinoma | ||
| Oral Cavity |  | EOLP: Erosive Oral lichen planus |
| LP: leukoplakia | ||
| NEOLP: Non-erosive oral lichen planus | ||
| OSCC: Oral squamous cell carcinoma | ||
| Thyroid |  | ATC: Anaplastic thyroid cancer |
| HT: Hashimoto's thyroiditis | ||
| PTC: Papillary thyroid cancer |
| ∗log2FC in expression of this searched gene in stem-like cells from each diseased tissue sample relative to stem-like cells in normal samples in each tissue plotted against the malignancy continuum. Samples are colored based on if they are from different disease stage. |
Top |
Malignant transformation related pathway analysis |
| Find out the enriched GO biological processes and KEGG pathways involved in transition from healthy to precancer to cancer |
| Tissue | Disease Stage | Enriched GO biological Processes |
| Colorectum | AD |  |
| Colorectum | SER |  |
| Colorectum | MSS |  |
| Colorectum | MSI-H |  |
| Colorectum | FAP |  |
| ∗Top 15 enriched GO BP terms are showed in the bar plot of each disease state in each tissue. Each row represents a significant GO biological process which is colored according to the -log10(p.adjust). |
| Page: 1 2 3 4 5 6 7 8 9 |
| GO ID | Tissue | Disease Stage | Description | Gene Ratio | Bg Ratio | pvalue | p.adjust | Count |
| GO:190165314 | Endometrium | EEC | cellular response to peptide | 68/2168 | 359/18723 | 2.75e-05 | 4.83e-04 | 68 |
| GO:003367415 | Endometrium | EEC | positive regulation of kinase activity | 83/2168 | 467/18723 | 4.32e-05 | 7.10e-04 | 83 |
| GO:004211014 | Endometrium | EEC | T cell activation | 85/2168 | 487/18723 | 6.81e-05 | 1.01e-03 | 85 |
| GO:004343416 | Endometrium | EEC | response to peptide hormone | 74/2168 | 414/18723 | 9.11e-05 | 1.28e-03 | 74 |
| GO:004578713 | Endometrium | EEC | positive regulation of cell cycle | 59/2168 | 313/18723 | 1.04e-04 | 1.44e-03 | 59 |
| GO:004586014 | Endometrium | EEC | positive regulation of protein kinase activity | 69/2168 | 386/18723 | 1.55e-04 | 1.96e-03 | 69 |
| GO:007190212 | Endometrium | EEC | positive regulation of protein serine/threonine kinase activity | 39/2168 | 200/18723 | 7.39e-04 | 7.01e-03 | 39 |
| GO:007190013 | Endometrium | EEC | regulation of protein serine/threonine kinase activity | 62/2168 | 359/18723 | 8.17e-04 | 7.61e-03 | 62 |
| GO:004477213 | Endometrium | EEC | mitotic cell cycle phase transition | 71/2168 | 424/18723 | 8.68e-04 | 7.97e-03 | 71 |
| GO:007137513 | Endometrium | EEC | cellular response to peptide hormone stimulus | 52/2168 | 290/18723 | 8.77e-04 | 8.01e-03 | 52 |
| GO:009006812 | Endometrium | EEC | positive regulation of cell cycle process | 44/2168 | 236/18723 | 9.39e-04 | 8.42e-03 | 44 |
| GO:003286914 | Endometrium | EEC | cellular response to insulin stimulus | 39/2168 | 203/18723 | 9.93e-04 | 8.79e-03 | 39 |
| GO:000828613 | Endometrium | EEC | insulin receptor signaling pathway | 25/2168 | 116/18723 | 1.50e-03 | 1.21e-02 | 25 |
| GO:004209814 | Endometrium | EEC | T cell proliferation | 37/2168 | 199/18723 | 2.40e-03 | 1.77e-02 | 37 |
| GO:004593113 | Endometrium | EEC | positive regulation of mitotic cell cycle | 25/2168 | 121/18723 | 2.76e-03 | 1.97e-02 | 25 |
| GO:003286814 | Endometrium | EEC | response to insulin | 46/2168 | 264/18723 | 3.01e-03 | 2.10e-02 | 46 |
| GO:19019893 | Endometrium | EEC | positive regulation of cell cycle phase transition | 23/2168 | 115/18723 | 6.04e-03 | 3.57e-02 | 23 |
| GO:00073467 | Endometrium | EEC | regulation of mitotic cell cycle | 70/2168 | 457/18723 | 8.76e-03 | 4.74e-02 | 70 |
| GO:004477216 | Esophagus | ESCC | mitotic cell cycle phase transition | 281/8552 | 424/18723 | 4.63e-18 | 4.45e-16 | 281 |
| GO:000734615 | Esophagus | ESCC | regulation of mitotic cell cycle | 293/8552 | 457/18723 | 8.00e-16 | 5.64e-14 | 293 |
| Page: 1 2 3 4 5 6 7 8 9 10 11 12 13 |
| Pathway ID | Tissue | Disease Stage | Description | Gene Ratio | Bg Ratio | pvalue | p.adjust | qvalue | Count |
| hsa0421825 | Endometrium | EEC | Cellular senescence | 40/1237 | 156/8465 | 1.89e-04 | 1.68e-03 | 1.25e-03 | 40 |
| hsa0516627 | Endometrium | EEC | Human T-cell leukemia virus 1 infection | 52/1237 | 222/8465 | 2.73e-04 | 2.36e-03 | 1.76e-03 | 52 |
| hsa0439023 | Endometrium | EEC | Hippo signaling pathway | 39/1237 | 157/8465 | 4.54e-04 | 3.47e-03 | 2.59e-03 | 39 |
| hsa0516925 | Endometrium | EEC | Epstein-Barr virus infection | 47/1237 | 202/8465 | 6.17e-04 | 4.41e-03 | 3.29e-03 | 47 |
| hsa0421835 | Endometrium | EEC | Cellular senescence | 40/1237 | 156/8465 | 1.89e-04 | 1.68e-03 | 1.25e-03 | 40 |
| hsa0516636 | Endometrium | EEC | Human T-cell leukemia virus 1 infection | 52/1237 | 222/8465 | 2.73e-04 | 2.36e-03 | 1.76e-03 | 52 |
| hsa0439033 | Endometrium | EEC | Hippo signaling pathway | 39/1237 | 157/8465 | 4.54e-04 | 3.47e-03 | 2.59e-03 | 39 |
| hsa0516934 | Endometrium | EEC | Epstein-Barr virus infection | 47/1237 | 202/8465 | 6.17e-04 | 4.41e-03 | 3.29e-03 | 47 |
| hsa0411023 | Esophagus | ESCC | Cell cycle | 126/4205 | 157/8465 | 1.34e-15 | 5.60e-14 | 2.87e-14 | 126 |
| hsa05166211 | Esophagus | ESCC | Human T-cell leukemia virus 1 infection | 164/4205 | 222/8465 | 8.13e-14 | 2.09e-12 | 1.07e-12 | 164 |
| hsa05169210 | Esophagus | ESCC | Epstein-Barr virus infection | 151/4205 | 202/8465 | 1.55e-13 | 3.45e-12 | 1.77e-12 | 151 |
| hsa0411524 | Esophagus | ESCC | p53 signaling pathway | 65/4205 | 74/8465 | 3.88e-12 | 6.50e-11 | 3.33e-11 | 65 |
| hsa0421829 | Esophagus | ESCC | Cellular senescence | 119/4205 | 156/8465 | 5.89e-12 | 9.40e-11 | 4.81e-11 | 119 |
| hsa0516425 | Esophagus | ESCC | Influenza A | 122/4205 | 171/8465 | 5.01e-09 | 4.79e-08 | 2.45e-08 | 122 |
| hsa0516510 | Esophagus | ESCC | Human papillomavirus infection | 215/4205 | 331/8465 | 7.86e-09 | 7.12e-08 | 3.65e-08 | 215 |
| hsa0520325 | Esophagus | ESCC | Viral carcinogenesis | 137/4205 | 204/8465 | 2.47e-07 | 1.88e-06 | 9.62e-07 | 137 |
| hsa0451020 | Esophagus | ESCC | Focal adhesion | 127/4205 | 203/8465 | 1.25e-04 | 4.99e-04 | 2.56e-04 | 127 |
| hsa051629 | Esophagus | ESCC | Measles | 90/4205 | 139/8465 | 2.16e-04 | 7.87e-04 | 4.03e-04 | 90 |
| hsa041517 | Esophagus | ESCC | PI3K-Akt signaling pathway | 197/4205 | 354/8465 | 1.24e-02 | 2.83e-02 | 1.45e-02 | 197 |
| hsa0439018 | Esophagus | ESCC | Hippo signaling pathway | 92/4205 | 157/8465 | 1.46e-02 | 3.31e-02 | 1.69e-02 | 92 |
| Page: 1 2 3 4 5 6 7 8 |
Top |
Cell-cell communication analysis |
| Identification of potential cell-cell interactions between two cell types and their ligand-receptor pairs for different disease states |
| Ligand | Receptor | LRpair | Pathway | Tissue | Disease Stage |
| Page: 1 |
Top |
Single-cell gene regulatory network inference analysis |
| Find out the significant the regulons (TFs) and the target genes of each regulon across cell types for different disease states |
| TF | Cell Type | Tissue | Disease Stage | Target Gene | RSS | Regulon Activity |
| ∗The dot plots of a searched regulon are shown for all cell subpopulations in each disease state of each tissue based on the regulon specific score inferred using pySCENIC and by calculating the average expression. |
| Page: 1 |
Top |
Somatic mutation of malignant transformation related genes |
| Annotation of somatic variants for genes involved in malignant transformation |
| Hugo Symbol | Variant Class | Variant Classification | dbSNP RS | HGVSc | HGVSp | HGVSp Short | SWISSPROT | BIOTYPE | SIFT | PolyPhen | Tumor Sample Barcode | Tissue | Histology | Sex | Age | Stage | Therapy Types | Drugs | Outcome |
| CCND3 | SNV | Missense_Mutation | c.314N>A | p.Val105Asp | p.V105D | P30281 | protein_coding | deleterious(0.01) | probably_damaging(0.944) | TCGA-D8-A145-01 | Breast | breast invasive carcinoma | Female | >=65 | I/II | Hormone Therapy | tamoxiphen | SD | |
| CCND3 | SNV | Missense_Mutation | c.833C>G | p.Pro278Arg | p.P278R | P30281 | protein_coding | tolerated(0.44) | benign(0.115) | TCGA-E2-A1IE-01 | Breast | breast invasive carcinoma | Female | <65 | I/II | Chemotherapy | doxorubicin | PD | |
| CCND3 | SNV | Missense_Mutation | novel | c.332N>A | p.Ser111Tyr | p.S111Y | P30281 | protein_coding | deleterious(0) | probably_damaging(0.997) | TCGA-A6-2672-01 | Colorectum | colon adenocarcinoma | Female | >=65 | III/IV | Unknown | Unknown | SD |
| CCND3 | SNV | Missense_Mutation | c.731A>G | p.Gln244Arg | p.Q244R | P30281 | protein_coding | deleterious(0) | probably_damaging(0.976) | TCGA-D5-6930-01 | Colorectum | colon adenocarcinoma | Male | >=65 | I/II | Unknown | Unknown | SD | |
| CCND3 | SNV | Missense_Mutation | novel | c.737N>T | p.Gln246Leu | p.Q246L | P30281 | protein_coding | deleterious(0.02) | possibly_damaging(0.458) | TCGA-AG-A00Y-01 | Colorectum | rectum adenocarcinoma | Male | >=65 | I/II | Unknown | Unknown | PD |
| CCND3 | SNV | Missense_Mutation | rs374294883 | c.521G>A | p.Arg174Gln | p.R174Q | P30281 | protein_coding | tolerated(0.14) | benign(0.306) | TCGA-AJ-A3EK-01 | Endometrium | uterine corpus endometrioid carcinoma | Female | <65 | I/II | Chemotherapy | carboplatin | CR |
| CCND3 | SNV | Missense_Mutation | novel | c.284G>A | p.Arg95Gln | p.R95Q | P30281 | protein_coding | tolerated(0.31) | benign(0.129) | TCGA-AP-A1DV-01 | Endometrium | uterine corpus endometrioid carcinoma | Female | <65 | I/II | Unknown | Unknown | SD |
| CCND3 | SNV | Missense_Mutation | novel | c.742G>A | p.Glu248Lys | p.E248K | P30281 | protein_coding | deleterious(0) | probably_damaging(1) | TCGA-AX-A2HC-01 | Endometrium | uterine corpus endometrioid carcinoma | Female | <65 | III/IV | Chemotherapy | paclitaxel | PD |
| CCND3 | SNV | Missense_Mutation | rs142862109 | c.797C>T | p.Ala266Val | p.A266V | P30281 | protein_coding | tolerated(0.33) | benign(0) | TCGA-B5-A11E-01 | Endometrium | uterine corpus endometrioid carcinoma | Female | <65 | I/II | Unknown | Unknown | SD |
| CCND3 | SNV | Missense_Mutation | c.574G>T | p.Asp192Tyr | p.D192Y | P30281 | protein_coding | deleterious(0) | probably_damaging(0.986) | TCGA-B5-A11E-01 | Endometrium | uterine corpus endometrioid carcinoma | Female | <65 | I/II | Unknown | Unknown | SD |
| Page: 1 2 3 |
Top |
Related drugs of malignant transformation related genes |
| Identification of chemicals and drugs interact with genes involved in malignant transfromation |
| (DGIdb 4.0) |
| Entrez ID | Symbol | Category | Interaction Types | Drug Claim Name | Drug Name | PMIDs |
| 896 | CCND3 | CLINICALLY ACTIONABLE, KINASE, TRANSCRIPTION FACTOR, DRUGGABLE GENOME | PALBOCICLIB | PALBOCICLIB | 23079656 | |
| 896 | CCND3 | CLINICALLY ACTIONABLE, KINASE, TRANSCRIPTION FACTOR, DRUGGABLE GENOME | LY2835219 | ABEMACICLIB | ||
| 896 | CCND3 | CLINICALLY ACTIONABLE, KINASE, TRANSCRIPTION FACTOR, DRUGGABLE GENOME | BAY1000394 | |||
| 896 | CCND3 | CLINICALLY ACTIONABLE, KINASE, TRANSCRIPTION FACTOR, DRUGGABLE GENOME | LEE011 | RIBOCICLIB | ||
| 896 | CCND3 | CLINICALLY ACTIONABLE, KINASE, TRANSCRIPTION FACTOR, DRUGGABLE GENOME | PD 0332991 |
| Page: 1 |

Copyright 2023-Present -The University of Texas Health Science Center at Houston |